Beyond Jellyfish: The Evolutionary Diversity and Biomedical Applications of GFP Analogs
This article provides a comprehensive exploration of the Green Fluorescent Protein (GFP) family, tracing its phylogenetic journey from its discovery in Aequorea victoria to the vast diversity of analogs found...
Beyond Jellyfish: The Evolutionary Diversity and Biomedical Applications of GFP Analogs
Abstract
This article provides a comprehensive exploration of the Green Fluorescent Protein (GFP) family, tracing its phylogenetic journey from its discovery in Aequorea victoria to the vast diversity of analogs found in coral reef Anthozoa. It details the structural and spectral evolution of these proteins, which has enabled a rainbow of fluorescent tools for biomedical research. For scientists and drug development professionals, the article critically examines the practical applications of these tools in receptor research, drug screening, and cellular tracking, while also addressing significant experimental challenges such as cytotoxicity, immunogenicity, and proper maturation kinetics. A comparative analysis of available analogs provides a framework for selecting optimal proteins for specific research goals, from high-throughput screening to advanced imaging in complex physiological models.
From Aequorea to Anthozoa: Unraveling the Evolutionary Tree of Fluorescent Proteins
The discovery of the Green Fluorescent Protein (GFP) in the jellyfish Aequorea victoria and its intricate relationship with the photoprotein aequorin represents a cornerstone in the field of bioluminescence and a pivotal event for modern biological research. This system not only provides a classic example of fluorescence resonance energy transfer (FRET) in nature but also serves as a critical reference point in the phylogenetic distribution of GFP analogs across the tree of life. The initial identification was almost incidental; GFP was discovered fortuitously in 1962 by Osamu Shimomura and colleagues during their efforts to purify the bioluminescent protein aequorin from A. victoria [1] [2]. The subsequent realization that the green light emission was the result of non-radiative energy transfer from the blue-light-emitting aequorin to GFP provided a fundamental understanding of the jellyfish's bioluminescent system [1]. This natural FRET pair has since become a paradigmatic model for understanding molecular interactions and energy transfer, its principles now applied in countless laboratory-designed biosensors. For researchers investigating the evolutionary history of fluorescent proteins, the A. victoria GFP-aequorin system provides an essential anatomical and functional benchmark against which other discovered and resurrected fluorescent proteins can be compared [3].
Historical Context and Key Discoveries
The elucidation of the A. victoria light system was a feat of persistent biochemical effort. The following table summarizes the key milestones and the scientists involved.
Table 1: Historical Milestones in the Discovery of the Aequorea victoria GFP-Aequorin System
| Year | Key Discovery/Event | Principal Scientist(s) | Significance |
|---|---|---|---|
| 1962 | Initial purification of aequorin and incidental discovery of a "green protein" | Osamu Shimomura et al. | First identification of GFP as a footnote; established the calcium-dependent bioluminescence of aequorin [1] [2]. |
| 1960s-1970s | Method development for large-scale protein collection from jellyfish | Shimomura, Frank Johnson | Enabled biochemical characterization by processing ~850,000 jellyfish to obtain sufficient protein for study [2]. |
| 1974 | Reconstitution of energy transfer from aequorin to GFP in vitro | Morise et al. | Provided direct experimental insight into the FRET mechanism, demonstrating that aequorin's blue emission stimulates GFP's green light [1]. |
| 1992 | Cloning and sequencing of the GFP gene | Douglas Prasher | Enabled the genetic manipulation of GFP, opening the door for its use as a universal genetic tag [1] [2]. |
| 1994 | Demonstration of GFP as a marker for gene expression in living organisms | Martin Chalfie et al. | Proved GFP could be expressed and would fluoresce in other species, revolutionizing cell biology [1]. |
The discovery process was arduous. Shimomura and his colleagues collected and processed an estimated 850,000 jellyfish over multiple seasons, manually cutting the light-emitting rings from each specimen to obtain a few hundred milligrams of the key proteins [2]. A critical breakthrough came when Shimomura observed that the luminescent material, when washed down a sink with seawater, emitted a bright blue flash. He correctly hypothesized that calcium ions (Ca²⁺) in the seawater triggered the light emission, leading to the identification and naming of the photoprotein aequorin [2]. During the subsequent purification of aequorin using column chromatography, a second, green-colored protein was consistently isolated alongside it. This was the "green protein," later renamed Green Fluorescent Protein [2].
Molecular Mechanism and the FRET Relationship
The bioluminescent system of A. victoria is a two-component process involving a precise intermolecular energy transfer.
The Aequorin-GFP FRET Pathway
In the jellyfish, a mechanical stimulus (e.g., touch) triggers the release of calcium ions within the light organs. Aequorin, a blue-light-emitting photoprotein, binds these Ca²⁺ ions, which catalyzes the oxidation of its bound coelenterazine substrate, resulting in the emission of blue light (~470 nm) [4] [2]. This blue light is not the light we see from the jellyfish. Instead, the energy is non-radiatively transferred to GFP. The GFP chromophore absorbs this energy and re-emits it as lower-energy, green light (~508 nm) [1] [4]. This process is a natural example of Fluorescence Resonance Energy Transfer (FRET).
Principles of FRET
FRET is a mechanism for energy transfer between two light-sensitive molecules (chromophores) based on long-range dipole-dipole interactions [5]. For FRET to occur efficiently, several critical conditions must be met [4] [6] [5]:
- Spectral Overlap: The fluorescence emission spectrum of the donor (aequorin) must significantly overlap with the absorption (excitation) spectrum of the acceptor (GFP). This overlap is quantified by the overlap integral, J.
- Proximity: The donor and acceptor must be in close proximity, typically within 1-10 nanometers. The efficiency of energy transfer (E) is inversely proportional to the sixth power of the distance (r) between the two chromophores: E = 1 / [1 + (r/R₀)⁶], where R₀ is the Förster distance at which efficiency is 50%.
- Orientation: The relative orientation of the donor emission dipole and the acceptor absorption dipole must be favorable, described by the orientation factor, κ² (ranging from 0 for perpendicular to 4 for parallel dipoles).
The aequorin-GFP pair meets all these criteria perfectly, making the energy transfer in the jellyfish highly efficient.
Experimental Protocols for Key Assays
The study of this system relies on well-established biochemical and biophysical methods.
Protocol 1: Purification of Aequorin and GFP fromA. victoria
This protocol is adapted from the original methods developed by Shimomura [2].
- Objective: To isolate functional aequorin and GFP proteins from jellyfish specimens.
- Materials:
- Live A. victoria jellyfish.
- Homogenization buffer (e.g., low-pH EDTA buffer to chelate Ca²⁺ and prevent aequorin consumption).
- Chromatography equipment (e.g., for gel filtration, ion-exchange).
- Saturated ammonium sulfate solution.
- Procedure:
- Collection and Dissection: Collect live jellyfish and manually dissect the light-emitting rings (tentacles) using scissors.
- Extraction: Homogenize the tissue in a cold, low-pH EDTA buffer. The acidic pH and absence of Ca²⁺ inhibit the luminescent reaction, preserving aequorin.
- Initial Precipitation: Subject the homogenate to ammonium sulfate precipitation. Both aequorin and GFP precipitate at specific saturation levels.
- Chromatographic Separation: Re-dissolve the precipitate and apply to a size-exclusion chromatography column. Aequorin and GFP will elute at different volumes due to their distinct molecular weights, allowing for separation.
- Verification: Test aequorin fractions by adding Ca²⁺ and observing blue luminescence. Verify GFP fractions by exposing to UV or blue light and observing green fluorescence.
Protocol 2:In VitroReconstitution of FRET
This protocol is based on the seminal work of Morise et al. (1974) [1].
- Objective: To demonstrate energy transfer from aequorin to GFP in a controlled cell-free system.
- Materials:
- Purified aequorin and GFP (from Protocol 1 or commercial sources).
- Calcium chloride (CaCl₂) solution.
- Luminometer or spectrofluorometer capable of kinetic measurements.
- Procedure:
- Sample Preparation: Prepare two solutions in identical buffers:
- Control: Purified aequorin only.
- Test: Purified aequorin mixed with purified GFP.
- Triggering Luminescence: Rapidly inject a CaCl₂ solution into both the control and test samples to activate aequorin.
- Spectral Measurement: Immediately measure the emission spectrum of the resulting light from both samples using a luminometer.
- Analysis: The control sample (aequorin only) will show a peak emission in the blue spectrum (~470 nm). The test sample (aequorin + GFP) will show a significant decrease in the ~470 nm peak and the appearance of a new, dominant peak in the green spectrum (~508 nm), confirming the occurrence of FRET.
- Sample Preparation: Prepare two solutions in identical buffers:
Quantitative Data and Spectral Properties
The functional characteristics of aequorin and GFP are defined by their specific quantitative parameters.
Table 2: Biophysical and Spectral Properties of Aequorin and GFP from A. victoria
| Parameter | Aequorin | Green Fluorescent Protein (GFP) |
|---|---|---|
| Native Function | Ca²⁺-activated blue-light-emitting photoprotein | Accepts energy from aequorin via FRET to emit green light [1] |
| Primary Emission Wavelength | ~470 nm (Blue) | ~508 nm (Green) [1] [4] |
| Key Trigger/Co-factor | Calcium ions (Ca²⁺) | Energy transfer from aequorin (light ~470 nm) [2] |
| Chromophore | Coelenterazine + molecular oxygen (substrate) | 4-(p-hydroxybenzylidene)-imidazolidin-5-one (HBI); formed by autocatalytic cyclization of Ser65-Tyr66-Gly67 [7] [8] |
| Quantum Yield | ~0.15 - 0.20 | Wild-type: ~0.70 - 0.80; Enhanced variants (e.g., EGFP) are higher [4] |
| Molecular Weight | ~21 kDa (apoprotein) | ~27 kDa [8] |
| Critical for FRET | Donor | Acceptor |
The Scientist's Toolkit: Essential Research Reagents
Research into and applications derived from the aequorin-GFP system utilize a suite of key reagents.
Table 3: Key Research Reagents for Studying the Aequorin-GFP System and its Applications
| Reagent / Material | Function / Description | Key Utility |
|---|---|---|
| Recombinant Aequorin | Purified photoprotein, often from heterologous expression in E. coli. | A highly sensitive biological calcium indicator; emits light upon binding Ca²⁺, used in intracellular calcium imaging and signaling studies [2]. |
| Recombinant GFP & Variants | Purified fluorescent proteins (e.g., wild-type GFP, EGFP, CFP, YFP). | Used as fluorescent tags for protein localization, gene expression reporters, and as the acceptor component in engineered FRET biosensors [4] [8]. |
| Aequorin-GFP Fusion Proteins | Genetically encoded constructs linking aequorin and GFP. | Serves as a model system to study and calibrate FRET efficiency due to their fixed proximity and known orientation [6]. |
| Coelenterazine | The small-molecule luciferin substrate for aequorin. | Required to reconstitute active aequorin; different analogs (e.g., native, h, cp) can modify emission intensity and kinetics [2]. |
| Calcium Buffers/Ionophores | Solutions (e.g., EGTA) and compounds (e.g., A23187) to control extracellular and intracellular Ca²⁺ levels. | Essential for calibrating aequorin-based assays and for experimentally manipulating cellular calcium to trigger the FRET system [2]. |
| Ancestral Resurrected FPs (e.g., QuetzalFP) | Computationally designed fluorescent proteins based on ancestral sequence reconstruction (ASR) [3]. | Provides highly stable and bright platforms for developing novel biosensors and for phylogenetic studies of FP evolution, offering enhanced performance in harsh environments (e.g., in polymers for Bio-HLEDs) [3]. |
The discovery of the A. victoria GFP-aequorin system provided the foundational reference point for a now-expansive field studying the phylogenetic distribution of GFP-like proteins. While GFP was once thought to be a unique oddity, numerous homologous proteins have been discovered in other cnidarians (e.g., corals), and even in distant phyla like chordates [4] [3]. The evolutionary history of these proteins is actively being unraveled. For instance, the origin of bioluminescence in Cnidaria has been estimated at 540 million years ago [3]. Modern techniques like Ancestral Sequence Reconstruction (ASR) are being used to resurrect putative ancient FPs, such as QuetzalFP, which demonstrate that ancestral proteins can exhibit remarkable stability and brightness, often surpassing their modern counterparts in certain applications [3]. This phylogenetic perspective underscores that the A. victoria system is not merely an isolated biological curiosity, but a single, highly optimized manifestation of a much broader and older protein family. Continued study of this original FRET pair and its diverse analogs is essential for understanding the evolution of biological light and for engineering the next generation of biological tools for research and medicine.
Green Fluorescent Protein (GFP) and its homologs are no longer viewed as curiosities but as critical tools in molecular biology and drug discovery. While initially discovered in the bioluminescent hydrozoan Aequorea victoria, subsequent research has revealed a vast phylogenetic expansion of GFP-like proteins, particularly within non-bioluminescent Anthozoans such as reef-building corals and sea anemones. This whitepaper provides an in-depth technical guide to the phylogenetic distribution, identification, and characterization of these proteins. We summarize current methodologies for transcriptome assembly and phylogenomic analysis, detail experimental protocols for protein characterization, and visualize key workflows and pathways. Aimed at researchers and drug development professionals, this review synthesizes current data and methodologies to facilitate the discovery and application of novel GFP-like proteins, framing these efforts within the broader context of understanding their evolutionary origins and functional diversification.
The discovery of GFP-like proteins in non-bioluminescent Anthozoa species fundamentally altered the perception of their biological function, demonstrating they are not always functionally linked to bioluminescence [9]. This finding opened a new field of research into the diversity and evolutionary history of this protein family. Anthozoans, including corals and sea anemones, possess a remarkable variety of GFP-like proteins, emitting colors across the visible spectrum, from green and yellow to red and far-red [10]. This diversity arises from a series of gene duplications and amino acid substitutions that have fine-tuned the spectral properties of these proteins.
The phylogenetic distribution of GFP-like proteins extends beyond Cnidaria. Homologs have been identified in copepods (arthropods) and cephalochordates (amphioxus), although these are quite distinct from their cnidarian counterparts [11]. The evolutionary origin of this protein family remains an active area of research. One hypothesis suggests a single evolutionary origin, with subsequent loss in many bilaterian lineages, while another posits multiple independent origins or horizontal gene transfer events [12]. The identification of non-fluorescent, GFP-like protein orthologs in ctenophores, which lack key residues for chromophore formation, suggests the ancestral protein may have had a different function [12]. Despite their broad distribution, the most spectacular radiation of GFP-like proteins has occurred in Anthozoa, making them a focal point for phylogenetic and functional studies. The resources developed for non-model anthozoan species, including transcriptomes for corals like Fungia scutaria, Montastraea cavernosa, and Seriatopora hystrix, have made it possible to identify hundreds to thousands of orthologs and clarify uncertainties in the scleractinian phylogeny [13].
Key Research Reagent Solutions
The following table details essential reagents and resources for research into Anthozoan GFP-like proteins.
Table 1: Key Research Reagents and Resources for GFP-like Protein Studies
| Reagent/Resource | Function and Application | Examples and Notes |
|---|---|---|
| Transcriptome Databases | Gene discovery and sequence retrieval for non-model organisms. | Searchable databases for anthozoan species (e.g., developed for F. scutaria, M. cavernosa, S. hystrix) [13]. |
| Host Animal rDNA Sequences | Phylogenetic reconstruction of host species to contextualize protein evolution. | 18S-28S rDNA used to build phylogenies for Porites species complexes [14]. |
| Fluorescence Microscopy Systems | In situ observation and documentation of fluorescence patterns. | Systems equipped with royal blue (440–460 nm) and green (510–540 nm) excitation lights with corresponding long-pass filters [15]. |
| Stereomicroscope with Fluorescence Adapter | Standardized imaging of fluorescent traits across multiple specimens. | Leica stereomicroscope with DMC5400 camera and SFA Fluorescence Adapter [15]. |
| Ocean Optics QE65000 Spectrometer | Acquisition of precise fluorescence emission spectra. | Used with a bifurcated fiber optics cable for spectral analysis of fluorescence [15]. |
| Phylogenetic Analysis Software | Inferring evolutionary relationships among GFP-like protein sequences. | Software for phylogenetic inference using orthologous sequences identified from transcriptomes [13]. |
Methodologies for Phylogenomic Analysis and Identification
Transcriptome Sequencing and Assembly
Identifying novel GFP-like proteins begins with generating comprehensive genetic resources for the target organisms.
- Sample Collection and RNA Extraction: Collect fresh tissue samples from the target anthozoan species, ensuring representation of different life stages, symbiotic states, or environmental conditions. Immediately preserve tissue in RNAlater Stabilization Solution. Extract total RNA using kits such as the RNeasy Mini Kit, which is effective for corals like Seriatopora hystrix and Fungia scutaria larvae [13].
- cDNA Library Preparation and Sequencing: Use high-throughput sequencing platforms (e.g., Illumina HiSeq) to generate deep transcriptome data. The preparation of cDNA libraries and sequencing to produce ~20–30 million reads per sample provides sufficient coverage for robust de novo assembly [13].
- De Novo Transcriptome Assembly: Assemble the sequenced reads de novo using appropriate software. This process typically produces ~75,000–110,000 transcripts per sample. Assess assembly quality using metrics like mean transcript length (~1.4 kb) and N50 value (~2 kb), which should be comparable to the distribution of gene models from a sequenced coral genome like Acropora digitifera [13]. A successful assembly should include matches for more than half of the gene models from a reference genome and contain many reasonably complete transcripts.
Identifying Orthologs and Phylogenetic Inference
Once a transcriptome is assembled, the next step is to identify GFP-like proteins and their evolutionary relationships.
- Ortholog Identification: Recover sequences for genes of interest from the assembled transcriptomes using searchable databases. Identify orthologous sequences across species by searching for GFP-like protein domains. This allows for the construction of datasets comprising hundreds to thousands of orthologs from diverse scleractinian species and related taxa [13].
- Phylogenetic Tree Construction: Perform phylogenetic inference using the identified orthologous sequences. Employ maximum likelihood or Bayesian methods to reconstruct relationships. This approach has been shown to recover known phylogenetic relationships and demonstrate superior performance over trees constructed using single mitochondrial loci, thus clarifying substantial uncertainties in the existing scleractinian phylogeny [13].
The following diagram illustrates the core workflow for the phylogenetic identification of GFP-like proteins.
Experimental Protocols for Functional Characterization
Fluorescence Imaging and Pattern Analysis
Characterizing the phenotypic expression of GFP-like proteins is crucial for hypothesizing their function.
- In Situ Fluorescence Photography: In the field or laboratory, use a camera equipped with a macro lens, a yellow barrier filter (e.g., #12 Screw-In Filter), and blue excitation light sources (e.g., SOLA Nightsea Light) to photograph fluorescence in living specimens [15]. Adjust white balance across various depths when capturing images under natural lighting conditions to accurately represent colors.
- Standardized Laboratory Imaging: For a trait-based analysis, image fixed specimens 1–10 days post-fixation in ethanol to prevent interference from algal chlorophyll fluorescence. Use a stereomicroscope (e.g., Leica 205A) equipped with a fluorescence adapter and a high-resolution camera. Take images in brightfield and under fluorescence using royal blue and green excitation lights with corresponding long-pass filters. Keep exposure time, gain, and excitation intensity consistent across specimens to maximize the dynamic range and allow for comparisons [15].
- Fluorescent Trait Analysis: Based on the fluorescent images, record the presence or absence of fluorescence for defined body parts. To quantify the expression, use image analysis software like ImageJ. Outline the relevant body parts (e.g., dorsal carapace, antennular peduncle) to measure the total area. Subsequently, apply the threshold function to determine the fluorescent area within that region. Calculate the proportion of fluorescent area by dividing the fluorescent area by the total area [15]. This multivariate approach allows for the identification of distinct fluorescent morphologies (fluotypes).
Spectrometric Characterization
Determining the spectral properties of the fluorescent proteins is essential for their classification and potential application.
- Equipment Setup: Use a fluorescence spectrometer (e.g., Ocean Optics QE65000) with a bifurcated fiber optics cable. Excitation light can be generated using lasers of specific wavelengths (e.g., a green laser for red fluorescence excitation) [15].
- Measurement Protocol: Position the fiber optic probe to excite the sample and collect the emitted light. For a full spectral analysis, measure the emission spectrum across a range of wavelengths. Compare the obtained spectra to known standards to characterize the fluorescent protein's emission profile [11]. This is critical for distinguishing between different types of GFP-like proteins, such as GFPs, RFPs, and CFPs.
Table 2: Quantitative Metrics from De Novo Transcriptome Assemblies in Anthozoa [13]
| Species | Number of Sequence Reads | Number of Assembled Transcripts | Mean Transcript Length | N50 | A. digitifera Gene Models Matched |
|---|---|---|---|---|---|
| Fungia scutaria | ~20-30 million | ~75,000-110,000 | ~1.4 kb | ~2.0 kb | 54-67% |
| Montastraea cavernosa | ~20-30 million | ~75,000-110,000 | ~1.4 kb | ~2.0 kb | 54-67% |
| Seriatopora hystrix | ~20-30 million | ~75,000-110,000 | ~1.4 kb | ~2.0 kb | 54-67% |
| Anthopleura elegantissima | ~20-30 million | ~75,000-110,000 | ~1.4 kb | ~2.0 kb | 54-67% |
Diverse Functions and Ecological Significance
GFP-like proteins in Anthozoa are not merely structural curiosities; they serve a range of proposed functional roles that contribute to the fitness of the holobiont. The diagram below summarizes how these functions interact with environmental factors.
The functional roles are supported by specific evidence:
- Photoprotection: In shallow waters with high light intensity, GFP-like proteins can act as a sunscreen by absorbing high-energy photons and dissipating them as harmless fluorescent light or heat, thereby protecting the symbiotic dinoflagellates (Symbiodiniaceae) from photoinhibition [14].
- Prey Attraction: The "light trap" hypothesis proposes that in mesophotic (low-light) environments, GFP conversion of blue light to green fluorescence can lure planktonic prey, increasing the host's heterotrophic capacity [14] [15].
- Symbiosis Modulation: Red fluorescent proteins (RFPs) may play a role in attracting specific strains of Symbiodiniaceae to the host cnidarian, facilitating the establishment of symbiosis [14]. Furthermore, GFP-like proteins may fine-tune the internal light environment to optimize photosynthesis by the symbionts [15].
- Antioxidant Activity: Both GFPs and RFPs have demonstrated the ability to scavenge reactive oxygen species (ROS), such as hydrogen peroxide (H₂O₂) and superoxide radicals, which are particularly generated during thermal stress and can lead to coral bleaching [14].
- Visual Signaling: The targeted expression of fluorescent proteins in specific anatomical regions (e.g., tentacle tips, oral discs) may provide visual cues for conspecific communication or other interspecific interactions [14].
Notably, the expression and distribution of these proteins are dynamic. Under thermal stress, fluorescence patterns can reorganize, with proteins spreading uniformly across the tissue, suggesting their potential use as a non-invasive biomarker for assessing coral health [14].
Applications in Drug Discovery and Biomedical Research
The unique properties of Anthozoa-derived fluorescent proteins have made them indispensable tools in biomedical research and drug discovery, extending their utility far beyond their native ecological roles.
- Multi-Color Imaging and Cell Labeling: Anthozoa proteins are available in colors and properties unlike those of A. victoria GFP variants, providing a powerful palette for multiplexed imaging. Proteins such as the monomeric red and dimeric far-red fluorescent proteins enable simultaneous tracking of multiple molecular targets or cellular processes [10].
- Biosensors and FRET Applications: GFP-like proteins can be engineered into biosensors to detect changes in cellular conditions, such as pH, calcium levels, and enzyme activity. Furthermore, they are central to Fluorescence Resonance Energy Transfer (FRET) assays, which are used to study protein-protein interactions, receptor dimerization, and oligomerization in live cells [16].
- High-Throughput Screening (HTS): The stability and detectability of these proteins allow for the development of genetically engineered cell lines with GFP expression under the control of specific promoters. These cells are valuable for automated analysis and can be adapted for HTS systems to identify new chemical entities that modulate receptor activity or other therapeutic targets [16].
- Lineage Tracing and In Vivo Imaging: Fluorescent proteins from Anthozoa have been used to create "rainbow" mice, where different cell types express distinct colors, allowing for the fate mapping of stem cells and the study of development and disease progression in real-time [16]. Their use as nontoxic, genetically encodable markers avoids staining procedures and hazardous radiolabeled binding assays.
The phylogenetic expansion of GFP-like proteins in non-bioluminescent Anthozoa represents a remarkable example of molecular evolution and functional diversification. Through the application of transcriptomics, phylogenomics, and detailed phenotypic characterization, researchers can systematically identify and characterize novel proteins within this family. The resulting diverse palette of fluorophores has not only advanced our understanding of coral biology and resilience but has also provided the biomedical research community with an array of powerful tools. As sequencing technologies and functional genomic techniques continue to advance, the discovery of new GFP-like proteins with novel properties is poised to continue, further illuminating the evolutionary history of this protein family and unlocking new applications in drug discovery and cellular imaging.
Proteins homologous to the Green Fluorescent Protein (GFP) from the jellyfish Aequorea victoria constitute a diverse family responsible for the spectacular colors observed in reef-building corals and other anthozoans [17] [18]. These GFP-like proteins are major color determinants in reef Anthozoa, accounting for practically every visible coral color other than the brown pigmentation of photosynthetic symbionts [18]. Unlike the bioluminescent function of GFP in jellyfish, where it converts blue light emitted by aequorin to green light, GFP-like proteins in non-bioluminescent Anthozoa are thought to serve ecological functions including photoprotection, prey capture, and optimization of the light environment for symbiotic algae [14] [19] [20].
The family exhibits remarkable diversity, with proteins emitting colors across the visible spectrum and including both fluorescent and non-fluorescent members [17] [18]. This diversity arises from variations in the chromophore structure and its protein environment, which are products of autocatalytic reactions within the protein sequence itself [17]. The phylogenetic distribution and evolution of these proteins across Zoantharia and other coral groups provide insights into both molecular evolutionary processes and the ecological adaptations of reef-building organisms.
Classification and Phylogenetic Distribution
Major Color Classes and Chromophore Types
GFP-like proteins from Anthozoa are classified into several distinct color classes based on their spectral properties. The table below summarizes the fundamental classification of these proteins.
Table 1: Major Color Classes of Anthozoan GFP-like Proteins
| Color Class | Spectral Characteristics | Chromophore Type | Representative Examples |
|---|---|---|---|
| Cyan (CFP) | Excitation: 440-460 nm; Emission: 485-495 nm | GFP-type | scubGFP1, scubGFP2 [17] |
| Green (GFP) | Excitation peaks: ~395 nm, ~475 nm; Emission: ~510 nm | GFP-type | cgigGFP, hcriGFP [17] |
| Yellow (YFP) | Emission between green and red | Variants of GFP-type | zoanYFP [21] |
| Red (RFP) | Excitation: 550-580 nm; Emission: 580-610 nm | DsRed-type or Kaede-type | DsRed, mcavRFP [17] [22] |
| Chromoprotein (CP) | Non-fluorescent, strong absorption | Isomerized DsRed-type | Various purple-blue proteins [18] |
The chromophore diversity underpins this color variation. While cyan and green fluorescent proteins share the same chromophore structure, red fluorescent proteins and chromoproteins feature extended chromophore structures with additional conjugation achieved through different autocatalytic pathways [18]. The Kaede-type red fluorescent proteins, characteristic of corals in the Faviina suborder, exhibit a distinctive narrow orange-red fluorescence with a characteristic shoulder at 630 nm in the emission spectrum, unlike the broader emission of DsRed-type proteins [22] [18].
Phylogenetic Distribution Across Coral Taxa
Molecular phylogenetic analyses reveal that GFP-like proteins from Zoantharia and other corals fall into multiple evolutionary clades, with complex relationships between protein color and taxonomic origin.
Table 2: Phylogenetic Distribution of GFP-like Proteins in Coral Taxa
| Coral Group | GFP-like Protein Lineages | Color Diversity | Evolutionary Notes |
|---|---|---|---|
| Zoantharia | At least four distinct clades [17] | Multiple colors per clade | Recent color conversion events; balancing selection [17] [23] |
| Scleractinia (reef-building corals) | Three major paralogous lineages [18] | Full color complement (cyan, green, red, purple-blue) | One lineage retained in all families; others underwent sorting between groups [18] |
| Faviina | Specialized Kaede-type red proteins [22] | Green ancestral, red derived | ~12 mutations required for green-to-red transition with epistatic interactions [22] |
| Porites species | Multiple fluorescence patterns [14] | Green and red fluorescence | Pattern variation within single lineages; thermal stress response [14] |
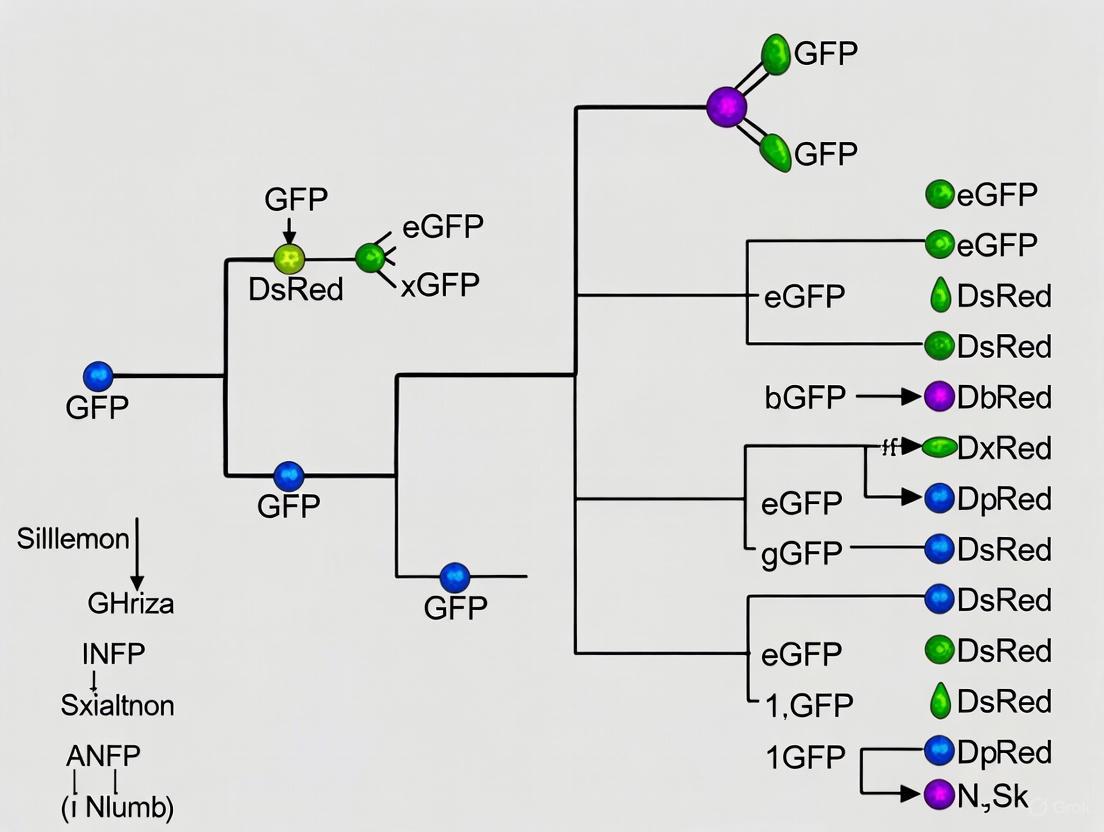
The phylogenetic distribution demonstrates that each major coral group possesses multiple GFP-like protein lineages, and that similar colors have evolved independently in different taxonomic groups through convergent or parallel evolution [17] [18]. Proteins of different colors within the same clade indicate that color conversion has occurred multiple times throughout evolutionary history [17]. The common ancestor of all coral fluorescent proteins has been reconstructed as a green fluorescent protein, suggesting that the extensive color diversity observed today originated from this ancestral state [18].
Figure 1: Evolutionary pathways of GFP-like proteins from an ancestral green state to diverse color classes through different molecular mechanisms. The diagram shows the multiple independent origins of similar colors across different coral taxa.
Experimental Characterization Methodologies
Protein Identification and Cloning
The standard methodology for identifying and characterizing novel GFP-like proteins involves a multi-step process combining molecular biology and spectroscopic techniques [17]. The following workflow outlines the key experimental stages:
Figure 2: Standard experimental workflow for identification and characterization of novel GFP-like proteins from coral samples, combining molecular and spectroscopic approaches.
Sample Collection and Preparation: Coral tissue samples (100-500 mg) are collected, typically during night dives to minimize solar radiation effects [17]. Candidate specimens may be pre-screened using UV flashlights to identify fluorescent phenotypes [17].
Molecular Cloning: Total RNA is isolated from tissue samples and reverse-transcribed to cDNA [17]. Degenerate primers targeting conserved regions of GFP-like proteins are used to amplify coding sequences, which are then cloned into expression vectors such as pGEM-T for transformation into E. coli hosts [17] [22].
Screening and Expression: Transformed bacterial colonies are screened for fluorescence using fluorescence microscopy [17]. Selected colonies are harvested, and proteins are expressed for spectral characterization. For some red fluorescent proteins with "timer" phenotypes (e.g., zoan2RFP, mcavRFP), maturation requires extended incubation periods or specific light exposure [17] [22].
Evolutionary Analysis Using Ancestral Protein Reconstruction
To understand the evolutionary transitions between color classes, researchers have employed ancestral protein reconstruction to resurrect and characterize putative ancestral GFP-like proteins [22] [18]. This approach is particularly valuable for identifying mutations responsible for functional changes that may be obscured in extant proteins due to subsequent specialization.
The methodology involves:
- Sequence Alignment and Phylogeny: Comprehensive multiple sequence alignment of GFP-like proteins from diverse coral taxa [17] [18].
- Ancestral Sequence Reconstruction: Probabilistic methods to infer the most likely sequences of ancestral nodes in the phylogeny [22] [18].
- Combinatorial Library Synthesis: Creating libraries of genes representing possible evolutionary intermediates between ancestral and extant proteins [22].
- Functional Screening: Expressing these libraries in bacterial systems and screening for spectral phenotypes [22].
This approach was successfully applied to study the evolution of Kaede-like red fluorescent proteins in the Faviina suborder, revealing that approximately 12 mutations were required for the transition from green to red fluorescence, with significant epistatic interactions between sites [22].
Functional Assays for Ecological Roles
To determine the ecological functions of GFP-like proteins, researchers have developed experimental protocols to test specific hypotheses:
Photoprotection Assays: Corals with different fluorescent protein expression levels are exposed to varying light conditions, particularly blue light matching the absorption spectra of their pigments [23]. Measurements of photodamage (e.g., photosystem II efficiency in symbiotic algae), oxidative stress markers, and coral growth rates quantify photoprotective effects [23].
Thermal Stress Response: Fluorescence patterns are monitored during controlled thermal stress experiments to assess potential roles as stress biomarkers [14]. The redistribution of fluorescence to uniform patterning under thermal stress suggests fluorescent proteins may provide non-invasive indicators of coral health [14].
Symbolnt Performance Metrics: The relationship between fluorescent protein expression and photosynthetic efficiency of symbiotic algae is assessed using pulse-amplitude modulation (PAM) fluorometry to measure quantum yield of photosystem II under different light conditions [23].
The Scientist's Toolkit: Essential Research Reagents
Table 3: Essential Research Reagents for GFP-like Protein Studies
| Reagent/Category | Specific Examples | Function/Application | References |
|---|---|---|---|
| Expression Vectors | pGEM-T vector | Cloning and initial expression in E. coli | [17] [22] |
| Bacterial Host Strains | E. coli JM109, Top10 | Heterologous protein expression | [17] [22] |
| Fluorescence Microscopy Systems | Leica MZ FL III with filter sets | Colony screening and phenotypic analysis | [22] |
| Spectrofluorometers | LS-50B (Perkin-Elmer) | Spectral characterization of fluorescent proteins | [17] |
| cDNA Synthesis Kits | SMART cDNA amplification kit | cDNA library construction from coral RNA | [17] |
| Specialized Filter Sets | Double-bandpass filters (e.g., Chroma #51004v2) | Simultaneous visualization of multiple fluorophores | [22] |
| Photoactivation Equipment | UV-A light sources ("blacklight") | Inducing chromophore maturation in Kaede-type proteins | [22] |
The classification of GFP-like proteins from Zoantharia and other corals reveals a complex evolutionary history characterized by multiple parallel evolution of color diversity, frequent color conversion events, and lineage-specific diversification [17] [18]. The phylogenetic distribution patterns demonstrate that similar colors have arisen independently in different taxonomic groups, suggesting strong ecological pressures shaping the evolution of these proteins [17] [23].
Future research directions include more comprehensive sampling across coral taxa, functional characterization of the ecological roles of different color morphs in natural environments, and exploitation of the diverse molecular properties of these proteins for biotechnology applications [14] [24]. The experimental methodologies outlined here provide a framework for systematic analysis of GFP-like protein diversity, evolution, and function, contributing to both basic scientific knowledge and applied biotechnological development.
The discovery and subsequent development of fluorescent proteins (FPs) have revolutionized biological imaging, providing researchers with a versatile genetic toolkit for visualizing dynamic processes within living cells and organisms. This family of proteins, homologues of the original Green Fluorescent Protein (GFP) from the jellyfish Aequorea victoria, spans virtually the entire visible spectrum through natural diversity and protein engineering [25] [26]. The phylogenetic distribution of GFP-like proteins extends beyond cnidarians to include copepods and cephalochordates (amphioxus), suggesting multiple evolutionary paths including potential horizontal gene transfer events or inheritance from a common bilaterian ancestor [11]. The structural basis for this remarkable spectroscopic diversity lies in a conserved β-can fold that protects an autocatalytically formed chromophore, with spectral tuning achieved through transformations including posttranslational modifications, chromophore isomerization, and rearrangements of the surrounding amino acid environment [27].
Understanding the relationship between protein structure and spectral properties has been fundamental to expanding the FP palette. The physical extent of π-orbital conjugation within the chromophore largely determines the general spectral class, while local environmental variables such as charged residue positioning, hydrogen bonding networks, and hydrophobic interactions can produce spectral shifts of up to 20 nm in absorption and emission maxima [26]. This review examines the natural diversity of fluorescent proteins across phylogenetic lineages, their structural determinants of fluorescence, and their emerging applications as biomarkers for environmental stress and biological activity.
Structural Basis of Spectral Diversity in GFP-like Proteins
The Conserved β-Barrel Architecture and Chromophore Formation
All GFP-like proteins share a highly conserved structural motif: an 11-stranded β-barrel surrounding a central α-helix that contains the chromophore-forming tripeptide [28] [29]. This robust structure, approximately 25Å in diameter and 40Å tall, serves as a protective scaffold that isolates the chromophore from the external environment, enabling fluorescence by restraining the chromophore and preventing nonradiative decay pathways [28]. The β-barrel fold is so unique that GFP forms its own protein class with no other known proteins sharing this structure [11].
The fluorescence originates from a mature chromophore formed through autocatalytic cyclization of a tripeptide sequence (Ser65-Tyr66-Gly67 in A. victoria GFP) [29]. This maturation process involves a series of aerobic biochemical steps: folding, cyclization, oxidation, and dehydration, resulting in the formation of 4-hydroxybenzylidene-imidazolinone (HBI) [29]. The process begins with nucleophilic attack by the amide nitrogen of Gly67 on the carbonyl carbon of Ser65, forming an imidazolin-5-one heterocyclic ring. Oxidation by molecular oxygen then extends electron conjugation of the imidazoline ring system to include the aromatic substituent, creating a conjugated π-system that can absorb and emit visible light [26]. Remarkably, this entire process occurs without enzymatic assistance, relying only on molecular oxygen [29].
Molecular Mechanisms of Spectral Tuning
The spectral diversity of GFP-like proteins arises from modifications to the chromophore structure and its chemical environment within the protective β-barrel. Four primary mechanisms govern spectral tuning across the FP palette:
Chromophore Chemical Identity: Substitutions at the tyrosine residue (position 66 in A. victoria GFP) alter the fundamental electronic properties of the chromophore. The Y66H mutation produces Blue Fluorescent Proteins (BFP) with excitation at ~380 nm and emission at 448 nm, while the Y66W mutation creates Cyan Fluorescent Proteins (CFP) with excitation at ~436 nm and emission at 485 nm [26].
π-Orbital Conjugation Extent: The physical extent of π-orbital conjugation within the chromophore largely determines the general spectral class. Extended conjugation systems, such as those found in red fluorescent proteins, result in longer wavelength absorption and emission [26].
Chromophore Isomerization and Planarity: The chromophore can exist in different isomeric forms (cis vs. trans) with varying degrees of planarity. In GFP, the chromophore is cis and approximately planar, while other FPs like eqFP611 contain the trans isomer [28]. The degree of planarity enforced by the surrounding protein matrix affects the energy gap between ground and excited states, thereby influencing emission wavelength.
Environmental Perturbations: Charged amino acid residues, hydrogen bonding networks, and hydrophobic interactions in the chromophore vicinity can produce spectral shifts up to 20 nm [26]. For example, in Yellow Fluorescent Proteins (YFP), the T203Y mutation creates π-electron stacking interactions between the substituted tyrosine and the chromophore, resulting in red-shifted excitation and emission [25].
Table 1: Fundamental Chromophore Variants and Their Spectral Properties
| Chromophore Type | Amino Acid Substitutions | Excitation Max (nm) | Emission Max (nm) | Structural Features |
|---|---|---|---|---|
| GFP (Green) | None (wild-type) | 395 (major), 475 (minor) | 509 | Ser65-Tyr66-Gly66, neutral and anionic states |
| BFP (Blue) | Y66H | ~380 | ~448 | Histidine at position 66 |
| CFP (Cyan) | Y66W | ~436 | ~485 | Tryptophan at position 66 |
| YFP (Yellow) | T203Y | ~514 | ~527 | π-stacking with chromophore |
| RFP (Red) | Various | ~558 | ~583 | Extended conjugation, acylimine |
The chromophore can exist in different protonation states, leading to complex photophysical behavior. In wild-type GFP, the chromophore exhibits two excitation maxima at approximately 395 nm (neutral form) and 475 nm (anionic form), with both states emitting green fluorescence around 509 nm [29]. The mechanism for green emission upon ultraviolet excitation involves excited-state proton transfer (ESPT), where the excited protonated chromophore (A) transfers a proton to form an anionic excited state (I) that emits a green photon [28]. This intricate photocycle involves multiple excited-state intermediates and ground states, demonstrating the dynamic nature of FP chromophores [28].
Phylogenetic Distribution and Natural Diversity of Fluorescent Proteins
Evolutionary Origins Across Distant Taxa
GFP-like proteins display a remarkably patchy phylogenetic distribution across distantly related organisms. The initial discovery of GFP in the cnidarian Aequorea victoria has been followed by identifications in other cnidarians (corals and sea anemones), copepods, and cephalochordates (amphioxus) [11]. This sporadic distribution across deep evolutionary lineages presents a conundrum regarding the evolutionary history of GFP-like proteins—whether they were inherited from a common ancestor or acquired through horizontal gene transfer events.
Research on cephalochordates provides particular insight into this question. Studies of Asymmetron lucayanum, an early-diverged cephalochordate lineage, revealed two GFP-encoding genes closely related to those in the genus Branchiostoma, indicating that GFP genes were likely present in ancestral cephalochordates rather than recently acquired through horizontal transfer [11]. Fluorescence in A. lucayanum appears diffusely throughout the body with particular intensity in ripe ovaries, exhibiting an emission peak at 525 nm when excited at 470 nm [11]. The genus Branchiostoma has undergone lineage-specific expansion of GFP-encoding genes, largely driven by tandem duplications, with strong purifying selection shaping their evolution [11].
Functional Diversity in Natural Environments
In marine organisms, GFP-like proteins serve diverse ecological functions that extend beyond mere coloration. In reef-building corals, FPs serve functional roles including photoprotection, prey capture, and algal symbiont attraction [14]. The specific distribution patterns of FPs within coral colonies—such as highlighted (concentrated in oral regions or tentacles), uniform, or complementary (non-overlapping GFP and RFP patterns)—suggest specialized functional adaptations [14].
The functional versatility of GFP-like proteins is particularly evident in corals of the genus Porites. Studies of Porites cf. lutea and Porites cf. lobata from the Great Barrier Reef identified six distinct fluorescence patterns: star, uniform, absent, tentacles, oral region, and tentacle tips [14]. These patterns are shared by all polyps in a colony and can reorganize under thermal stress, suggesting FPs may provide biomarkers of environmental stress [14]. The reorganization of both green and red fluorescence to uniform patterning during thermal stress indicates these proteins may play adaptive roles in stress response, possibly through antioxidant functions [14].
Table 2: Natural Fluorescent Protein Distribution and Proposed Functions
| Organism Group | Representative Species | FP Colors | Proposed Natural Functions |
|---|---|---|---|
| Cnidarians | Aequorea victoria (jellyfish) | Green | Energy transfer from aequorin [25] |
| Cnidarians | Porites corals (GBR) | Green, Red | Photoprotection, prey capture, symbiont attraction, stress response [14] |
| Cephalochordates | Branchiostoma floridae (amphioxus) | Green | Unknown, potentially photoprotection [11] |
| Cephalochordates | Asymmetron lucayanum (amphioxus) | Green | Unknown, intense in ovaries [11] |
| Anthozoans | Discosoma striata (sea anemone) | Red | Unknown, ecological interactions [26] |
The Expanded Fluorescent Protein Color Palette
Engineering the Blue to Yellow Spectrum
Protein engineering of A. victoria GFP has generated a suite of blue to yellow fluorescent variants through systematic mutagenesis. The first major improvement was the S65T mutation, which dramatically improved spectral characteristics by increasing fluorescence, photostability, and shifting the major excitation peak to 488 nm while keeping emission at 509 nm [25]. This mutation matched the spectral characteristics of commonly available FITC filter sets, greatly enhancing practical utility [25]. Additional folding improvements at 37°C (F64L mutation) created Enhanced GFP (EGFP), enabling practical use in mammalian cells [30].
Further engineering efforts produced:
- Blue Fluorescent Proteins (BFP): Created through the Y66H substitution, resulting in excitation at ~380 nm and emission at 448 nm [26]. Despite additional mutations to improve folding and expression, BFP variants remain limited by low quantum yields, rapid photobleaching, and the need for ultraviolet excitation, which is phototoxic to cells and hampered by cellular autofluorescence [26].
- Cyan Fluorescent Proteins (CFP): Derived from the Y66W mutation, yielding excitation at ~436 nm and emission at 485 nm [26]. Enhanced variants like Cerulean feature higher extinction coefficients, improved quantum yields, and single-exponential fluorescence lifetime decay, making them particularly useful for FRET experiments and lifetime imaging [26].
- Yellow Fluorescent Proteins (YFP): Generated through the T203Y mutation, which creates π-stacking interactions that red-shift excitation to ~514 nm and emission to ~527 nm [26]. Further refinements produced variants like Venus and Citrine with improved folding and pH stability [26].
Red and Far-Red Fluorescent Proteins from Anthozoans
The discovery of DsRed from the sea anemone Discosoma striata opened the spectral range to longer wavelengths, providing essential tools for multicolor imaging and biological applications where reduced autofluorescence and deeper tissue penetration are advantageous [26]. The DsRed chromophore forms through an additional oxidation step that extends the conjugation system, creating a planar cis configuration that absorbs at ~558 nm and emits at ~583 nm [26].
Unlike A. victoria GFP variants, which predominantly form weak dimers, early DsRed variants formed obligate tetramers, limiting their utility as fusion tags. Extensive engineering produced monomeric red fluorescent proteins (mFruit series) including mCherry, mStrawberry, and mPlum, which exhibit progressively longer emission wavelengths while maintaining monomeric character [26]. Structural studies of Anthozoan FPs reveal at least three distinct chromophore motifs: planar cis (found in DsRed), planar trans (characteristic of eqFP611), and non-planar trans (found in the non-fluorescent chromoprotein Rtms5) [26].
Table 3: Engineered Fluorescent Protein Variants and Spectral Characteristics
| Protein | Excitation Max (nm) | Emission Max (nm) | Extinction Coefficient (M⁻¹cm⁻¹) | Quantum Yield | Brightness (Relative to EGFP) | Oligomeric State |
|---|---|---|---|---|---|---|
| EBFP | 380 | 448 | 29,000 | 0.31 | ~25% | Weak dimer |
| ECFP | 434 | 477 | 32,500 | 0.40 | ~40% | Weak dimer |
| Cerulean | 433 | 475 | 43,000 | 0.62 | ~79% | Monomeric |
| EGFP | 488 | 507 | 55,000 | 0.60 | 100% | Weak dimer |
| EYFP | 514 | 527 | 83,400 | 0.61 | ~151% | Weak dimer |
| Venus | 515 | 528 | 92,200 | 0.57 | ~158% | Monomeric |
| mCherry | 587 | 610 | 72,000 | 0.22 | ~47% | Monomeric |
Experimental Methodologies for FP Characterization
Spectral Measurement Techniques
Comprehensive characterization of fluorescent proteins requires multiple spectroscopic approaches to fully understand their photophysical properties. Key methodologies include:
One-Photon Excitation Spectroscopy: Conventional measurement of absorption and emission spectra using ultraviolet-visible spectrophotometry and fluorometry. This technique identifies major excitation peaks and corresponding emission maxima, providing fundamental characterization of FP spectral properties [31].
Two-Photon Excitation Spectroscopy: This technique involves simultaneous absorption of two longer-wavelength photons (typically in the near-infrared range) to excite the fluorophore. Studies of ECFP, EGFP, and EYFP have demonstrated that two-photon excitation spectra are more differentiated than their one-photon counterparts, exhibiting more pronounced main and local maxima between 820-1150 nm excitation [31]. Two-photon and one-photon emission spectra are identical, indicating both excitation routes lead to the same excited states [31].
Fluorescence Lifetime Imaging Microscopy (FLIM): Measures the exponential decay rate of fluorescence emission after pulsed excitation, providing information about the fluorophore microenvironment that is independent of concentration. Cerulean exhibits a single-exponential lifetime decay, making it particularly valuable for FRET investigations and lifetime-based sensing [26].
Crystallographic Studies: X-ray diffraction of FP crystals reveals atomic-level details of chromophore conformation and interactions with surrounding amino acids. The first GFP crystal structures provided vital insights into chromophore formation and neighboring residue interactions, enabling rational engineering of improved variants [25].
Coral Fluorescence Pattern Analysis Methodology
Research on fluorescence patterns in corals employs specific methodological approaches:
Coral Collection and Maintenance: Studies typically involve collection of coral colonies from natural reef environments (e.g., Davies Reef in the Great Barrier Reef for Porites species) with maintenance in controlled aquarium systems [14].
Excitation and Emission Imaging: Coral colonies are examined under blue (~470 nm) and green excitation light using specialized imaging systems with appropriate emission filters to detect green and red fluorescence patterns [14].
Phylogenetic Analysis: Host animal phylogeny is constructed using molecular markers such as 18S-28S rDNA sequences to correlate fluorescence patterns with genetic lineages [14].
Stress Response Monitoring: Experimental thermal stress exposure with subsequent fluorescence monitoring to assess FP reorganization under controlled conditions [14].
The Scientist's Toolkit: Essential Research Reagents and Materials
Table 4: Essential Research Reagents for Fluorescent Protein Studies
| Reagent/Material | Function/Application | Example Specifications |
|---|---|---|
| EGFP (Enhanced GFP) | Standard green fluorescent reference protein | Ex/Em: 488/507 nm, ε: 55,000 M⁻¹cm⁻¹, QY: 0.60 [30] |
| Cerulean | Optimized cyan variant for FRET studies | Ex/Em: 433/475 nm, bright variant with single-exponential decay [26] |
| mCherry | Monomeric red fluorescent protein | Ex/Em: 587/610 nm, monomeric, photostable [26] |
| Two-Photon Microscopy System | Deep tissue imaging and spectral characterization | Tunable IR laser (820-1150 nm), high-sensitivity detectors [31] |
| FRET Filter Sets | Biosensor development and protein interaction studies | CFP excitation: 430-450 nm, YFP emission: 525-550 nm [26] |
| Spectrofluorometer | Precise spectral measurements | Dual monochromators, temperature control, polarization capability |
| Protein Purification System | Recombinant FP isolation and purification | Affinity chromatography (His-tag), size exclusion columns |
Emerging Applications and Future Perspectives
Environmental Stress Biomarkers
The reorganization of fluorescence patterns in corals under thermal stress suggests FPs may serve as non-invasive biomarkers for reef health assessment. Studies of Porites corals demonstrate that both green and red fluorescence redistribute to uniform patterning during thermal stress, providing a potential early warning system for coral bleaching events [14]. This fluorescence screening approach offers advantages of being non-invasive and potentially deployable for large-scale reef monitoring.
Advanced Biosensor Development
The expanding FP palette enables engineering of sophisticated biosensors for monitoring cellular processes:
- FRET-Based Biosensors: Pairs like ECFP-EYFP and Cerulean-Venus enable detection of protease activity, calcium signaling, and protein-protein interactions through changes in FRET efficiency [26].
- Redox Sensors: Redox-sensitive GFPs (roGFP) with introduced cysteine residues respond to changing cellular redox states through alterations in fluorescent properties [25].
- pH Sensors: pH-sensitive mutants (pHluorins) exploit the rapid pH change upon synaptic vesicle fusion to visualize neuronal activity [25].
Future Research Directions
The future of fluorescent protein research includes several promising directions:
- Near-Infrared FPs: Engineering FPs with emission in the near-infrared range for improved tissue penetration and reduced autofluorescence in mammalian imaging.
- Improved Photostability: Developing variants resistant to photobleaching for long-term time-lapse studies.
- Advanced Chromophore Chemistry: Exploring non-natural amino acids and novel chromophore structures to expand spectral range and functionality.
- Computational Design: Using molecular dynamics and machine learning to predict and design FPs with desired properties before experimental testing.
The continuing expansion of the fluorescent protein palette, coupled with deeper understanding of phylogenetic distribution and structure-function relationships, ensures these remarkable molecular tools will remain indispensable for biological discovery and innovation.
The remarkable diversity of colors within the Green Fluorescent Protein (GFP) family serves as a powerful model system for studying molecular evolution. This whitepaper examines the evolutionary forces driving color conversion in GFP-like proteins, with a specific focus on the balance between mutation pressure and natural selection. Framed within the context of the phylogenetic distribution of GFP analogs, we synthesize evidence from cnidarians and cephalochordates to elucidate the mechanisms behind spectral diversification. The discussion is supported by quantitative spectral data, detailed experimental methodologies for characterizing new GFP variants, and bioinformatics approaches for phylogenetic analysis. This resource provides life science researchers and drug development professionals with a technical guide to the evolutionary principles governing functional protein diversity.
Green Fluorescent Protein (GFP) and its homologs constitute a protein family with a unique, evolutionarily conserved β-can structure that enables autocatalytic chromophore formation [25]. While originally discovered in the cnidarian Aequorea victoria, GFP-like proteins have since been identified in diverse organisms including corals, sea anemones, copepods, and cephalochordates [32] [25]. This sporadic phylogenetic distribution across distantly related taxa has prompted ongoing investigation into the evolutionary origins of these proteins, with hypotheses ranging from repeated horizontal gene transfer events to inheritance from a common bilaterian ancestor [32].
The family exhibits striking functional diversity, encompassing proteins that fluoresce across the visible spectrum (cyan to red) as well as non-fluorescent chromoproteins that absorb visible light [33] [17]. In reef-building corals, GFP-like proteins are considered major determinants of coloration, potentially fulfilling roles in photoprotection, photoreception, and antioxidant activity [34]. The evolution of this color diversity presents a compelling evolutionary puzzle: how do proteins with highly similar structures acquire distinct spectral properties, and what selective forces maintain this diversity?
Evolutionary Mechanisms of Color Conversion
The Interplay of Mutation Pressure and Natural Selection
Research on GFP-like proteins from reef Anthozoa provides direct insight into the evolutionary mechanisms driving color diversification. Phylogenetic analysis of these proteins reveals that they fall into several distinct clades, with each clade containing proteins of more than one emission color [33] [17]. This topological pattern suggests multiple independent events of color conversion throughout evolutionary history rather than a simple linear progression of color changes.
The current evolutionary model proposes that the phylogenetic pattern and color diversity in reef Anthozoa results from a balance between selection for GFP-like proteins of particular colors and mutation pressure driving the color conversions [33] [17]. In this framework:
- Natural selection acts to preserve colors that provide adaptive advantages in specific ecological contexts, such as photoprotection in high-light environments or camouflage against predators.
- Mutation pressure continuously introduces genetic variations that can alter chromophore environment and chemistry, thereby driving color conversions even in the absence of immediate selective advantage.
This model explains the observed phylogenetic distribution where different chromophore structures appear as alternative products synthesized within similar autocatalytic environments, with selection and mutation pressure acting as opposing forces determining the prevalence of specific spectral variants [17].
Functional Diversification in Cephalochordates
Further evidence for evolutionary diversification comes from cephalochordates (amphioxus), which encode the largest known family of GFP-like proteins [34]. The amphioxus Branchiostoma floridae possesses 16 GFP-like genes that have diversified into distinct functional classes with differences in fluorescence intensity, extinction coefficients, and absorption profiles [34]. Some members exhibit antioxidant capacity, suggesting functional diversification beyond light-based functions.
Ka/Ks ratios for all amphioxus GFPs are less than one, indicating they continue to be under purifying selection despite their diversification, though with apparent relaxation for highly duplicated clades [32] [34]. This expansion appears to be largely driven by tandem duplications, with the high sequence similarities between different clades providing a model system to map sequence variation to functional changes [34].
Quantitative Analysis of GFP Spectral Diversity
Spectral Characteristics Across Taxa
Table 1: Spectral Properties of Representative GFP-like Proteins from Diverse Organisms
| Protein Name | Source Organism | Excitation Max (nm) | Emission Max (nm) | Extinction Coefficient (M⁻¹cm⁻¹) | Quantum Yield | Reference |
|---|---|---|---|---|---|---|
| avGFP (wt) | Aequorea victoria | 395/475 | 509 | ~21,000-30,000 | 0.79 | [25] |
| EGFP | Engineered variant | 488 | 509 | 55,000 | 0.60 | [25] |
| StayGold | Cytaeis uchidae | 496 | 509 | 159,000 | 0.93 | [35] |
| CU17S (V168A) | Cytaeis uchidae | 496 | 509 | 159,000 | 0.93 | [35] |
| mcavRFP | Montastraea cavernosa | 490 (minor), ~550 (major) | 605 (with ~630 shoulder) | Not reported | Not reported | [17] |
| zoan2RFP | Zoanthus sp. | 558 | 583 | Not reported | Not reported | [17] |
| GFPa1 | Branchiostoma floridae | 492 | 505 | Not reported | Not reported | [34] |
| GFPf1 | Branchiostoma floridae | Non-fluorescent | Non-fluorescent | Not reported | Not reported | [34] |
Recent Engineering Advances in GFP Properties
Table 2: Performance Comparison of Modern Engineered GFP Variants
| Protein Name | Photostability (t₁/₂, seconds) | Brightness | Oligomerization State | Primary Applications |
|---|---|---|---|---|
| StayGold | >10,000 | High | Dimer (tandem dimer available) | Long-term live-cell imaging, SRM |
| EGFP | ~500 | Medium | Monomer | General purpose |
| mNeonGreen | Not reported | High | Monomer | General purpose, fusions |
| sfGFP | Not reported | Medium | Monomer | Fusions with poorly-folding partners |
| PROSS-eGFP | Not reported | Medium | Monomer | Thermostable variant (96°C) |
Experimental Protocols for GFP Characterization
Cloning and Characterization of Novel GFP-like Proteins
The discovery and characterization of new GFP variants follow established molecular biology workflows that can be adapted to diverse biological sources.
Sample Collection and Preparation: Candidate organisms are typically collected during night dives and initially screened using UV flashlights to identify fluorescent specimens [17]. Tissue samples (100-500 mg) are preserved for RNA extraction. For example, in the characterization of 11 new GFP-like proteins, samples included Montastraeca cavernosa, Condylactis gigantea, and Ricordea florida collected from the Florida Keys Marine Sanctuary [17].
RNA Isolation and cDNA Synthesis: Total RNA is isolated from tissue samples using standard protocols (e.g., guanidinium thiocyanate-phenol-chloroform extraction) [17]. Total cDNA is then amplified using kits such as the SMART cDNA amplification kit (CLONTECH), which enables full-length cDNA synthesis from nanogram quantities of total RNA.
Cloning GFP Genes: Amplified cDNA is used as a template to amplify 3' fragments of GFP-like protein genes using degenerate primers designed against conserved regions, followed by retrieval of 5' flanks via RACE (Rapid Amplification of cDNA Ends) [17]. Complete coding regions are amplified using primers containing the initiation and stop codons of the open reading frame, often with additional sequences providing bacterial ribosome-binding sites and frameless stop codons to enable efficient expression.
Heterologous Expression and Screening: PCR products are cloned into plasmid vectors (e.g., pGEM-T) and transformed into E. coli hosts such as JM109 strain [17]. Colonies are grown on selective plates supplemented with IPTG for 16-20 hours at 37°C, then incubated for several days at 4°C to allow chromophore maturation. Fluorescent colonies are identified using fluorescence microscopy and selectively streaked for further analysis.
Spectroscopic Characterization: Bacterial cells are harvested, suspended in PBS, and disrupted by sonication [17]. Cleared lysates are obtained by centrifugation (5,000 × g, 10 minutes), and fluorescent properties are determined using a spectrofluorometer (e.g., Perkin-Elmer LS-50B). Emission spectra should be corrected for the wavelength-dependent sensitivity of the photomultiplier. For proteins with complex maturation pathways like "timer" RFPs, multiple timepoints may be necessary (e.g., "early" samples after 24h at 37°C and "late" samples after additional days at 4°C).
Computational Analysis of GFP Evolution
Sequence Alignment and Phylogenetic Reconstruction: Protein sequences are aligned using structure-based constraints to ensure proper registration of the β-strands forming the GFP barrel [17]. Poorly aligned N- and C-terminal regions are typically excluded from analysis. DNA alignments are then constructed based on the protein alignment.
Phylogenetic trees can be constructed using software such as tree-puzzle under appropriate models of DNA evolution (e.g., HKY model with γ-distributed site variability) [17]. Maximum likelihood trees can be confirmed using packages like PAML under REV models. The resulting phylogenies enable identification of clades and analysis of color distribution patterns across the evolutionary tree.
Selection Pressure Analysis: The strength and direction of natural selection acting on GFP genes can be quantified by comparing rates of nonsynonymous (dN) and synonymous (dS) substitutions across lineages and sites [34]. Ratios of dN/dS < 1 indicate purifying selection, while dN/dS > 1 suggests positive selection. These analyses can reveal whether particular amino acid sites or clades have experienced divergent selective pressures related to color conversion.
Research Reagent Solutions for GFP Studies
Table 3: Essential Research Reagents for GFP Evolutionary Studies
| Reagent/Category | Specific Examples | Function/Application | Technical Notes |
|---|---|---|---|
| Cloning Systems | pGEM-T vector, pET28a(+) | Heterologous expression in bacterial systems | pGEM-T allows direct TA cloning of PCR products; pET28a provides strong inducible expression |
| Expression Hosts | E. coli JM109, BL21 | Protein expression and screening | JM109 suitable for general cloning; BL21 optimized for protein production |
| cDNA Synthesis Kits | SMART cDNA amplification kit | Full-length cDNA synthesis from limited RNA | Particularly valuable for rare samples or low-abundance transcripts |
| Spectroscopic Equipment | LS-50B spectrofluorometer | Spectral characterization | Enables collection of excitation/emission spectra with correction for detector sensitivity |
| Chromatography Media | Anion-exchange resins | Protein purification and separation of isoforms | Useful for separating different maturation states or spectral variants |
| Phylogenetic Software | tree-puzzle, PAML | Evolutionary analysis and selection pressure detection | Implements maximum likelihood methods for tree reconstruction and dN/dS calculation |
| Cell Lines | HEK293, U2OS, HeLa | Mammalian expression validation | Tests functionality in eukaryotic cellular environment |
| Machine Learning Tools | EpiNNet, htFuncLib | Prediction of functional multipoint mutants | Addresses epistatic interactions in active site design [36] |
Visualization of Evolutionary and Engineering Workflows
GFP Color Evolution Mechanism
High-Throughput Functional Library Design
The evolutionary history of GFP-like proteins demonstrates how the interplay between mutation pressure and natural selection drives functional diversification at the molecular level. The phylogenetic distribution of these proteins across cnidarians and cephalochordates, combined with their diverse spectral properties, provides a compelling model for studying how genetic variation leads to functional innovation. Experimental methods for characterizing new GFP variants continue to evolve, with recent advances in machine learning approaches like htFuncLib enabling more efficient exploration of sequence-function relationships [36]. These findings not only illuminate fundamental evolutionary processes but also provide researchers with enhanced tools for protein engineering applications in basic research and drug development.
Harnessing Nature's Rainbow: GFP Analogs as Tools in Modern Biomedicine and Drug Discovery
The discovery and subsequent development of fluorescent proteins (FPs) have revolutionized cell biology, enabling researchers to visualize protein dynamics within living systems. The phylogenetic distribution of Green Fluorescent Protein (GFP) analogs provides a critical evolutionary context for these technological advancements. Initially discovered in the jellyfish Aequorea victoria [17] [37], GFP-like proteins have since been identified across diverse organisms including other Cnidarians (corals and anemones), Copepods, and Cephalochordates (amphioxus) [17] [38]. This broad phylogenetic occurrence indicates that fluorescent proteins appeared early in animal evolutionary history and have undergone significant diversification. In cephalochordates alone, the GFP gene family has expanded to include at least 13 functional genes, representing the largest known GFP family [38]. This natural diversity provides a rich toolkit of FP variants with different spectral properties and maturation characteristics that researchers have harnessed for protein tagging. The evolutionary trajectory of these proteins reveals a story of gene duplication, divergence, and functional specialization, processes that biotechnology has mirrored in creating the sophisticated FP variants used in modern live-cell imaging [17] [38].
Protein Tagging Methodologies: From Basic Fusions to Advanced Systems
Fluorescent Protein Fusion Tags
The fundamental approach to protein tagging involves genetically fusing the coding sequence of a fluorescent protein to the gene of interest, resulting in a fusion protein that can be visualized in live cells [39]. This methodology typically involves creating either N-terminal or C-terminal fusions, though internal tagging is also possible [39]. The key advantage of FP tagging is its ability to reveal protein localization and dynamics without the need for exogenous substrates or cofactors, as the chromophore forms autocatalytically [17] [39]. Early implementations faced challenges in plant systems due to a cryptic intron in the original jellyfish GFP sequence that was incorrectly processed, but codon optimization resolved this issue, enabling widespread application across diverse biological systems [39].
Advanced Tagging Systems and Pooled Screening Approaches
Beyond direct FP fusions, several sophisticated protein tagging systems have been developed. SNAP-tag technology enables specific labeling of fusion proteins with a variety of fluorescent substrates, allowing simultaneous dual protein labeling and pulse-chase experiments [40]. Recently, pooled screening approaches have dramatically increased throughput. The vpCell (visual proteomics cell) platform uses multicolour tagging with genome-wide intron-targeting sgRNA libraries to generate cell pools where individual clones express two different endogenously tagged fluorescent proteins [41]. This system leverages computer vision and machine learning to identify clones based on the unique "visual barcodes" created by the combination of localization patterns and expression levels of the tagged proteins, enabling simultaneous monitoring of hundreds of proteins in a single experiment [41].
Table 1: Comparison of Major Protein Tagging Methodologies
| Methodology | Key Features | Applications | Advantages | Limitations |
|---|---|---|---|---|
| Fluorescent Protein Fusions [39] | Genetic fusion of FP to protein of interest | Protein localization, dynamics, trafficking | No need for exogenous substrates; suitable for long-term imaging | Large tag size (~25 kD) may affect protein function |
| SNAP-tag/CLIP-tag [40] | Enzyme-based tagging system using small molecule substrates | Simultaneous dual labeling, pulse-chase experiments, receptor internalization | Small tag size; variety of fluorescent substrates | Requires addition of exogenous substrate |
| Pooled Multicolour Tagging (vpCell) [41] | Endogenous tagging with two different FPs using sgRNA libraries | Large-scale protein dynamics screening, drug discovery | High-throughput; monitors hundreds of proteins simultaneously | Complex computational analysis required |
Quantitative Assessment of Fluorescent Proteins
The selection of appropriate fluorescent proteins requires careful consideration of multiple photophysical properties. Quantitative comparisons of over 40 different FPs have revealed significant variations in brightness, photostability, and pH stability [37]. Brightness, defined as the product of extinction coefficient and fluorescence quantum yield, peaks in the middle of the visible spectrum with yellow and orange FPs such as mVenus and mKO [37]. This pattern follows fundamental fluorophore properties, as blue fluorophores (with higher energy transitions) typically have smaller extinction coefficients, while red FPs suffer from lower quantum yields due to reduced fluorophore rigidity in larger conjugated systems [37].
Photostability represents another critical parameter, with measured bleaching half-times ranging from 2.7 seconds for DsRed2 to 530 seconds for mCardinal under identical imaging conditions [37]. Notably, most FPs exhibit "accelerated photobleaching," where the bleaching rate increases supralinearly with illumination intensity [37]. This property has significant implications for microscopy method selection, as laser scanning confocal microscopy (with its high instantaneous intensity) causes dramatically faster photobleaching compared to widefield microscopy at identical total power [37].
Table 2: Photophysical Properties of Selected Fluorescent Proteins [37]
| Fluorescent Protein | Color Class | Excitation Max (nm) | Emission Max (nm) | Relative Brightness | Photobleaching Half-time (s) | Oligomeric State |
|---|---|---|---|---|---|---|
| mCerulean | Cyan | 433 | 475 | 0.35 | 108 (in cells) | Monomer |
| EGFP | Green | 488 | 507 | 1.00 | 239 (in cells) | Monomer |
| mVenus | Yellow | 515 | 528 | 1.56 | 58 (in cells) | Monomer |
| mKO | Orange | 548 | 559 | 1.66 | N/A | Monomer |
| mCherry | Red | 587 | 610 | 0.47 | 348 (in cells) | Monomer |
| mKate2 | Far-Red | 588 | 633 | 0.40 | N/A | Monomer |
| mCardinal | Far-Red | 604 | 659 | 0.30 | 530 | Monomer |
Live-Cell Imaging Techniques and Considerations
Maintaining Physiological Conditions
Successful live-cell imaging requires maintaining cells in a physiological state throughout the experiment. This necessitates careful control of temperature, pH, oxygen levels, and other environmental factors [42]. Widefield microscopes are often preferred for live-cell imaging as they typically use lower light doses for fluorophore excitation compared to confocal systems, reducing phototoxicity and preserving cell viability [42]. Additionally, widefield imaging provides faster acquisition, which is crucial for capturing rapid cellular dynamics [42].
Advanced Imaging Modalities
Several specialized microscopy techniques have been adapted for live-cell imaging to address specific biological questions:
TIRF (Total Internal Reflection Fluorescence) Microscopy: This technique uses an evanescent field that penetrates only 60-250 nm into the cell, providing exceptional z-resolution for imaging events at or near the plasma membrane, such as vesicle transport and receptor internalization [42].
FRET (Förster Resonance Energy Transfer): FRET enables quantification of protein-protein interactions and conformational changes by measuring energy transfer between FP pairs (typically CFP and YFP) when they are in close proximity (<20 nm) [42]. Recent advancements include GFP-inspired solvatochromic dyes that can detect structural changes in proteins such as GPCRs, offering both intensity-based and ratiometric tracking [43].
FRAP (Fluorescence Recovery After Photobleaching): This technique involves bleaching fluorescence in a specific region of the cell with high-intensity light and monitoring the recovery as fluorescently tagged proteins move into the bleached area, providing insights into protein mobility and trafficking [42].
Live-cell imaging workflow covering sample preparation to data analysis.
Experimental Protocols for Protein Localization Studies
Pooled Multicolour Tagging Workflow
The vpCell approach for large-scale protein localization studies involves a sophisticated multi-step process [41]:
Library Design and Cloning: Design an intron-targeting sgRNA library (e.g., 90,657 sgRNAs targeting 73,817 introns of 14,158 genes for genome-wide coverage) using bioinformatic tools that consider sgRNA cutting efficiency and tag position within the protein structure.
First Round of Tagging: Transduce cells (e.g., HEK293T) with the frame 0 sgRNA library, then co-transfect with minicircle donor DNA containing a GFP-coding synthetic exon and a Cas9-expressing plasmid. NHEJ-mediated integration results in GFP tagging of various proteins across the cell population.
Selection and Sorting: Sort GFP-positive cells to enrich for successfully tagged proteins. Amplicon sequencing of the sgRNA pool identifies high-efficiency sgRNAs (typically ~5% of the initial library) that yield functional tagged proteins.
Second Round of Tagging: Perform a second round of intron tagging using an orthogonal sgRNA library targeting a different intron frame (frame 1) and a matching minicircle with mScarlet (red fluorescent protein) coding sequence.
Visual Barcode Enhancement: Transduce double-positive cells with constructs expressing BFP fused to different localization signals and with membrane (mAmetrine-CAAX) and nuclear (NLS-miRFP670-miRFP670nano) markers to increase visual diversity and facilitate cell segmentation.
Image Acquisition and Analysis: Image the cell pool before and after perturbations. Use computer vision algorithms to learn clone identities from the unique combination of localization patterns and intensity levels of the two tagged proteins in each cell.
Validation and Troubleshooting
When performing FP tagging experiments, several considerations are essential for generating reliable results [39]:
Tag Position: Both N-terminal and C-terminal fusions should be tested, as the position of the FP can affect protein function and localization. N-terminal tagging is often more successful, particularly when targeting early introns [41] [39].
Functionality Validation: Where possible, FP-tagged proteins should be tested for their ability to complement loss-of-function mutants to verify that the fusion protein retains biological activity [39].
Background Considerations: In plant systems, autofluorescence from cell walls and plastids can interfere with FP signals. Modern confocal microscopes can address this through spectral unmixing and background subtraction based on reference images from non-FP expressing cells [39].
Controls for Localization: Co-localization with established organelle markers is essential for verifying subcellular localization claims. A set of fluorescent organelle markers with different spectral properties is available for this purpose [39].
Pooled multicolour tagging workflow for high-throughput localization studies.
The Scientist's Toolkit: Essential Research Reagents
Table 3: Key Research Reagent Solutions for Protein Localization Studies
| Reagent/Tool | Function/Application | Key Features |
|---|---|---|
| Minicircle Donor DNA [41] | DNA donor for CRISPR/Cas9-mediated tagging | Improved tagging efficiency; reduces random integration compared to plasmid donors |
| Intron-Targeting sgRNA Libraries [41] | Targeted insertion of FP sequences into endogenous genes | Enables endogenous tagging; genome-wide or focused libraries available |
| SNAP-tag/CLIP-tag Systems [40] | Enzyme-based protein labeling | Single clone for multiple substrates; simultaneous dual labeling; highly specific covalent labeling |
| Fluorescent Organelle Markers [39] | Reference markers for subcellular compartments | Validated targeting sequences; available in multiple colors for co-localization studies |
| Environment-Sensitive Dyes [43] | Detect conformational changes in proteins | GFP-inspired solvatochromic dyes; enable ratiometric tracking of structural changes |
| CRISPR/Cas9 Components [41] | Genome editing for endogenous tagging | Precise insertion of FP sequences at defined genomic locations |
The field of protein tagging and cellular localization continues to evolve, driven by both our understanding of FP phylogenetic diversity and technological innovations. The natural variation in GFP-like proteins across species [17] [38] provides a template for engineering improved variants with enhanced brightness, photostability, and spectral characteristics [37]. Meanwhile, methodological advances such as pooled multicolour tagging [41] and sophisticated computational analysis are transforming protein localization studies from descriptive observations to quantitative, dynamic analyses of cellular processes. As these technologies mature, they promise to reveal unprecedented details of protein behavior in living systems, with broad applications in basic research and drug discovery. The integration of evolutionary biology with cutting-edge imaging technologies represents a powerful paradigm for advancing our understanding of cellular dynamics.
Protein-protein interactions (PPIs) are fundamental to virtually all biological processes, including signal transduction, transcriptional regulation, metabolic pathways, and cellular structure maintenance [44]. The critical role of PPIs in health and disease has made them a focal point for pharmaceutical intervention, with PPI modulators emerging as promising therapeutic strategies for cancer, neurodegenerative diseases, and other disorders [44] [45]. Over the years, numerous methods have been developed to study PPIs, including yeast two-hybrid (Y2H) assays, co-immunoprecipitation (Co-IP), pull-down assays, and surface plasmon resonance (SPR). However, these conventional techniques often suffer from limitations such as false positives, inability to detect transient interactions, and restricted application in live-cell contexts [44].
Among the advanced technologies developed to overcome these limitations, Förster resonance energy transfer (FRET) and split-protein systems have emerged as powerful tools for investigating PPIs with high spatial and temporal resolution. FRET operates as a "molecular ruler" that detects interactions occurring within 1-10 nanometers, making it exceptionally well-suited for monitoring direct molecular interactions in living cells under physiological conditions [44] [45]. The convergence of these technologies with the expanding family of green fluorescent protein (GFP) analogs has created unprecedented opportunities for studying PPIs across diverse biological systems, leveraging the phylogenetic diversity of these fluorescent proteins discovered in cnidarians, copepods, and cephalochordates [17] [11] [38].
FRET-Based PPI Monitoring Technologies
Fundamental Principles of FRET
FRET is a non-radiative energy transfer process that occurs through dipole-dipole coupling between a donor fluorophore and an acceptor fluorophore when they are in close proximity (typically within 1-10 nm) [44] [45]. The efficiency of this energy transfer (E) is inversely proportional to the sixth power of the distance between the fluorophores, as described by the Förster equation: E = 1/{1 + (R/Ro)⁶}, where R represents the actual distance between donor and acceptor, and Ro is the Förster distance at which the transfer efficiency is 50% [45]. This strong distance dependence enables FRET to function as a sensitive molecular ruler for quantifying molecular interactions and conformational changes.
The effectiveness of FRET depends on several critical factors: (1) significant spectral overlap between the donor emission and acceptor excitation spectra, (2) proper relative orientation of the donor and acceptor transition dipoles, and (3) the proximity between the fluorophores within the characteristic Förster distance [45]. In PPI studies, this is typically achieved by fusing the proteins of interest to appropriate donor and acceptor fluorophores. When the proteins interact and bring the fluorophores within the Förster distance, energy transfer occurs, resulting in decreased donor emission and increased acceptor emission, which can be quantified to measure the interaction.
Advanced FRET Modalities for PPI Studies
Conventional FRET
Conventional FRET relies on steady-state fluorescence intensity measurements between donor and acceptor fluorophores [44]. This approach has been widely used to study diverse PPIs, such as the formation of heterotrimeric complexes among Bad, Bcl-xL, and tBid in mitochondria, demonstrating its utility in studying PPI stoichiometry and affinity within apoptotic signaling pathways [44]. However, the accuracy of conventional FRET can be affected by background fluorescence, spectral crosstalk, and variations in fluorophore concentrations, which has prompted the development of more advanced FRET modalities.
Fluorescence Lifetime Imaging Microscopy-FRET (FLIM-FRET)
FLIM-FRET measures changes in the fluorescence lifetime of the donor fluorophore, which is independent of fluorophore concentration and laser intensity, providing more reliable quantitative data [44]. This technique enables direct visualization of PPIs with high temporal and spatial resolution, allowing researchers to map molecular interactions within live cells and tissues. For instance, Khramtsov et al. employed FLIM-FRET to visualize the subcellular distribution and dynamic behavior of Keap1 in live cells, revealing interaction features that could not be resolved using intensity-based methods [44]. FLIM-FRET is particularly valuable for studying complex biological systems where precise quantification is essential.
Single-Molecule FRET (smFRET)
smFRET provides extremely high spatial and temporal resolution at the individual molecule level, making it ideal for studying molecular mechanisms, conformational changes, and PPI kinetics in real time [44] [45]. This approach has revealed dynamic aspects of PPIs that are obscured in ensemble measurements, such as the continuum of NF-κB conformations in both free and DNA-bound states observed by Chen et al., who identified structural transitions occurring on timescales from subseconds to minutes [44]. smFRET is particularly powerful for characterizing transient intermediates and heterogeneous populations in PPI pathways.
Time-Resolved FRET (TR-FRET)
TR-FRET combines the principles of time-resolved fluorescence and FRET, typically utilizing long-lifetime lanthanide chelates as donors and conventional fluorophores as acceptors [44] [45]. By employing time-gated detection, TR-FRET effectively eliminates short-lived background fluorescence, significantly enhancing detection sensitivity. This makes it especially suitable for detecting low-abundance targets and for high-throughput screening applications. Tang et al. established a TR-FRET-based screening protocol for PPI modulators that remains effective even at low protein concentrations, demonstrating its promise for discovering small-molecule PPI inducers and inhibitors [44].
Fluorescence Cross-Correlation Spectroscopy FRET (FCCS-FRET)
FCCS-FRET combines fluorescence cross-correlation spectroscopy with FRET to enable quantitative analysis of molecular interactions in live cells by monitoring the correlated diffusion of two fluorescently labeled molecules [44]. This technique provides information on individual molecular concentration and dynamics within a femtoliter-scale observation volume. Shi et al. utilized pulsed interleaved excitation FCCS-FRET (PIE-FCCS-FRET) to analyze the conformational features of ephrin receptor tyrosine kinase type-A receptor 2 (EphA2) within live monkey kidney cells, demonstrating the capability of this approach to study PPIs in physiologically relevant environments [44].
Table 1: Comparison of FRET Modalities for PPI Studies
| FRET Modality | Key Principle | Spatial Resolution | Key Applications in PPI Studies | Advantages | Limitations |
|---|---|---|---|---|---|
| Conventional FRET | Steady-state intensity measurements | ~1-10 nm | Studying PPI stoichiometry and affinity [44] | Simplicity, wide availability | Affected by background fluorescence and spectral crosstalk |
| FLIM-FRET | Fluorescence lifetime changes | ~1-10 nm | Spatial mapping of PPIs in live cells [44] | Insensitive to fluorophore concentration, quantitative | Complex instrumentation and analysis |
| smFRET | Single-molecule detection | ~1-10 nm | Conformational dynamics and transient interactions [44] | Reveals heterogeneity and dynamics | Low throughput, technical complexity |
| TR-FRET | Time-gated detection with long-lifetime probes | ~1-10 nm | High-throughput screening of PPI modulators [44] | Reduced background, high sensitivity | Requires specialized fluorophores |
| FCCS-FRET | Cross-correlation of diffusion | ~1-10 nm | Quantitative analysis in live cells [44] | Live-cell application, quantitative binding data | Limited to soluble proteins, technical complexity |
Split-Protein Systems for PPI Monitoring
Fundamental Principles of Split-Protein Systems
Split-protein systems represent a powerful complementary approach to FRET for monitoring PPIs. These systems are based on the fragmentation of reporter proteins into inactive fragments that are fused to potential interaction partners. When the proteins of interest interact, they facilitate the reassembly of the reporter protein, generating a detectable signal [46]. The most common application of this principle is bimolecular fluorescence complementation (BiFC), which uses split fluorescent proteins to detect PPIs through the restoration of fluorescence [46].
Early split-protein systems faced challenges with solubility, proper folding of large protein fragments, and high background signals. However, recent advances have addressed these limitations through the use of smaller fragment tags that reduce aggregation and minimize interference with native protein function [46]. The tripartite split-system developed by Cabantous et al. represents a significant innovation, utilizing three GFP fragments: two small fragments (GFP10 and GFP11) tagged to the proteins of interest, and a larger detector fragment (GFP1-9) that completes the assembly when the two interaction partners bring the small fragments into proximity [46].
Tripartite Split-ccGFP System
A recently engineered tripartite split system based on Corynactis californica GFP (ccGFP) demonstrates the ongoing innovation in this field [46]. This system functions through the same fundamental principle as traditional split-GFP systems but offers improved performance characteristics, including three-fold faster complementation kinetics compared to Aequorea victoria GFP-based systems, enhanced pH and temperature stability, and orthogonality that enables multiplexed labeling with other fluorescent protein systems [46].
In the tripartite split-ccGFP system, the proteins of interest are tagged with either ccGFP10 or ccGFP11 fragments. If the proteins interact, these fragments are brought into proximity, enabling complementation with the ccGFP1-9 detector fragment to reconstitute functional ccGFP with fluorescent signal [46]. The system was validated using two model PPI systems: attractive/repulsive coiled-coils and rapamycin-inducible FRB/FKBP heterodimerization, demonstrating its robustness for detecting PPIs with high specificity and sensitivity [46].
Comparison of Split-System Approaches
Table 2: Comparison of Split-Protein Systems for PPI Studies
| System Type | Key Components | Detection Method | Key Applications | Advantages | Limitations |
|---|---|---|---|---|---|
| Bimolecular Fluorescence Complementation (BiFC) | Two fragments of fluorescent protein | Fluorescence restoration | Detection of binary PPIs in live cells [46] | High sensitivity, irreversible detection | Potentially irreversible, slow maturation |
| Tripartite Split GFP | GFP10, GFP11 tags on POIs + GFP1-9 detector | Fluorescence complementation | Characterizing PPI networks [46] | Low background, small tag size | Slower kinetics than ccGFP system |
| Tripartite Split ccGFP | ccGFP10, ccGFP11 tags + ccGFP1-9 detector | Fluorescence complementation | Detecting PPIs with improved kinetics [46] | Fast complementation, pH and temperature stability | Relative novelty, less established |
Quantitative Analysis of PPIs
FRET Efficiency as a Measure of Interaction Affinity
FRET enables not only the detection of PPIs but also the quantification of interaction affinities. Research has demonstrated a strong correlation between FRET efficiency and the dissociation constant (KD) of protein complexes over a wide affinity range from millimolar to nanomolar [47]. This relationship follows a linear pattern when FRET efficiency is plotted against pKD (-log KD), described by the equation: E = 0.0517 × pKD + 0.0157 (r² = 0.92) [47]. This quantitative relationship provides a powerful approach for assessing PPI affinities directly in living cells, offering significant advantages over traditional in vitro methods.
The application of this principle enables researchers to distinguish between interactions of different strengths, which is crucial for understanding the biological relevance of PPIs. For instance, a 10-fold increase in interaction affinity results in an approximately 0.05 unit increase in FRET efficiency, providing sufficient resolution to quantify significant affinity differences using live-cell FRET measurements [47]. This approach has been validated across a diverse set of protein complexes belonging to different structural folds, including PDZ domains, SH2 domains, WW domains, and ubiquitin-binding domains [47].
Experimental Considerations for Quantitative FRET
When implementing FRET for quantitative affinity measurements, several critical factors must be considered: (1) controlled expression of donor and acceptor fusion proteins to ensure proper stoichiometry, (2) selection of appropriate FRET pairs with optimal Förster distance and spectral properties, (3) implementation of proper controls to account for spectral bleed-through and direct excitation of the acceptor, and (4) use of validated reference standards for calibration [44] [47]. The single-plasmid expression system in E. coli has proven particularly effective for such quantitative measurements, ensuring consistent expression ratios of the interaction partners and simplifying the experimental workflow [47].
The Scientist's Toolkit: Essential Research Reagents
Table 3: Key Research Reagent Solutions for FRET and Split-System Experiments
| Reagent Category | Specific Examples | Function in PPI Studies | Technical Notes |
|---|---|---|---|
| Fluorescent Proteins | GFP, YFP, CFP, RFP, ccGFP | Donor/acceptor pairs for FRET; split fragments for BiFC | ccGFP offers faster kinetics and orthogonality [46] |
| Specialized Fluorophores | Lanthanide chelates (Eu³⁺, Tb³⁺), quantum dots | TR-FRET applications; enhanced photostability | Lanthanides enable time-gated detection [44] |
| Expression Systems | Single plasmid systems in E. coli | Controlled expression of interaction partners | Ensures proper stoichiometry for quantitative measurements [47] |
| Model PPI Systems | Coiled-coil peptides, FRB/FKBP | System validation and controls | Rapamycin-inducible for dynamic studies [46] |
| Detection Tools | Anti-GFP nanobodies, scFvs | Secondary detection and signal amplification | Enables orthogonal detection methods [46] |
Phylogenetic Context of GFP Analogs in PPI Studies
The expanding diversity of GFP analogs from phylogenetically diverse organisms provides a rich toolkit for PPI studies. GFP-like proteins have been identified in cnidarians (including Aequorea victoria), copepods, and cephalochordates (amphioxus), with each lineage exhibiting unique spectroscopic properties and structural features [17] [11] [38]. Cephalochordates, in particular, display remarkable expansion of GFP gene families, with Branchiostoma floridae possessing at least 13 functional GFP genes representing the largest GFP family discovered to date [38].
The phylogenetic distribution of GFP-like proteins reveals a complex evolutionary history, possibly involving both vertical inheritance and horizontal gene transfer events [11] [38]. These proteins have diversified into distinct functional classes with variations in emission spectra, maturation kinetics, and oligomerization states, providing researchers with an extensive palette of tools optimized for different experimental applications [17] [38]. The recent engineering of a tripartite split-ccGFP system from Corynactis californica demonstrates how exploring phylogenetic diversity can lead to improved technologies with faster complementation kinetics and enhanced stability [46].
The functional diversity observed among naturally occurring GFP analogs includes variations in chromophore structure that result in different spectral properties, from green and red fluorescent proteins to non-fluorescent chromoproteins [17]. Some red-emitting proteins, such as those from Montastraea cavernosa (mcavRFP) and Ricordea florida (rfloRFP), exhibit unusual "timer" characteristics where they initially appear green and gradually mature to red, while others display complex excitation spectra suggesting potential FRET between different maturation states within the same protein [17]. This natural diversity provides a rich resource for engineering improved tools for PPI studies.
Integrated Experimental Protocols
FRET-Based Affinity Determination Protocol
Construct Design: Clone genes of interest into appropriate FRET vectors, ensuring in-frame fusion with selected donor and acceptor fluorophores (e.g., CFP-YFP pair). Include flexible linkers between the protein and fluorophore to minimize steric hindrance.
Expression System: Utilize a single-plasmid system in E. coli to ensure consistent expression ratios of interaction partners. Induce expression with appropriate inducers (e.g., IPTG) and optimize expression time and temperature.
Sample Preparation: Harvest cells and resuspend in appropriate buffer for fluorescence measurements. For live-cell measurements, maintain cells under physiological conditions throughout the analysis.
FRET Measurements: Acquire fluorescence spectra using a spectrofluorometer with appropriate excitation and emission settings. For the CFP-YFP pair, excite at 433 nm and collect emission spectra from 450-600 nm.
Data Analysis: Calculate FRET efficiency using the acceptor photobleaching method or sensitized emission approach. Determine the dissociation constant (KD) using the established relationship between FRET efficiency and pKD [47].
Tripartite Split-ccGFP PPI Detection Protocol
Fragment Tagging: Fuse the genes of interest to ccGFP10 and ccGFP11 fragments using standard molecular biology techniques. Verify proper folding and function of the fusion proteins.
Detector Preparation: Express and purify the ccGFP1-9 detector fragment using an appropriate expression system. Verify the lack of fluorescence in the detector alone.
Interaction Assay: Combine the tagged proteins of interest with the detector fragment in equimolar ratios. Include appropriate controls: proteins with known interaction (positive control), non-interacting proteins (negative control), and each component alone.
Fluorescence Measurement: Incubate the reaction mixture to allow for complementation and chromophore maturation. Measure fluorescence using standard laboratory equipment (plate reader or fluorometer) with excitation at 470-490 nm and emission at 510-530 nm.
Data Interpretation: Normalize fluorescence signals against controls. The fluorescence intensity correlates with the strength of the PPI, allowing for comparative analysis of interaction strengths [46].
FRET and split-system technologies represent powerful and complementary approaches for monitoring protein-protein interactions with high spatial and temporal resolution. The continuous expansion of the GFP analog toolkit, driven by exploration of phylogenetic diversity across cnidarians, copepods, and cephalochordates, has significantly enhanced our ability to study PPIs under physiological conditions. The quantitative relationship between FRET efficiency and binding affinity enables researchers to extract thermodynamic parameters directly in living cells, while advanced split-system approaches offer sensitive detection with minimal perturbation to native protein function.
The integration of these technologies with the growing understanding of GFP evolution and diversity promises to further advance the field of PPI research. As new GFP analogs with improved properties continue to be discovered and engineered, and as existing methodologies are refined through innovations such as the tripartite split-ccGFP system, researchers will gain increasingly powerful tools to decipher the complex networks of molecular interactions that underlie biological function and dysfunction. These advances will undoubtedly accelerate both basic research and drug discovery efforts targeting pathological PPIs in human disease.
The phylogenetic distribution of Green Fluorescent Protein (GFP) analogs across diverse organisms, from cnidarians to cephalochordates, has provided scientists with a versatile molecular toolkit for visualizing cellular processes in live cells and tissues [38]. These light-responsive proteins, which serve functional roles including photoprotection and prey capture in corals, have become indispensable in modern drug discovery [14]. The integration of GFP-based reporters with increasingly sophisticated three-dimensional (3D) cell culture technologies represents a significant advancement toward more physiologically relevant and predictive screening systems. Where conventional two-dimensional (2D) monolayers fail to recapitulate the complex architecture of human tissues, 3D spheroid models now provide a microenvironment that mimics critical physiological barriers, enabling more accurate assessment of compound permeability and efficacy [48].
This technical guide explores the convergence of these fields, detailing how high-throughput screening (HTS) platforms incorporating 3D spheroid models and GFP-based reporting are transforming modern drug discovery. We examine the foundational principles, practical methodologies, and key applications of these systems, with particular emphasis on their capacity to bridge the gap between traditional in vitro models and clinical outcomes through enhanced biological relevance and screening efficiency.
The Shift from 2D to 3D Models in Drug Screening
Limitations of Conventional 2D Screening Systems
Traditional HTS has predominantly relied on 2D cell cultures grown as monolayers on flat surfaces. While these systems offer advantages in simplicity, scalability, and cost-effectiveness, they suffer from significant biological limitations that compromise their predictive value. Cells in 2D culture adopt flattened morphologies and exhibit altered gene expression patterns, disrupted cell-cell and cell-matrix interactions, and lack the physiological gradients of oxygen, nutrients, and metabolic waste products that characterize native tissues [48]. These discrepancies contribute to poor translation of drug responses from in vitro screens to clinical outcomes, particularly for compounds targeting microenvironment-sensitive processes.
Advantages of 3D Spheroid Models in Permeability Assessment
The transition to 3D models addresses fundamental limitations of 2D systems by recapitulating critical tissue-like properties. Spheroids—self-assembled aggregates of cells—exhibit more natural cell morphology, enhanced cell-cell signaling, and develop physiological diffusion barriers that directly impact drug penetration and efficacy [49]. The beauty of 3D models is that they behave more like real tissues, forming gradients of oxygen, nutrients, and drug penetration that are absent in 2D culture [48]. These characteristics make 3D spheroids particularly valuable for permeability studies, as they replicate the heterogeneous compound distribution observed in human solid tumors and tissues.
Table 1: Comparative Analysis of 2D vs 3D Cell Culture Systems for Drug Screening
| Parameter | 2D Monolayer Culture | 3D Spheroid Models |
|---|---|---|
| Cell morphology | Flattened, elongated | In vivo-like, polyhedral |
| Cell-cell interactions | Limited to flat plane | Omni-directional, natural |
| Proliferation | Uniform, rapid | Gradient-dependent (hypoxic core) |
| Drug penetration | Immediate, uniform | Limited, gradient-dependent |
| Gene expression | Artificially altered | More physiologically relevant |
| Predictive value | Moderate for some targets | High for solid tumors and tissue penetration |
Establishing 3D Spheroid Models for High-Throughput Screening
Core Methods for Spheroid Formation
Multiple techniques have been developed for generating uniform spheroids compatible with HTS workflows. The microwell-based approach utilizes plates containing inverted pyramid-shaped microwells (e.g., AggreWell plates with 1200 microwells per well) to force cells into defined geometries that promote spontaneous aggregation [50]. In a standard protocol, single cells are seeded into these microwells after pretreatment with anti-adherence rinsing solution and centrifugation. The resulting spheroids are then maintained under standard culture conditions with regular medium changes [50].
Advanced microfluidic electrospray technology represents a more sophisticated approach for generating highly uniform spheroids encapsulated in hydrogel matrices. In one implementation for osteosarcoma modeling, a microfluidic chip with nested inner (200 μm) and outer (500 μm) tubes facilitates the formation of core-shell microcarriers (CSMs). Under an applied electric field between the chip outlet and collection phase (2% CaCl₂ solution), 1.5% sodium alginate (ALG) solution and 1% carboxymethyl cellulose (CMC) solution form core-shell droplets that rapidly crosslink into CSMs [49]. This technique enables precise control over spheroid size and distribution, critical for reproducible HTS.
Advanced Co-Culture Systems: Incorporating Vascular Complexity
For permeability studies specifically, more sophisticated spheroid models incorporating vascular elements have been developed. These include capillary cell layered models, where tumor spheroids are encapsulated with human umbilical vein endothelial cells (HUVECs), and artery cell layered models, which add an additional layer of smooth muscle cells (SMCs) to mimic native artery structure [50]. These complex models allow researchers to study tumor-vascular cell interactions and better simulate the endothelial barriers that drugs must traverse to reach their targets.
Table 2: Essential Research Reagents for 3D Spheroid Screening Platforms
| Reagent/Category | Specific Examples | Function in 3D Screening |
|---|---|---|
| Hydrogel Matrices | Sodium alginate (ALG), Carboxymethyl cellulose (CMC) | Provide 3D scaffolding for cell encapsulation and spheroid formation [49] |
| Crosslinking Agents | Calcium chloride (CaCl₂) | Ionic crosslinking of alginate to form stable microcarriers [49] |
| Cell Culture Media | MEM medium, Endothelial Cell Growth Medium 2 | Support viability and growth of specific cell types in 3D format [49] [50] |
| Fluorescent Reporters | GFP-like proteins, CellTracker dyes (CMFDA, CMAC) | Visualize cell location, viability, and compound permeability [50] [3] |
| Viability Assays | CCK-8 assay kit, Live/dead staining kits | Quantify spheroid viability and drug-induced cytotoxicity [49] |
| Microfluidic Materials | PDMS chips, electrospray systems | Enable high-throughput generation of uniform spheroids [49] |
Integration of GFP Technologies in Permeability Assessment
GFP as a Versatile Molecular Tool
The serendipitous discovery of GFP in the jellyfish Aequorea victoria and subsequent identification of GFP-like proteins across diverse species has provided researchers with an unparalleled toolkit for monitoring cellular processes [38]. The phylogenetic diversity of these proteins is remarkable, with cephalochordates like Branchiostoma floridae possessing at least 13 functional GFP genes—the largest known GFP family in any organism [38]. This evolutionary expansion has yielded proteins with varied spectral properties and potential functional specializations that can be harnessed for different screening applications.
In modern HTS, GFP-based reporters serve multiple functions: marking specific cell types in co-culture systems, tracking intracellular trafficking, monitoring gene expression in response to compounds, and serving as biosensors for cellular viability and function. For example, in vascularized spheroid models, GFP-tagged endothelial cells enable precise visualization of barrier integrity and function during permeability assays [50].
Advanced GFP Applications in 3D Models
The utility of GFP extends beyond simple labeling to sophisticated functional assessments in 3D models. Cell trackers like CMFDA (green) and CMAC (blue) allow researchers to monitor the location and migration of different cell populations within complex spheroids [50]. Additionally, engineered GFP variants with different spectral properties enable multiparameter imaging in the same spheroid, crucial for dissecting complex cell-cell interactions in the tumor microenvironment.
Recent innovations include the development of ancestral-sequence reconstructed FPs like QuetzalFP, which demonstrate enhanced stability and photoluminescence quantum yields (up to 90% for green-emitting forms) [3]. Such improved variants offer significant advantages for extended time-lapse imaging in 3D models, where photostability and brightness are essential for capturing dynamic permeability events.
Technical Workflow: Implementing HTS with 3D Spheroid Models
Comprehensive Experimental Protocol
The following detailed methodology outlines a standardized approach for implementing 3D spheroid-based permeability screening:
Step 1: Spheroid Generation
- Select appropriate cell type(s) based on research question (e.g., glioblastoma lines for brain penetration studies).
- For mono-culture spheroids, seed single-cell suspensions into microwell plates (e.g., 5,000-20,000 cells per well in AggreWell plates) and centrifuge (3000 rpm, 10 minutes) to aggregate cells [50].
- For microencapsulated models, prepare core-shell microcarriers using microfluidic electrospray technology: combine 1% CMC with cell suspension as inner phase and 1.5% ALG as outer phase, with collection in 2% CaCl₂ solution for crosslinking [49].
- Culture spheroids for 4-8 days with medium changes every 48-72 hours to permit maturation and establishment of physiological gradients.
Step 2: Model Validation
- Verify spheroid uniformity and size distribution using brightfield microscopy.
- Assess viability using live/dead staining kits (e.g., 30-minute incubation with fluorescent dyes followed by confocal microscopy) [49].
- Confirm establishment of physiological barriers through immunohistochemical staining for tight junction proteins (claudin-5, occludin) or assessment of nutrient/oxygen gradients [50].
Step 3: Compound Screening
- Transfer spheroids to 96- or 384-well screening plates using low-adherence surfaces.
- Treat with compound libraries using automated liquid handling systems; include appropriate controls (vehicle, reference compounds).
- For permeability assessment, utilize GFP-tagged compounds or add fluorescent tracers to quantify penetration kinetics.
- Incubate for predetermined timepoints (typically 4-72 hours) based on compound characteristics and research objectives.
Step 4: Readout and Analysis
- Assess compound efficacy through viability measurements (CCK-8 assay, ATP content) or caspase activation for apoptosis detection [49].
- Evaluate spheroid penetration using confocal microscopy with z-stacking to visualize compound distribution throughout the 3D structure.
- Quantify expression of relevant biomarkers through immunofluorescence staining (e.g., fixation with 4% paraformaldehyde, permeabilization with 0.2% Triton X-100, staining with fluorescent-labeled phalloidin for cytoskeleton) [49].
- Employ high-content imaging systems for automated acquisition and analysis of multiparametric data.
Microfluidic Platform Integration for Enhanced HTS
Advanced screening platforms incorporate microfluidic systems to better control the spheroid microenvironment and enable dynamic dosing. The osteosarcoma-on-a-chip platform exemplifies this approach, integrating CSM-encapsulated spheroids with a microfluidic chip containing a concentration gradient generator and multiple culture chambers [49]. This configuration enables simultaneous testing of multiple drug concentrations and combinations in a single run, significantly enhancing screening throughput and efficiency. Such systems provide precise control over fluidic conditions and better replicate the dynamic nature of in vivo drug exposure profiles compared to static well-based assays.
Data Analysis and Interpretation in 3D Permeability Screening
Key Parameters for Assessment
Analysis of 3D spheroid screening data requires consideration of multiple parameters that collectively provide a comprehensive view of compound performance:
- Permeability Kinetics: Rate and extent of compound penetration through the spheroid, typically quantified via fluorescence intensity profiling from periphery to core.
- Therapeutic Efficacy: Reduction in spheroid viability or growth inhibition, often measured through ATP content, resazurin reduction, or caspase activation.
- Selectivity Index: Differential effect on target versus non-target cell types in co-culture models.
- Morphological Impact: Changes in spheroid size, structure, or integrity in response to treatment.
- Biomarker Modulation: Alterations in expression of molecular targets, pathway activation, or resistance mechanisms.
Normalization and Standardization Approaches
Meaningful interpretation of 3D screening data requires appropriate normalization to account for well-to-well variability in spheroid size and cellular content. Common approaches include:
- Size-based normalization: Adjusting readouts based on spheroid cross-sectional area or volume.
- DNA content normalization: Using Hoechst or similar DNA-binding dyes to quantify total cell number.
- Viability-based normalization: Expressing data relative to viability markers in the same spheroid.
- Reference compound calibration: Including known permeability and efficacy standards in each screening plate.
Future Directions and Emerging Technologies
The field of 3D spheroid screening continues to evolve rapidly, with several promising developments on the horizon. Patient-derived organoids are increasingly being incorporated into screening pipelines, offering genetically and phenotypically relevant models for personalized medicine approaches [48]. As one researcher notes, "Organoids are going to become a standard part of the pipeline, probably not for the first screening round, but for validation. That way you catch variability and resistance early, before spending years on a compound that won't translate" [48].
The integration of artificial intelligence and machine learning with high-content imaging data from 3D models represents another significant advancement. These tools enable automated pattern recognition and analysis of complex morphological changes that would be impractical to assess manually [48]. Looking further ahead, researchers anticipate the development of "organoid-on-chip systems that connect different tissues and barriers, so we can study drugs in a miniaturized 'human-like' environment" with AI-guided adaptive screening protocols [48].
Additionally, the continued exploration of GFP phylogenetic diversity may yield new engineered variants with properties optimized for specific 3D screening applications. The discovery and development of ancestral-sequence reconstructed FPs with enhanced stability and brightness exemplifies this potential [3].
The integration of 3D spheroid models with GFP-based reporting technologies represents a significant advancement in high-throughput drug screening, particularly for permeability assessment. These systems bridge critical gaps between conventional 2D cultures and in vivo physiology, providing more clinically predictive data on compound behavior while maintaining the scalability required for drug discovery pipelines. As these platforms continue to evolve through incorporation of patient-specific cells, microfluidic systems, and advanced imaging technologies, they promise to further enhance the efficiency and success rate of therapeutic development. The parallel exploration of GFP phylogenetic diversity and protein engineering continues to yield improved molecular tools that empower these sophisticated screening applications, highlighting the enduring impact of basic biological discovery on applied pharmaceutical research.
G protein-coupled receptors (GPCRs) represent the largest family of membrane-bound receptors in the human genome, facilitating cellular responses to diverse extracellular stimuli including hormones, neurotransmitters, and sensory signals. These seven-transmembrane domain proteins undergo precise conformational rearrangements upon ligand binding, transitioning from inactive (Ri) to active (Ra) states and subsequently engaging intracellular signaling partners. Understanding these dynamic structural changes is crucial for drug discovery, as a ligand's ability to stabilize specific receptor conformations directly determines its pharmacological efficacy and potential side effects [51].
The emergence of conformational biosensors has revolutionized our ability to directly monitor these structural transitions in real-time within living cells. These sophisticated molecular tools have revealed that GPCRs exist not as simple on/off switches, but as complex conformational ensembles where different ligands can stabilize distinct active states (Ra, Ra′, Ra″) with unique functional outcomes [51]. This paradigm shift has been particularly valuable for identifying biased agonists that preferentially activate therapeutic signaling pathways while avoiding those linked to adverse effects [52].
The development of these biosensors is intrinsically linked to the discovery and characterization of the Green Fluorescent Protein (GFP) family and its analogs across the animal kingdom. The phylogenetic distribution of GFP-like proteins, from cnidarians to cephalochordates, has provided researchers with a rich toolkit of naturally diverse fluorescent proteins with varying spectral properties, stability, and chromophore formation characteristics [17] [11] [53]. This evolutionary diversity has directly enabled the engineering of advanced biosensing platforms that illuminate the complex conformational dynamics of receptors in their native cellular environments.
GFP-like Proteins: Evolutionary Diversity Enabling Technological Innovation
The serendipitous discovery of GFP in the bioluminescent jellyfish Aequorea victoria marked the beginning of a revolution in biological imaging. Subsequent research has revealed that GFP-like proteins are distributed across diverse taxonomic groups, including cnidarians, copepods, and cephalochordates, with striking variations in spectral properties and potential biological functions [17] [11] [54].
Phylogenetic Distribution and Spectral Diversity
GFP-like proteins exhibit remarkable phylogenetic diversity across marine organisms:
- Cnidarians: The original source of GFP, this group exhibits proteins with green, yellow, red, and cyan fluorescence, as well as non-fluorescent chromoproteins [14].
- Copepods: Crustaceans in the Pontellidae family possess very bright green fluorescent proteins with rapid fluorescence development and high photostability, making them particularly valuable for biotechnology [54].
- Cephalochordates: Lancelets (Branchiostoma floridae and related species) possess the largest known repertoire of GFP-like proteins in a single organism, with at least 12 distinct genes identified through genomic analysis [11] [53].
Table 1: Diversity of GFP-like Proteins Across Taxonomic Groups
| Taxonomic Group | Representative Organisms | Spectral Characteristics | Key Features |
|---|---|---|---|
| Cnidarians | Aequorea victoria (jellyfish), corals | Green, red, yellow, cyan fluorescence | First discovered GFP; diverse color palette |
| Copepods | Pontella mimocerami | Bright green fluorescence | High brightness, rapid maturation, photostability |
| Cephalochordates | Branchiostoma floridae (lancelet) | Green and red fluorescence | Largest known repertoire in single organism |
The biological functions of these endogenous GFP-like proteins in their native organisms remain an active area of investigation, with proposed roles including photoprotection, prey attraction, antioxidant activity, and modulation of the internal light environment for symbiotic algae [14]. In corals of the genus Porites, for instance, GFP-like proteins display distinct spatial patterns (e.g., "star," "uniform," "tentacle tips") that may serve different adaptive functions and can reorganize under thermal stress, suggesting potential as biomarkers for environmental stress response [14].
From Natural Diversity to Biosensor Engineering
The evolutionary expansion and diversification of GFP-like proteins has provided researchers with an extensive palette of structural variants for biosensor engineering. Key advantages derived from this natural diversity include:
- Spectral Variability: Naturally occurring red-shifted fluorescent proteins from corals and other species enable multiplexed imaging and resonance energy transfer applications [17].
- Enhanced Brightness: Proteins from copepods such as Pontella mimocerami exhibit exceptionally high brightness (quantum yield × molar extinction coefficient), improving signal-to-noise ratios in live-cell imaging [54].
- Stability and Maturation Kinetics: Different GFP variants offer varying expression efficiency, maturation rates, and stability across temperature ranges, allowing selection of optimal characteristics for specific experimental needs.
The sequencing of the Branchiostoma floridae genome revealed that cephalochordates possess an unexpectedly large family of GFP-like proteins, suggesting both functional specialization and a history of lineage-specific gene duplications [53]. This natural expansion mirrors the protein engineering efforts in laboratory settings and provides insights into the structural tolerances and evolutionary constraints of the GFP β-barrel fold.
Biosensor Architectures for Monitoring Receptor Conformations
Conformational biosensors for GPCRs can be categorized into three primary architectural classes based on their design principles and detection mechanisms. Each offers distinct advantages for probing specific aspects of receptor dynamics and signaling.
Resonance Energy Transfer (RET)-Based Biosensors
RET-based biosensors exploit distance-dependent energy transfer between donor and acceptor molecules to report on conformational changes in real-time. The two primary implementations are:
- FRET (Förster/Fluorescence Resonance Energy Transfer): Uses a pair of fluorescent proteins (e.g., CFP/YFP) as donor and acceptor [52].
- BRET (Bioluminescence Resonance Energy Transfer): Utilizes a luciferase (e.g., Nluc, Rluc) as donor and a fluorescent protein as acceptor [55] [56].
These biosensors typically position donor and acceptor molecules at strategic locations within the GPCR structure—commonly at the intracellular loop 3 (ICL3) and C-terminus—to detect the outward movement of transmembrane helix 6 (TM6) and the separation between ICL3 and the receptor's C-terminal tail that characterizes activation [55] [52].
Table 2: Comparison of RET-Based Biosensor Platforms
| Biosensor Type | Donor | Acceptor | Advantages | Limitations |
|---|---|---|---|---|
| FRET | CFP, GFP | YFP, RFP | Ratiometric measurement, no substrate required | Photobleaching, autofluorescence |
| BRET | Nluc, Rluc | YFP, GFP10 | No photobleaching, lower background, multiplexing capability | Requires luciferase substrate |
| ebBRET | Rluc | rGFP | Enhanced energy transfer, improved dynamic range | Specific donor-acceptor pairing |
A notable example is the NY-β2AR biosensor, which incorporates Nluc in ICL3 and YFP at the C-terminus. This configuration demonstrated a concentration-dependent decrease in BRET signal upon activation with the full agonist isoproterenol, consistent with increased distance between the labeled domains during receptor activation. Importantly, this biosensor could distinguish between full agonists, partial agonists, and inverse agonists based on the magnitude of BRET change, reflecting their differing abilities to stabilize active receptor conformations [55].
Nanobody-Based Conformational Biosensors
Nanobodies—single-domain antibodies derived from camelids—have emerged as powerful tools for stabilizing and detecting specific GPCR conformations. Their compact size, high stability, and specificity make them ideal for recognizing distinct receptor states [51].
Nanobody-based biosensors function through several mechanisms:
- Conformation-Selective Binding: Nanobodies can be selected to recognize and stabilize specific active or inactive states of GPCRs [51].
- RET Integration: When fused to fluorescent proteins or luciferases, nanobodies can report on receptor occupancy and conformational changes through changes in RET signals [52].
- Crystallization Chaperones: Nanobodies facilitate structural studies by stabilizing transient receptor conformations for crystallography or cryo-EM [51].
These biosensors are particularly valuable for detecting low-population receptor states that are difficult to capture with other methods, and for identifying ligands that stabilize therapeutically desirable conformations [51].
Transducer-Based Biosensors
Transducer-based biosensors utilize engineered components of GPCR signaling pathways—such as mini-G proteins or truncated β-arrestin variants—to report on receptor activation through conformational changes in these downstream effectors [51] [52]. These biosensors detect the engagement of specific signaling partners, providing direct insight into the functional consequences of receptor activation and enabling the identification of biased ligands that preferentially activate certain pathways.
Experimental Protocols and Methodologies
BRET-Based Conformational Biosensor Assay for GPCR Activation
This protocol details the implementation of a BRET-based biosensor to monitor ligand-induced conformational changes in GPCRs, based on the design described by [55].
Reagents and Materials:
- cDNA constructs of BRET-labeled GPCR (e.g., NY-β2AR with Nluc in ICL3 and YFP at C-terminus)
- HEK293 or appropriate cell line for GPCR expression
- Coelenterazine 400a (Coel400a) substrate for Nluc
- Ligands of interest (agonist, antagonist, etc.)
- White-walled 96- or 384-well plates
- Plate reader capable of sequential filter-based BRET detection
Procedure:
- Cell Culture and Transfection: Plate HEK293 cells at appropriate density (e.g., 50,000 cells/well in 96-well format) and transfect with BRET-labeled GPCR construct using preferred transfection method.
- Expression Optimization: Culture transfected cells for 24-48 hours to allow receptor expression, optimizing for minimal constitutive activity while maintaining adequate signal.
- Ligand Stimulation: Prepare serial dilutions of test ligands in assay buffer. Remove culture medium from cells and replace with ligand solutions. Incubate for appropriate time (typically 5-30 minutes) at 37°C.
- BRET Measurement: Add Coel400a substrate to final concentration of 5µM. Immediately measure luminescence/fluorescence using sequential filters:
- Donor emission: 370-450 nm (Nluc signal)
- Acceptor emission: 500-550 nm (YFP signal)
- Data Analysis: Calculate BRET ratio as (acceptor emission)/(donor emission). Normalize data to baseline (unstimulated) and maximal response (full agonist) conditions. Plot concentration-response curves to determine ligand potency (EC50) and efficacy (maximal BRET change).
Technical Considerations:
- Include control conditions with known agonists/antagonists to validate biosensor response.
- Optimize receptor expression levels to avoid signal saturation or non-specific interactions.
- For multiplexing with other BRET assays, select orthologous donor-acceptor pairs with minimal spectral overlap [55] [56].
Validation of Biosensor Functionality
To ensure that the engineered biosensors accurately report native receptor pharmacology, comprehensive validation is essential:
- Downstream Signaling Correlations: Compare biosensor responses with established signaling readouts (e.g., cAMP accumulation, ERK phosphorylation) for reference ligands [55].
- Ligand Pharmacology Verification: Confirm that known agonists, antagonists, and inverse agonists produce expected responses in the biosensor assay [51] [55].
- Expression Level Assessment: Quantify receptor expression levels to ensure they remain within physiological ranges and avoid artifacts from overexpression [55].
- Kinetic Profiling: Perform time-course experiments to establish appropriate measurement windows that capture steady-state responses [56].
The Scientist's Toolkit: Essential Research Reagents
Table 3: Key Research Reagent Solutions for GPCR Conformational Studies
| Reagent Category | Specific Examples | Function/Application | Key Characteristics |
|---|---|---|---|
| Fluorescent Proteins | GFP, YFP, CFP, RFP variants | RET acceptors, direct fluorescence reporting | Various spectral properties, brightness, stability |
| Luciferases | Nluc, Rluc, RlucII | BRET donors | High brightness, substrate specificity, stability |
| Nanobodies | Nb80 (β2AR-active state) | Stabilize specific conformations, detection tools | High specificity, small size, modular |
| Engineered Transducers | mini-Gs, mini-Gi | Report specific G protein coupling | Minimal structural elements for specific coupling |
| Luciferase Substrates | Coelenterazine 400a, EnduRen | BRET donor excitation | Solubility, stability, emission spectra |
| Specialized Cell Lines | HEK293T, CHO-K1 | Heterologous GPCR expression | Low background signaling, high transfection efficiency |
Applications in Drug Discovery and Development
Conformational biosensors have transformed GPCR drug discovery by enabling direct detection of ligand efficacy and mechanism of action at the level of receptor structure. Key applications include:
High-Throughput Screening (HTS): Conformational biosensors are increasingly adapted for HTS campaigns to identify novel chemotypes based on their ability to stabilize therapeutically relevant receptor states [51]. Their ability to detect both orthosteric and allosteric ligands in a single assay represents a significant advantage over functional assays that may miss certain modulator classes.
Biased Agonism Profiling: By multiplexing multiple biosensors that report on different signaling endpoints, researchers can comprehensively characterize ligand bias profiles early in drug development [52] [56]. This approach facilitates the intentional design of drugs that selectively activate therapeutic pathways while minimizing adverse effects.
Allosteric Modulator Characterization: Conformational biosensors can detect the subtle structural changes induced by allosteric modulators that may not produce efficacy on their own but fine-tune receptor responses to orthosteric ligands [51].
Mechanistic Pharmacology Studies: These biosensors provide insights into the molecular mechanisms underlying pathway selectivity, receptor dimerization, and spatial-temporal regulation of GPCR signaling in different cellular compartments [52].
Visualization of GPCR Biosensor Mechanisms and Workflows
GPCR Conformational Biosensor Mechanisms: This diagram illustrates the working principle of BRET-based GPCR conformational biosensors. In the inactive state (top), the close proximity between donor and acceptor molecules results in high BRET efficiency. Ligand binding induces receptor activation and structural rearrangement, particularly the outward movement of transmembrane helix 6, increasing the distance between donor and acceptor and resulting in decreased BRET signal (bottom) [55] [52].
GPCR Biosensor Experimental Workflow: This workflow outlines the key steps in implementing GPCR conformational biosensors, from initial design considerations through data analysis and validation. The process begins with selection of appropriate biosensor architecture, followed by cellular expression, ligand stimulation, signal detection, and pharmacological validation [51] [55] [52].
The development of conformational biosensors for tracking GPCR dynamics represents a convergence of evolutionary biology, protein engineering, and pharmacological research. The phylogenetic distribution of GFP-like proteins across diverse organisms has provided an invaluable resource of structural templates with naturally optimized properties for biosensor construction. As these tools continue to evolve, several promising directions emerge:
Enhanced Multiplexing Capabilities: Future biosensor platforms will likely enable simultaneous monitoring of multiple receptor conformations and signaling events within single cells, providing unprecedented insight into the complexity of GPCR signaling networks [52] [56].
Structural Insights Driving Design: Increasingly detailed structural information from cryo-EM and crystallography studies will inform more sophisticated biosensor designs that probe specific microdomains and allosteric networks within receptors [51] [57].
Native Tissue and In Vivo Applications: As biosensor brightness, specificity, and delivery methods improve, applications will expand from cell lines to native tissue environments and ultimately to in vivo models, revealing receptor dynamics in physiological and pathological contexts [52].
The integration of conformational biosensors into drug discovery pipelines represents a paradigm shift from indirect functional measurements to direct observation of receptor states, accelerating the identification and optimization of therapeutics with precise efficacy profiles. As these technologies mature, they will continue to illuminate the dynamic structural landscape of GPCRs and other receptor families, bridging the gap between molecular structure and physiological function.
The phylogenetic distribution of Green Fluorescent Protein (GFP) analogs and their engineered derivatives is central to the advancement of multiplexed experimental readouts. These proteins are not only vital biological markers but also form the core toolkit for modern flow cytometry and multicolor imaging. Fluorescent proteins are widely distributed across species, from Cnidarians like jellyfish and corals to Cephalochordates like amphioxus, which possesses the largest known family of GFP-like proteins [14] [38]. This evolutionary diversity has been leveraged through ancestral sequence reconstruction to develop exceptionally stable variants, such as QuetzalFP and hyperfolder YFP (hfYFP), which exhibit remarkable resistance to chemical denaturation and are ideal for advanced applications [3] [58]. The functional diversification of these proteins—encompassing variations in emission spectra, brightness, and stability—provides the foundational palette for simultaneously tracking multiple cellular parameters. Techniques such as multicolor flow cytometry and imaging flow cytometry (IFC) exploit this palette, allowing researchers to conduct rapid, multiparametric analysis of heterogeneous cell populations on a cell-by-cell basis, at speeds of up to 10,000 cells per second [59] [60]. This technical guide outlines the core principles, strategic panel design, and advanced methodologies that enable effective multiplexing within life science research and drug development.
Core Principles of Multiplexed Analysis
Fundamental Technologies
Multiplexed analysis relies on two primary technological platforms: flow cytometry and multicolor imaging. Though often used complementarily, their underlying principles and applications have distinct focuses.
- Flow Cytometry: This is a fluorescence-based assay that measures multiple characteristics, such as population counts and protein abundance, from individual cells in a suspension [60]. The instrument, a flow cytometer, functions by directing a single stream of cells past a laser beam. As each cell passes through the beam, it scatters light and may emit fluorescent light if it has been labeled with fluorescent markers. The optics and electronics systems then detect and convert these light signals into quantitative data for each cell [59]. A key advantage is its ability to analyze thousands of cells per second, providing high-throughput statistical data on cellular heterogeneity [60].
- Imaging Flow Cytometry (IFC): IFC combines the high-throughput, multiparametric capabilities of conventional flow cytometry with morphological analysis from digital microscopy [61]. It captures multichannel images of individual cells as they flow past the detection system, simultaneously gathering fluorescent and morphological information from thousands of single cells [61]. This makes IFC indispensable for applications like cell profiling, identifying rare cells, and analyzing complex cell phenotypes.
The Role of Fluorescence in Multiplexing
Fluorescence enables the simultaneous detection of multiple parameters. Key components include:
- Fluorochromes: These are fluorescent dyes that can be excited by a laser to emit light of a specific, longer wavelength [59]. They are typically conjugated to antibodies that bind to specific cellular antigens. When a cell bound by a fluorochrome-tagged antibody passes through the laser, it emits a fluorescent signal, allowing for the detection and quantification of that antigen [59].
- Fluorescent Proteins (FPs): Naturally occurring and engineered FPs, such as GFP and RFP, are encoded genetically and expressed within cells [14]. They serve diverse functional roles in nature, including photoprotection and prey capture in corals [14]. Their spectral diversity is a direct result of evolutionary processes; for instance, the genus Porites exhibits multiple fluorescence patterns (e.g., star, uniform, tentacle tips), which may be linked to adaptive functions [14]. In the laboratory, this natural diversity has been expanded through protein engineering to create a broad palette of FPs with distinct emission colors and enhanced properties, such as the chemically stable hfYFP [58].
The fundamental principle of multiplexing is that cells of different types express different combinations of antigens. If each antibody is linked to a distinct fluorochrome, the various cell types can be distinguished based on their unique combination of emitted colors as they pass through the flow cytometer [59].
Strategic Panel Design for Multiplexing
Foundational Concepts and Challenges
Designing a multicolor panel is a critical and complex step that requires careful planning to ensure reliable, reproducible data. The core challenge lies in spectral overlap—the phenomenon where the emission spectrum of one fluorochrome spills into the detection channel of another [62]. This spillover can lead to inaccurate data interpretation if not properly corrected through compensation, a mathematical process that corrects for this spectral overlap [63] [62]. Other challenges include the need to match antigen density with fluorochrome brightness and to account for potential dye interactions [62].
A Step-by-Step Guide to Panel Building
A robust multicolor panel is built through a systematic process:
- Define Biological Question and Antigens: Begin by identifying the cell populations and antigens of interest, informed by the biological question and literature review [63]. Develop a preliminary gating strategy to understand the relationships between antigens and define the major and sub-populations of interest [63].
- Understand Instrument Configuration: Confirm the specific lasers and optical filters available on the flow cytometer to be used, as this dictates which fluorochromes can be detected [62].
- Select and Match Fluorochromes to Antigens: This is the most crucial strategic step.
- Tier Antigens by Expression Level: Classify antigens as low, medium, or high density [63].
- Match Brightness to Expression: Pair the brightest fluorochromes with the most dimly expressed antigens, and vice versa. This ensures clear resolution of all populations [62].
- Avoid Co-expression of Spectrally Overlapping Fluorochromes: If two antigens are expressed on the same cell population, ensure their associated fluorochromes have minimal spectral overlap to simplify compensation [63].
- Utilize Online Tools: Use spectral viewers to examine and minimize spectral overlap during the design phase [59] [62].
- Titrate and Validate Antibodies: Optimize the concentration of every antibody to achieve the best signal-to-noise ratio [62]. Always include appropriate controls, such as unstained cells and compensation controls, for accurate data interpretation [62].
- Test the Full Panel: Finally, stain cells with the complete panel and evaluate its performance, making adjustments as necessary [62].
Table 1: Key Considerations for Fluorochrome Selection
| Consideration | Description | Strategic Implication |
|---|---|---|
| Relative Brightness | Intrinsic signal intensity of the fluorochrome [59]. | Bright dyes for low-abundance antigens; dim dyes for high-abundance antigens [62]. |
| Antigen Density | Abundance of the target molecule on the cell surface [63]. | Determines the required fluorochrome brightness for clear resolution. |
| Spectral Overlap | Spillover of a fluorochrome's emission into detectors for other dyes [62]. | Requires compensation; can be minimized through careful panel design and spectral viewers [63]. |
| Tandem Dyes | Dyes that rely on FRET (e.g., PE-Cy7), offering more laser/color options [62]. | Can be sensitive to fixation and degradation; require validation and fresh preps [62]. |
The following workflow summarizes the key decision points in the panel design process:
Advanced Methodologies and Workflows
Spectral Flow Cytometry
Spectral flow cytometry represents a significant evolution from conventional cytometry. Instead of using a set of optical filters to direct narrow bands of light to individual detectors, spectral cytometers capture the full emission spectrum of every fluorochrome across all detectors [63]. Advanced algorithms then "unmix" the composite signal from each cell to determine the contribution of each individual fluorochrome [63]. This methodology offers two major advantages: it dramatically increases the number of parameters that can be measured simultaneously by resolving highly overlapping fluorochromes, and it simplifies the panel design process by reducing the reliance on meticulous compensation setup [59] [63].
Multi-Pass and Barcoding Flow Cytometry
A groundbreaking approach to high-dimensional analysis is multi-pass flow cytometry, which uses spectrally encoded cellular barcoding. In this method, individual cells are tagged with a unique combination of near-infrared laser-emitting microparticles (LPs), creating a unique optical barcode for each cell [64]. These barcoded cells can then be measured, collected, and then re-stained with a new set of antibodies for a subsequent cycle of measurement. The unique barcode is used to align the data from the same cell across multiple measurement cycles [64]. This "multi-pass" strategy allows for the analysis of a very high number of markers (e.g., 32 markers over 3 cycles) while using a limited number of fluorochromes per cycle, thereby minimizing spectral spillover and simplifying panel design [64].
Channel Importance Analysis in Imaging Flow Cytometry
For imaging flow cytometry, determining the most informative fluorescent channels is crucial for optimizing complex and costly staining panels. The PXPermute method has been developed to address this need. It is a model-agnostic, post-hoc interpretability method that assesses channel importance by randomly shuffling pixel values within a specific channel of an input image and quantifying the resulting impact on the performance of a trained machine learning model [61]. A significant drop in model performance after permuting a channel indicates its high importance for the classification task. This method accurately identifies the most and least informative channels, enabling biologists to streamline workflows, reduce costs by eliminating unnecessary stains, and optimize experimental designs, with results that align well with established biological knowledge [61].
The following diagram illustrates the conceptual workflow of the multi-pass flow cytometry process:
The Scientist's Toolkit: Essential Research Reagents and Materials
Successful execution of multiplexed experiments requires a suite of validated reagents and materials. The table below details key components for a typical flow cytometry or imaging experiment.
Table 2: Essential Research Reagent Solutions for Multiplexed Readouts
| Reagent/Material | Function | Key Considerations |
|---|---|---|
| Monoclonal/Recombinant Antibodies | Highly specific detection of target antigens by binding to a single epitope [63]. | Preferred over polyclonals for reduced cross-reactivity; recombinant antibodies lack Fc region, minimizing non-specific binding [63]. |
| Fluorochrome-Conjugated Antibodies | Antibodies linked to a fluorescent dye for detection [59]. | Must be validated for specificity and application; conjugation should be bright and stable [63]. |
| Viability Dye | Distinguishes live cells from dead cells based on membrane integrity [60]. | Critical for excluding dead cells from analysis, as they can bind antibodies non-specifically [62]. |
| Cell Staining Buffer | Medium for antibody incubation and cell washing. | Often contains protein (e.g., BSA) to block non-specific binding and preserve cell viability. |
| Fixation and Permeabilization Reagents | Chemicals that preserve cell structure and allow antibodies to access intracellular targets [60]. | Required for intracellular flow cytometry (e.g., phospho-flow); can affect FP fluorescence and antigenicity [60] [58]. |
| Stable Fluorescent Proteins (e.g., hfYFP, mGL) | Genetically encoded fluorescent tags for tracking protein localization or gene expression [58]. | Essential for live-cell imaging and sorting; stability under fixation (e.g., for ExM, CLEM) is a key parameter [58]. |
| Compensation Beads | Uniform particles that bind antibodies, used to create single-color controls for compensation [62]. | Necessary for accurately calculating spillover in conventional flow cytometry. |
| Laser Particles (LPs) | Spectrally unique microparticles for cellular barcoding in multi-pass cytometry [64]. | Enable tracking of the same cell across multiple measurement cycles for very high-parameter analysis [64]. |
Experimental Protocols for Key Applications
Protocol 1: Basic Multicolor Immunophenotyping of Surface Antigens
This protocol is designed for the identification and quantification of different cell types in a heterogeneous sample, such as human peripheral blood mononuclear cells (PBMCs) [60].
- Sample Preparation: Create a single-cell suspension. For blood, use density gradient centrifugation or RBC lysis buffer. Filter the suspension through a nylon mesh to remove aggregates [63].
- Cell Counting and Viability Assessment: Determine cell concentration and viability.
- Antibody Staining:
- Aliquot the required number of cells (e.g., 1x10^6) into a tube.
- Wash cells with staining buffer by centrifugation.
- Resuspend the cell pellet in a master mix containing titrated, fluorochrome-conjugated antibodies against surface markers (e.g., CD3, CD4, CD8 for T cells) and a viability dye [60].
- Incubate for 20-30 minutes in the dark at 4°C.
- Wash cells twice with staining buffer to remove unbound antibody.
- Fixation (Optional): If the sample cannot be acquired immediately, fix cells with a 1-4% formaldehyde solution.
- Data Acquisition: Resuspend cells in an appropriate buffer and acquire data on a flow cytometer. Include single-stained controls for compensation.
- Data Analysis: Use flow cytometry software to gate on single, live cells and then identify cell populations based on their fluorescent signatures [60].
Protocol 2: Intracellular Phospho-Flow Cytometry
This protocol allows for the analysis of intracellular signaling events, such as protein phosphorylation, at a single-cell level [60].
- Stimulation: Treat cells with the stimulus of interest (e.g., a cytokine) for a defined period.
- Fixation: Rapidly halt the cellular processes and preserve phosphorylation states by adding a fixative (e.g., formaldehyde) directly to the culture medium.
- Permeabilization: Centrifuge the fixed cells, resuspend in a cold, alcohol-based permeabilization buffer (e.g., methanol or commercial detergents), and incubate to allow antibodies to access the intracellular space.
- Intracellular Staining:
- Wash cells to remove permeabilization buffer.
- Resuspend the cell pellet in a master mix containing antibodies against surface markers (for immunophenotyping) and phospho-specific antibodies (e.g., anti-pStat6) [60].
- Incubate, wash, and acquire data as in the surface staining protocol.
- Data Analysis: Gate on specific cell populations using surface markers and then analyze the median fluorescence intensity of the phospho-protein signal within those populations to quantify signaling activity.
Protocol 3: Channel Importance Assessment with PXPermute
This methodology is used to rank the importance of different fluorescent channels in an IFC dataset for a specific classification task [61].
- Model Training: Train a supervised multiclass classifier (e.g., a ResNet18 model adapted for the number of channels in the dataset) on the multichannel IFC images to predict cell labels.
- Pixel Permutation: During the test phase, systematically iterate through each channel. For a given channel, randomly shuffle the pixel values within that channel for every input image in the test set.
- Performance Evaluation: For each permuted channel, evaluate the performance of the trained classifier using a chosen metric (e.g., accuracy or F1-score).
- Importance Calculation: Calculate the channel importance as the difference between the original model performance (with no channels permuted) and the performance when that specific channel is permuted. A larger performance drop indicates a more important channel.
- Aggregation and Ranking: Aggregate these importance values (e.g., using the median) across all classes and images to produce a final ranking of channel importance [61].
Navigating Experimental Pitfalls: Cytotoxicity, Immunogenicity, and Technical Challenges
Understanding and Mitigating GFP-Specific Cytotoxic and Immunogenic Responses
The discovery of Green Fluorescent Protein (GFP) has revolutionized biological imaging, enabling researchers to track gene expression, protein localization, and cell fate in real-time. Within phylogenetic studies of GFP analogs, the protein serves as a crucial model system for understanding evolutionary relationships and functional diversification across species [65]. However, the widespread application of GFP, particularly in immunocompetent in vivo systems, is complicated by its intrinsic immunogenic and cytotoxic properties, which can significantly confound experimental outcomes [66] [67]. These responses lead to the selective elimination of GFP-expressing cells, distorting data interpretation in long-term tracking studies and metastasis research [66] [67]. This technical guide delineates the mechanisms underlying these adverse responses and provides evidence-based strategies to mitigate them, ensuring the reliability of findings within phylogenetic and translational research contexts.
Mechanisms of GFP Immunogenicity
T-Cell Mediated Immune Recognition
The primary immunogenic response to GFP is facilitated through T-cell mediated immunity. As an intracellular antigen, GFP is processed by host cells and presented on the cell surface via major histocompatibility complex (MHC) class I molecules. This presentation enables recognition and activation of cytotoxic T-lymphocytes (CTLs), which subsequently target and lyse GFP-expressing cells [66] [68]. The critical role of T-cells is highlighted by experiments in immunocompetent (BALB/c) versus T-cell deficient (Nu/Nu) mice. While intravenously injected eGFP-expressing leukemia cells failed to cause mortality in immunocompetent mice, they were lethal in Nu/Nu mice, underscoring the T-cell dependent nature of this immunogenic clearance [66].
Table 1: Evidence for T-Cell Mediated GFP Immunogenicity
| Experimental Context | Key Finding | Citation |
|---|---|---|
| Leukemia cells in BALB/c vs. Nu/Nu mice | GFP-expressing cells rejected in immunocompetent mice; no rejection in T-cell deficient mice | [66] |
| Autologous CD34+ cell transplant in macaques | Induced significant CD8+ T-cell reaction and cell lysis | [66] |
| Hepatocyte transplantation in rats | GFP-positive cells attracted CD4+/CD8+ inflammatory infiltrates; rapid cell loss | [66] |
| Human dendritic cell studies | Generation of specific CD4+ and CD8+ T-cell clones against GFP | [68] |
Factors Influencing Immunogenic Potency
The intensity of the immune response against GFP is not absolute but is modulated by several critical factors:
- Genetic Background of Host: The mouse strain significantly impacts the immune response. For instance, enhanced GFP (eGFP) is highly immunogenic in BALB/c mice but only slightly immunogenic in C57BL/6 mice [66] [69].
- Route of Administration: The immunization route dictates whether an immune response is mounted. Subcutaneous administration of GFP-expressing lymphoma cells in C57BL/6 mice led to tumor rejection, whereas intravenous administration of the same cells did not [66].
- Antigen Presentation Context: Expression of GFP in professional antigen-presenting cells, such as dendritic cells, markedly enhances its immunogenicity and can even function as an adjuvant for other co-expressed antigens [68].
Figure 1: GFP Immunogenicity Pathway. This diagram illustrates the T-cell mediated immune response leading to the clearance of GFP-expressing cells.
Mechanisms of GFP Cytotoxicity
Beyond adaptive immunogenicity, GFP can induce direct cellular toxicity through multiple, non-mutually exclusive pathways.
- Oxidative Stress and Apoptosis: GFP expression can lead to the generation of reactive oxygen species (ROS), which promotes oxidative stress and can trigger apoptotic pathways, leading to programmed cell death [66].
- Ku80-Dependent DNA Damage Response: A pivotal mechanism of GFP cytotoxicity involves the DNA repair protein Ku80. Research shows that EGFP inhibits proliferation and induces cell death in Ku80-deficient hamster cells (xrs-6 cells). This cytotoxicity is attenuated by the presence of Ku80, which appears to function in a novel non-homologous end joining (NHEJ)-independent defense mechanism. Notably, no such cytotoxicity is observed in cells deficient for XRCC4, another core NHEJ protein, highlighting the specific role of Ku80 [70].
- Organ-Specific Cytotoxicity: Evidence points to cell-type-specific toxic effects, including actin-myosin dysfunction in muscle cells and neurodegeneration [66].
Table 2: Documented Mechanisms of GFP Cytotoxicity
| Mechanism | Experimental Evidence | Citation |
|---|---|---|
| Ku80-Mediated Defense | EGFP-induced cytotoxicity in Ku80-deficient (xrs-6) cells; attenuated by Ku80 reconstitution. No effect in XRCC4-deficient cells. | [70] |
| Oxidative Stress | GFP expression linked to generation of reactive oxygen species (ROS). | [66] |
| Apoptosis Induction | GFP expression associated with initiation of apoptotic pathways. | [66] |
| Functional Impairment | Documented actin-myosin dysfunction in muscle cells; neurodegeneration. | [66] |
Experimental Mitigation Strategies
Immunosuppression and Tolerance Induction
A direct approach to mitigating GFP immunogenicity is the use of immunosuppressive drugs or the induction of immune tolerance.
- Pharmacologic Immunosuppression: Treatment with T-cell inhibitors such as Cyclosporine and Tacrolimus has proven effective. In canine models, cyclosporine administration resulted in stable GFP expression for over 800 days following hematopoietic stem cell transplantation [66]. These drugs function by inhibiting calcineurin, preventing NFAT translocation to the nucleus, and thereby blocking IL-2 production and T-cell activation [66].
- Central Tolerance: A groundbreaking strategy involves engineering immunocompetent mouse models that are centrally tolerized to GFP. This is achieved by expressing GFP in the thymus under a tissue-specific promoter (e.g., in monocytes, NK cells, and dendritic cells in Cx3cr1-GFP mice). In these models, T-cells that recognize GFP as "self" are deleted during their development, which permits normal metastatic outgrowth of GFP-expressing tumor cells, unlike in wild-type immunocompetent mice [67].
Alternative Reporter Systems
Selecting less immunogenic reporters is a fundamental strategy.
- Click Beetle Green Luciferase (CBG): Comparative studies show that while tumor cells expressing red-shifted firefly luciferase (RLuc) are completely rejected in immunocompetent C57BL/6 mice, cells expressing CBG exhibit normal in vivo tumor growth without eliciting a significant T-cell response or altering the tumor-immune microenvironment [69].
- Engineered and Ancestral FPs: The field is advancing with protein engineering approaches. Ancestral Sequence Reconstruction (ASR) has been used to create ancestral-like FPs, such as QuetzalFP, which demonstrate outstanding photoluminescence quantum yields (up to 90%) and enhanced stability in polymer coatings, making them promising candidates for applications requiring robust performance [3].
Methodological Optimizations
Simple adjustments to experimental design can reduce unwanted immune responses.
- Utilize Low-Responder Strains: When using mouse models, selecting strains with lower immunogenic responses to GFP, such as C57BL/6, can be beneficial [66].
- Employ GFP-Transgenic Donors: Using cells derived from GFP-transgenic animals, where the immune system has developed tolerance to GFP, results in more effective engraftment and longer persistence compared to cells transduced with GFP in vitro [66].
Figure 2: GFP Mitigation Strategy Map. A visual overview of the main strategic approaches to overcome GFP-specific responses.
The Scientist's Toolkit: Key Research Reagents
Table 3: Essential Reagents for Investigating GFP-Specific Responses
| Reagent / Model | Function/Application | Key Finding/Use |
|---|---|---|
| Cx3cr1-GFP;CCR2-RFP Mouse | Model for central tolerance to GFP. | Allows metastatic outgrowth of GFP+ tumors by preventing CD8+ T-cell response [67]. |
| Ku80-deficient cell line (xrs-6) | Model for studying GFP cytotoxicity. | Demonstrates Ku80's critical role in defense against GFP-induced cytotoxicity [70]. |
| Click Beetle Green Luciferase (CBG) | Non-immunogenic bioluminescence reporter. | Enables tumor tracking in immunocompetent mice without altering growth or immune context [69]. |
| Cyclosporine / Tacrolimus | T-cell specific immunosuppressants. | Inhibit calcineurin/NFAT pathway, stabilizing GFP+ cell survival in vivo [66]. |
| QuetzalFP | Ancestral-like FP from ASR. | Offers high brightness (90% QY) and stability for demanding applications [3]. |
Detailed Experimental Protocol: Assessing Cytotoxicity via Ku80
Objective: To evaluate the role of Ku80 in attenuating EGFP-induced cytotoxicity using isogenic cell lines differing in Ku80 status.
Cell Lines:
Methods:
- Stable Transduction: Transduce all cell lines with a lentiviral or retroviral vector constitutively expressing enhanced GFP (EGFP). Include a mock-transduced control.
- In Vitro Proliferation Assay:
- Seed equal numbers of EGFP-expressing and control cells.
- Count cells using a hemocytometer or automated cell counter every 24 hours for 5-7 days.
- Plot growth curves to assess EGFP-induced inhibition of proliferation.
- Clonogenic Survival Assay:
- Seed a low density of cells in multi-well plates and allow them to grow for 7-14 days to form colonies.
- Fix and stain colonies with crystal violet.
- Count colonies containing >50 cells. The plating efficiency and surviving fraction of EGFP-expressing cells are calculated relative to the mock-transduced control.
- Cell Death Analysis:
- Use flow cytometry with Annexin V and Propidium Iodide (PI) staining to quantify apoptotic and necrotic cell populations within the EGFP-positive gate.
- Combination with X-ray:
- Expose EGFP-expressing and control xrs-6 cells to increasing doses of X-ray radiation (e.g., 0, 2, 4, 6 Gy).
- Perform clonogenic survival assays as above to assess how EGFP expression enhances cellular sensitivity to DNA-damaging agents [70].
Expected Results: EGFP should significantly inhibit proliferation, reduce clonogenic survival, and induce cell death in Ku80-deficient xrs-6 cells, but these effects should be markedly attenuated in Ku80-reconstituted cells. No significant EGFP-induced cytotoxicity is expected in XRCC4-deficient XR-1 cells, confirming the NHEJ-independent mechanism.
The immunogenic and cytotoxic properties of Green Fluorescent Protein present significant but surmountable challenges in biological research. A comprehensive understanding of the underlying mechanisms—MHC class I-restricted T-cell activation and Ku80-dependent cytoprotection—is essential for designing robust experiments. By strategically employing immunosuppression, tolerance induction, alternative reporters like click beetle luciferase, and novel proteins such as QuetzalFP, researchers can effectively mitigate these confounding responses. As the field of phylogenetic analysis of FPs advances, these strategies will be paramount in ensuring that the powerful tool of fluorescence imaging yields accurate and physiologically relevant data.
The phylogenetic diversity of Green Fluorescent Protein (GFP) analogs, spanning from Aequorea victoria to reef Anthozoa, has provided researchers with a versatile palette of fluorescent tools for visualizing dynamic biological processes [17]. However, a fundamental challenge inherent to all fluorescent proteins (FPs) is their requirement for a post-translational maturation step to become fluorescent. This maturation process, which involves cyclization, oxidation, and dehydration of the internal chromophore, occurs with finite and variable kinetics that can significantly distort the interpretation of experimental data [71] [72]. For studies investigating the dynamics of concentration profiles, such as morphogen gradients in developing tissues, failing to account for these maturation delays can lead to incorrect conclusions about protein distribution and kinetics [71]. This technical guide provides a comprehensive analytical framework for accurately quantifying gradient formation by explicitly incorporating FP maturation kinetics, thereby enabling researchers to extract biologically accurate parameters from fluorescence data within the context of broader phylogenetic research on GFP analogs.
The Maturation Kinetics of Diverse Fluorescent Proteins
Systematic Characterization of Maturation Times
Maturation kinetics are not uniform across the GFP protein family; they vary considerably depending on the specific FP variant, host organism, and environmental conditions. A systematic characterization of 50 FPs in Escherichia coli revealed a remarkable diversity in maturation half-times (t~50~), ranging from as little as 4.1 minutes for the fast-maturing mGFPmut3 to over 150 minutes for slower proteins like T-Sapphire at 37°C [73]. Notably, maturation does not always follow simple first-order kinetics. While some variants like mEGFP exhibit classic single-exponential maturation, others like mGFPmut2 follow biphasic kinetics, and wild-type GFP displays complex, progressively accelerating maturation profiles [73]. This kinetic diversity underscores the necessity for protein-specific characterization.
Table 1: Maturation Times of Common Fluorescent Protein Variants at 37°C [73]
| Fluorescent Protein | Class/Color | t~50~ (minutes) | t~90~ (minutes) | Maturation Kinetics Type |
|---|---|---|---|---|
| mGFPmut3 | Green | 4.1 ± 0.3 | 15.8 ± 3.1 | Single Exponential |
| mVenus NB | Yellow-Green | 4.1 ± 0.3 | 18.4 ± 6.8 | Not Specified |
| mEGFP | Green | 14.5 ± 1.0 | 42.4 ± 4.4 | Single Exponential |
| mCherry | Red | 21.9 ± 1.1 | 51.4 ± 4.0 | Not Specified |
| sfGFP | Green | 13.6 ± 0.9 | 39.1 ± 4.7 | Not Specified |
| Clover | Yellow-Green | 22.2 ± 1.4 | 61.6 ± 6.8 | Not Specified |
| mCerulean | Cyan | 6.6 ± 0.5 | 24.0 ± 2.9 | Not Specified |
| wtGFP | Green | 36.1 ± 2.1 | 83.8 ± 4.9 | Complex |
| TagRFP | Orange-Red | 42.1 ± 2.6 | 102.8 ± 7.8 | Not Specified |
| T-Sapphire | Green (UV-Excitable) | 156.5 ± 11.2 | 478.2 ± 57.2 | Not Specified |
Environmental and Strain-Dependent Effects on Maturation
Maturation kinetics are highly sensitive to external factors. Temperature has a pronounced effect, with maturation times typically increasing as temperature decreases [73]. Furthermore, significant variation in maturation times can occur even among closely related bacterial strains, emphasizing that maturation is not solely an intrinsic property of the FP but is also influenced by the host cell's physiological state and metabolism [74]. For instance, in a model system of colicinogenic E. coli strains, the GFP maturation time in the toxin-producing C strain was 1.4 times longer than in related S and R strains under specific growth conditions [74]. These findings highlight the importance of empirically determining maturation parameters within the specific experimental system being studied.
Core Analytical Framework: Modeling Gradients with Finite Maturation
The Two-State Model for Protein Maturation
To accurately describe the spatiotemporal distribution of a GFP-tagged protein, one must account for the synthesis of the non-fluorescent form, its maturation, and the subsequent dynamics of the fluorescent form. The foundational model treats the system as two interconnected species [71]:
- C~b~(x,t): Concentration of the immature, non-fluorescent ("black") protein.
- C~g~(x,t): Concentration of the mature, fluorescent ("green") protein.
The total protein concentration is their sum: C(x,t) = C~b~(x,t) + C~g~(x,t). The maturation process is commonly modeled as a first-order reaction with rate constant α, where 1/α is the characteristic maturation time [71].
The Local Accumulation Time Theory
A powerful analytical tool for characterizing the kinetics of gradient formation is the local accumulation time, denoted τ(x). This quantity represents the mean time required for the concentration at a specific location x to reach its steady-state value [71]. It is derived from the relaxation function, R(x,t) = 1 - C(x,t)/C~s~(x), which describes the approach to the steady-state profile C~s~(x):
τ(x) = ∫~0~^∞^ R(x,t) dt
For a fluorescent reporter with finite maturation kinetics, the local accumulation time for the mature, fluorescent form, τ~g~(x), is a linear combination of the accumulation times of the total protein and the immature form [71]:
τ~g~(x) = μ(x)τ(x) - ν(x)τ~b~(x)
where μ(x) and ν(x) are time-independent functions defined by the steady-state concentrations: μ(x) = C~s~(x)/C~g,s~(x) and ν(x) = C~b,s~(x)/C~g,s~(x).
Workflow for Accounting for Maturation Kinetics
The following diagram illustrates the logical process of incorporating maturation kinetics into the analysis of a fluorescent protein gradient, from model formulation to the final, corrected interpretation.
Illustrative Application: The Bicoid Morphogen Gradient
The practical importance of this framework is exemplified by its application to the Bicoid (Bcd) morphogen gradient in the Drosophila embryo. Using measured parameters for Bcd-GFP (D = 4 μm²/s, degradation rate k = 1/50 min⁻¹) and a GFP maturation time of 1/α = 60 minutes, the model reveals significant discrepancies [71]:
- The steady-state profile of the fluorescent form (
C~g,s~) is nonexponential near the source, deviating substantially from the profile of the total protein (C~s~). - The local accumulation time of the fluorescent form (
τ~g~(x)) is a nonlinear function of position near the source, unlike the linear relationship for the total protein.
These distortions demonstrate that uncorrected fluorescence data can yield misleading conclusions about both the shape and establishment kinetics of the protein gradient.
Experimental Protocols for Determining Maturation Kinetics
The Translation Arrest Assay
A standard method for quantifying maturation kinetics involves arresting protein synthesis and monitoring the subsequent increase in fluorescence as pre-synthesized immature proteins mature.
Detailed Protocol [73]:
- Culture and Expression: Grow cells (e.g., E. coli) expressing the FP under tightly regulated, inducing conditions to achieve exponential growth and steady-state protein production.
- Translation Inhibition: Rapidly add a high concentration of a translation inhibitor, such as chloramphenicol or spectinomycin, to the culture. This halts the production of new immature FP.
- Time-Lapse Monitoring: Immediately begin measuring the fluorescence intensity of the culture over time using a plate reader or fluorescence microscope. Ensure exposure times are minimal to avoid photobleaching artifacts.
- Data Analysis: Normalize the fluorescence trajectory. The resulting curve represents the maturation profile of the immature FP pool present at the time of inhibition. Fit this data with an appropriate kinetic model (single exponential, double exponential, etc.) to extract the maturation half-time (t~50~) and other relevant time constants (e.g., t~90~).
Key Research Reagent Solutions
Table 2: Essential Reagents and Tools for Maturation Kinetics Studies
| Reagent / Tool | Function / Description | Example Use Case |
|---|---|---|
| Translation Inhibitors (Chloramphenicol, Spectinomycin) | Arrests new protein synthesis, allowing isolation of the maturation process. | Used in the translation arrest assay to measure the kinetics of the existing immature FP pool [73]. |
| Controlled Expression Systems (pBAD, T7, etc.) | Provides tight, inducible control over FP gene transcription. | Ensures a synchronized pulse of FP expression for kinetic experiments [74]. |
| Microfluidic Single-Cell Chemostat | Maintains cells in a constant exponential growth state for precise environmental control. | Enables high-precision, long-term tracking of fluorescence maturation in individual cells with minimal perturbation [73]. |
| Bayesian Inference Methods | Statistical approach to deconvolve promoter activity from fluorescence data. | Used in conjunction with mechanistic maturation models to obtain unbiased estimates of true gene expression dynamics [75]. |
Phylogenetic and Engineering Perspectives on Maturation
Evolutionary Diversity of GFP Analogs
The natural diversity of GFP-like proteins is a product of long-term evolution. Phylogenetic analysis of proteins from subclass Zoantharia reveals they fall into at least four distinct clades, with proteins of different emission colors intermixed within clades [17]. This topology suggests that color conversions have occurred multiple times throughout evolution. The diversity of maturation kinetics observed in modern FPs is likely a reflection of this complex evolutionary history, where different chromophore structures and microenvironments have been selected [17].
Computational and Ancestral Protein Engineering
Recent advances in computational protein design are now enabling rational engineering of maturation properties and other photochemical characteristics.
- Ancestral Sequence Reconstruction (ASR): This approach infers the sequences of ancient, ancestral proteins from modern sequences. Application of ASR to a dataset of 221 FPs led to the design of "QuetzalFP," an ancestral-like protein that demonstrates high brightness and stability in polymer coatings, showcasing the potential of evolutionary principles for engineering robust FPs for demanding applications [3].
- Machine-Learning Guided Design: Methods like htFuncLib (high-throughput Functional Libraries) use atomistic modeling and machine learning to design highly diverse yet functional mutant libraries focused on the protein's active site. Applied to GFP, this technique generated thousands of functional variants with multiple active-site mutations, many exhibiting diverse and improved traits such as enhanced thermostability (up to 96°C) and quantum yield [36].
- Molecular Dynamics (MD)-Guided Engineering: Short time-scale MD simulations can predict how mutations affect the chromophore's local interaction network. For example, replacing H148 with serine (S) in the β-barrel was predicted to form a more persistent hydrogen bond with the chromophore. The resulting variant, YuzuFP, was experimentally confirmed to be 1.5 times brighter and have 3-fold increased photobleaching resistance compared to its sfGFP parent [76].
Accurate interpretation of dynamic concentration profiles from fluorescence data necessitates the use of analytical frameworks that explicitly account for FP maturation kinetics. The core two-state model and local accumulation time theory provide a rigorous mathematical foundation for this correction. The maturation kinetics themselves are highly diverse, influenced by the specific FP variant, host cell physiology, and environment, and thus require empirical determination via well-controlled assays like translation arrest. As research into the phylogenetic distribution and evolution of GFP analogs continues, and as computational protein design methods become more sophisticated, we can expect the development of next-generation FPs with tailored maturation properties. Integrating these new tools with the analytical frameworks described herein will empower researchers to achieve unprecedented accuracy in quantifying protein dynamics in living systems.
The phylogenetic distribution of Green Fluorescent Protein (GFP) and its homologs reveals a fascinating evolutionary trajectory, with these remarkable biomolecules appearing in phylogenetically distant lineages including Cnidaria, Copepoda, and Cephalochordata [11]. This sparse distribution across the tree of life has prompted significant discussion regarding whether GFP genes were present in a common bilaterian ancestor and subsequently lost in many lineages, or whether they spread through horizontal gene transfer events [11] [38]. Cephalochordates, specifically amphioxus, possess an unexpectedly large family of GFP genes, with Branchiostoma floridae alone encoding 13 functional GFP genes and 2 pseudogenes, representing the largest GFP family discovered to date [38]. This lineage-specific expansion, largely driven by tandem duplications, demonstrates how gene duplication events provide raw material for functional diversification [11]. Despite this expansion, purifying selection has strongly shaped the evolution of GFP-encoding genes in cephalochordates, with apparent relaxation only for highly duplicated clades [11]. The conservation of GFP genes across diverse marine organisms underscores their significant biological roles, which include potential functions in photoprotection, prey attraction, and antioxidant activity [14]. This evolutionary context provides the foundation for modern protein engineering efforts aimed at optimizing spectral properties such as brightness and photostability for biomedical applications.
Fundamental Structural and Photophysical Properties of GFPs
The GFP Scaffold and Chromophore Formation
The canonical GFP structure comprises 238 amino acids forming an 11-stranded β-barrel architecture that encloses a central α-helix containing the chromophore [72]. This unique "β-can" structure provides a protected microenvironment essential for fluorescence, shielding the chromophore from quenchers such as water and oxygen [72] [29]. The chromophore itself is synthesized through an autocatalytic post-translational modification of a tripeptide sequence (Ser65-Tyr66-Gly67 in Aequorea victoria GFP) that undergoes cyclization, dehydration, and oxidation to form the mature 4-hydroxybenzylidene-imidazolinone (HBI) chromophore [72] [29]. This maturation process requires only molecular oxygen without the need for external enzymes or cofactors, making GFP particularly useful for heterologous expression systems [29].
Spectral Tuning Mechanisms in Natural GFP Variants
Natural GFP homologs employ several mechanisms for spectral tuning. The chromophore can exist in different protonation states, with the neutral phenol form exhibiting absorption at approximately 395 nm and the anionic phenolate form absorbing at approximately 475 nm [72] [29]. In wild-type GFP, excitation of the neutral form triggers excited-state proton transfer (ESPT), resulting in green emission at 504 nm [29]. Additionally, π-stacking interactions between the chromophore and aromatic amino acid residues can stabilize the excited state, leading to red-shifted emissions [72]. Cephalochordates have exploited these mechanisms to evolve GFP proteins with diverse emission spectra, with amphioxus GFPs emitting from 500 nm to 530 nm despite high sequence conservation, demonstrating how subtle structural modifications can fine-tune spectral properties [38].
Figure 1: GFP Chromophore Maturation Process. The chromophore forms through a multi-step autocatalytic process requiring proper protein folding followed by cyclization, oxidation, and dehydration reactions.
Protein Engineering Strategies for Enhanced Brightness and Photostability
Molecular Determinants of Photostability
The photostability of fluorescent proteins represents a critical parameter for extended imaging sessions, yet it often exists in a trade-off with brightness [35]. This inverse relationship primarily stems from the role of molecular oxygen, which is essential for chromophore maturation but also participates in photochemical reactions that lead to chromophore decomposition [35]. Enhanced oxygen accessibility, while beneficial for maturation efficiency and maximal brightness, typically decreases photostability by facilitating photobleaching pathways [35]. Additionally, conformational flexibility around the chromophore region can lead to non-radiative decay pathways or isomerization events that diminish fluorescence output over time [29]. The exceptional photostability of StayGold, a recently engineered GFP derived from Cytaeis uchidae jellyfish, highlights how natural diversity can provide solutions to these challenges, as it exhibits a photobleaching half-life exceeding 10,000 seconds - more than ten times greater than EGFP [35].
Rational Engineering Approaches
| Engineering Strategy | Target Region | Mechanism | Representative Variants |
|---|---|---|---|
| Chromophore Environment Optimization | Residues near chromophore | Restrict mobility, reduce oxygen accessibility | StayGold (V168A) [35] |
| Protonation State Control | Glu222, Ser65, Thr65 | Shift equilibrium toward ionized chromophore | S65T [72] [29] |
| π-Stacking Enhancements | Position 203 | Stabilize excited state, red-shift spectra | T203Y (YFP) [72] |
| Surface Charge Modulation | Barrel surface residues | Improve folding efficiency, reduce aggregation | mNeonGreen [35] |
| Oligomerization Disruption | Subunit interfaces | Convert tetramers to monomers | mKate, mKO [77] |
Table 1: Protein Engineering Strategies for Optimizing GFP Spectral Properties
Protein engineers have employed both rational design and directed evolution to optimize GFP brightness and photostability. The S65T mutation serves as a classic example of rational design, which promotes chromophore ionization by maintaining Glu222 in a protonated state, thereby eliminating the 395 nm absorption peak and enhancing the 475 nm peak for improved brightness with blue light excitation [72] [29]. Similarly, the T203Y mutation introduces π-stacking interactions that stabilize the excited state of the chromophore, resulting in red-shifted emission and creating yellow fluorescent protein (YFP) [72]. For red fluorescent proteins, strategic mutations such as K83L in mCherry alter the chromophore environment to produce substantial red shifts through mechanisms that modify electron density distribution [72]. StayGold's remarkable photostability was achieved through a single V168A mutation that improved both expression levels and chromophore maturation efficiency without compromising its exceptional resistance to photobleaching [35].
Directed Evolution and Screening Approaches
Directed evolution has proven invaluable for optimizing GFP variants when rational design approaches are limited by incomplete structural knowledge. This process typically involves:
- Creating diverse mutant libraries through error-prone PCR or DNA shuffling
- Transforming into bacterial hosts (typically E. coli)
- Screening for desired phenotypes using fluorescence-activated cell sorting (FACS) or automated colony picking
- Iterative cycling of mutation and selection [17]
This approach has yielded numerous optimized FPs, including the mFruit series (mCherry, mStrawberry, mOrange) derived from Discosoma RFP through 45 rounds of directed evolution [77]. Similarly, the development of monomeric versions of originally tetrameric proteins like KikGR required 15 rounds of mutagenesis introducing 21 amino acid substitutions [77]. These efforts demonstrate the power of directed evolution in solving complex protein engineering challenges that involve multiple competing constraints.
Experimental Characterization of Spectral Properties
Quantitative Photophysical Measurements
Standardized protocols for quantifying fluorescent protein properties enable direct comparison between variants. The following parameters must be precisely measured under controlled conditions:
Extinction Coefficient Determination:
- Prepare serial dilutions of purified FP in known buffer
- Measure absorbance spectrum (e.g., 250-600 nm) using spectrophotometer
- Determine absorbance at maximum wavelength for each dilution
- Plot absorbance versus concentration and calculate slope from linear regression
- Apply Beer-Lambert law: ε = A/(c×l), where A is absorbance, c is concentration (M), and l is pathlength (cm) [35]
Quantum Yield Measurement:
- Select appropriate reference fluorophore with known quantum yield (e.g., fluorescein in 0.1 M NaOH, Φ=0.92)
- Measure absorbance of both sample and reference at excitation wavelength (ensure <0.1 to avoid inner filter effect)
- Record emission spectrum from 450-650 nm using fluorometer
- Integrate emission area and calculate using: Φsample = Φref × (Areasample/Arearef) × (ηsample2/ηref2) [35]
Systematic comparison of photophysical properties reveals the substantial advances achieved through protein engineering:
| Fluorescent Protein | Excitation (nm) | Emission (nm) | Extinction Coefficient (M⁻¹cm⁻¹) | Quantum Yield | Brightness (ε×Φ/1000) | Photostability t₁/₂ (s) |
|---|---|---|---|---|---|---|
| StayGold | 496 | 506 | 159,000 | 0.93 | 147.9 | >10,000 |
| EGFP | 488 | 507 | 56,000 | 0.60 | 33.6 | 701 |
| mNeonGreen | 506 | 517 | 116,000 | 0.80 | 92.8 | ~500 |
| mClover3 | 486 | 506 | 125,000 | 0.78 | 97.5 | ~400 |
| SiriusGFP | 496 | 506 | 41,000 | 0.64 | 26.2 | ~300 |
| Dendra2 | 490/553 | 507/573 | 45,000/35,000 | 0.50/0.55 | 22.5/19.3 | 45/378 |
| mEos2 | 506/573 | 519/584 | 56,000/46,000 | 0.84/0.66 | 47.0/30.4 | 42/323 |
Table 2: Photophysical Properties of Engineered Fluorescent Proteins. Brightness is calculated as the product of extinction coefficient and quantum yield divided by 1000. Photostability t₁/₂ represents the time for fluorescence to drop to half under continuous illumination (5.6 W cm⁻²). Data compiled from [77] [35].
Photostability Assessment Protocols
Standardized photostability measurements enable direct comparison between FPs:
In Vitro Photostability Assay:
- Purify FPs to homogeneity using affinity chromatography
- Incorporate into oxygen-permeable polyacrylamide gel (1 μM concentration)
- Sandwich between coverslips to minimize oxygen diffusion limitations
- Excite with continuous unattenuated arc-lamp illumination (5.6 W cm⁻² at 488 nm)
- Acquire time-lapse images with sensitive EMCCD or sCMOS camera
- Quantify fluorescence decay and fit to exponential decay model
- Calculate t₁/₂ (time to 50% fluorescence loss) and total photon budget [35]
Cellular Photostability Assessment:
- Generate stable cell lines (e.g., HeLa) expressing FP-tagged cytosolic protein
- Plate cells at consistent density on glass-bottom dishes
- Image using wide-field microscope with controlled environment (37°C, 5% CO₂)
- Apply continuous illumination at various intensities (1-10 W cm⁻²)
- Quantify fluorescence decay in individual cells
- Normalize for expression levels to account for potential artifacts [35]
Figure 2: Experimental Workflow for Photostability Assessment. The protocol includes both in vitro and cellular approaches to comprehensively characterize FP performance under biologically relevant conditions.
The Scientist's Toolkit: Essential Research Reagents and Materials
| Reagent/Material | Function | Application Notes |
|---|---|---|
| pGEX-4t-2 Vector | Protein expression and purification | Used for generating GST fusion proteins for bacterial expression [38] |
| E. coli JM109 Strain | Protein expression host | Standard competent cells for FP expression and colony screening [17] |
| SMART cDNA Amplification Kit | cDNA synthesis and amplification | Essential for cloning novel FPs from marine organisms [17] |
| pGEM-T Vector System | TA cloning of PCR products | High-efficiency system for initial cloning of amplified FP genes [17] |
| Bradford Assay Kit | Protein quantification | Critical for normalizing FP concentrations for photophysical measurements [35] |
| Polyacrylamide Gel Matrix | Oxygen-permeable medium for in vitro assays | Provides consistent environment for photostability measurements [35] |
| IPTG | Inducer for bacterial expression | Used at 0.3 mM concentration for FP expression in E. coli [17] |
Table 3: Essential Research Reagents for Fluorescent Protein Engineering and Characterization
The phylogenetic distribution of GFP-like proteins across cnidarians, copepods, and cephalochordates provides a rich natural palette for protein engineering initiatives [11] [38]. The ongoing discovery of novel FPs with unique properties, such as the exceptionally photostable StayGold from Cytaeis uchidae jellyfish, demonstrates that natural diversity remains a valuable resource for biotechnology [35]. Future directions in FP engineering will likely focus on overcoming remaining limitations, particularly the development of bright, photostable variants that emit in the near-infrared region for improved tissue penetration in live-animal imaging [77]. Additionally, the expansion of the FP toolkit to include specialized variants such as fluorescent timers and photoactivatable proteins provides powerful new approaches for studying protein turnover and trafficking in live cells [77]. As our understanding of the relationship between FP structure and function deepens, integration of computational design approaches with high-throughput screening methods will accelerate the development of next-generation FPs with customized properties for advanced imaging applications. The continued exploration of GFP diversity across the phylogenetic tree, coupled with innovative protein engineering strategies, promises to further expand the technological frontiers of biological imaging.
The Green Fluorescent Protein (GFP) and its analogs are indispensable tools in modern biological research, enabling the tracking of cells, visualization of gene expression, and assessment of protein localization in vivo [66]. However, its utility as a biomarker is complicated by its potential to elicit immunogenic and cytotoxic responses in model organisms, which can confound experimental outcomes [66] [78]. The interpretation of in vivo data is highly dependent on the model system employed, with two critical, often underestimated variables being the animal strain and the route of administration [66]. Within the broader context of researching the phylogenetic distribution of GFP analogs—from their origins in cnidarians and copepods to their surprising expansion in cephalochordates—understanding these practical experimental parameters is paramount [17] [11] [38]. This guide provides a detailed technical framework for researchers and drug development professionals to optimize model system selection, thereby ensuring the accurate tracking of stem cell fate and the reliable evaluation of therapeutic gene expression.
The Immunogenic and Cytotoxic Profile of GFP
GFP is not a neutral tag; its expression can trigger direct cellular injury and activate immune pathways. The cellular damage associated with GFP expression is multifaceted, potentially resulting from reactive oxygen species (ROS) generation, the induction of apoptosis, and damage mediated by immune mechanisms [66]. A key immunogenic pathway involves T-cell mediated immunity, where the GFP antigen is processed intracellularly and presented on the cell surface via class I Major Histocompatibility Complex (MHC) molecules, leading to recognition and destruction by cytotoxic T-lymphocytes (CTLs) [66]. This immunogenicity means that GFP-labeled cells, particularly transplanted stem cells, can be targeted for elimination by the host's immune system, leading to their gradual disappearance over time and a misinterpretation of cell survival and engraftment data [66] [78]. Studies have consistently shown that the engraftment of wild-type myoblasts is significantly more effective than that of their GFP-labeled counterparts, directly confirming the antigenic role of GFP in transplantation experiments [78].
Impact of Animal Strain on GFP Expression and Persistence
The genetic background of the animal model is a decisive factor in the immune response to GFP. Significant variations in GFP-specific CTL responses and the subsequent survival of GFP-expressing cells have been documented across different strains.
Table 1: Impact of Mouse Strain on GFP Immunogenicity
| Mouse Strain | Immune Status | Observed Response to GFP-Expressing Cells | Key Experimental Findings |
|---|---|---|---|
| BALB/c | Immunocompetent | High Immunogenicity | Intravenously injected eGFP-expressing leukemia cells did not cause recipient death, unlike wild-type cells. A three-fold increase in CTL response against eGFP+ cells was measured [66]. |
| C57BL/6 | Immunocompetent | Minimal Immunogenicity | Subcutaneously administered eGFP-expressing lymphoma cells did not cause tumor growth, but intravenously administered cells did, regardless of GFP status. This strain is considered a better host for GFP-labeled cell transplantation [66] [78]. |
| mdx | Immunocompetent | High Immunogenicity | GFP-transduced myoblasts underwent rapid immunorejection, and dystrophin-positive engraftment was much less effective than with wild-type myoblasts [78]. |
| Nude (Nu/Nu) | Immunodeficient (Lacks T-cells) | No T-cell Mediated Rejection | Both wild-type and eGFP-expressing leukemia cells caused mortality upon intravenous injection, confirming that T-cells are essential for the immunologic rejection of GFP-expressing cells [66]. |
The underlying mechanism for these strain-specific differences is linked to the MHC haplotype, which governs antigen presentation to T-cells. The murine MHC class I (H-2 K/D/L) consists of extracellular α heavy chains present on chromosome 17 and an α3-associated β2-microglobulin on chromosome 2 [66]. The specific alleles present in different strains dictate the efficiency of GFP peptide presentation and the subsequent vigor of the CTL response.
Influence of Administration Route on Experimental Outcomes
The method and route by which GFP-expressing cells are introduced into the host organism can dramatically alter the immune system's encounter with the antigen, thereby shaping the final outcome.
Table 2: Impact of Administration Route on GFP-Specific Immune Response
| Route of Administration | Model System | Observed Outcome | Interpretation |
|---|---|---|---|
| Intravenous (IV) | BALB/c mice with pre-B leukemia cells | eGFP-expressing cells rejected; no mortality. | GFP antigen presented systemically, priming a potent CTL response that clears the cells [66] [38]. |
| Subcutaneous (SC) | BALB/c mice with pre-B leukemia cells | Both normal and eGFP-transduced cells formed tumors. | The local subcutaneous environment may be less efficient at priming a systemic immune response, allowing initial tumor growth [66]. |
| Subcutaneous (SC) | C57BL/6 mice with T-cell lymphoma cells | eGFP-expressing cells did not cause tumor growth. | In this strain, even local administration is sufficient to trigger an effective immune rejection against the GFP antigen [66]. |
| Intramuscular | Various immunocompetent mice with myoblasts | GFP signal declines over time in high-immunogenicity strains. | The local muscle environment is susceptible to immune infiltration, leading to the destruction of transplanted GFP+ cells [78]. |
The route of administration determines the initial site of antigen presentation and the local immune microenvironment, which can either favor immune activation or tolerance. For instance, intravenous injection often leads to efficient antigen presentation in the spleen, fostering a strong systemic immune response.
Experimental Protocols for Assessing GFP Immunogenicity
Protocol 1: In Vivo Cell Tracking via Fluorescence Imaging
This protocol is designed to dynamically monitor the survival and engraftment of GFP-labeled cells in living animals [78].
- Cell Preparation: Isolate primary myoblasts (or other stem/progenitor cells) from a donor animal. For ex vivo labeling, transduce the cells with eGFP-expressing lentiviral vectors and culture to verify expression. Alternatively, isolate cells directly from a GFP-transgenic animal [78].
- Cell Transplantation: Anesthetize the host animal (e.g., C57BL/6, BALB/c, mdx, or nude mouse). For intramuscular engraftment, use a Hamilton syringe to inject a precise number of cells (e.g., 5 × 10^5 cells in 20 µl of Hanks solution) into the tibialis anterior (TA) muscle. For systemic delivery, administer cells via intravenous or retro-orbital injection [78].
- In Vivo Fluorescence Imaging (FLI):
- Use a planar fluorescence imaging station (e.g., NightOwl LB981) with a high-sensitivity CCD camera.
- Anesthetize the animal and position it prone on non-fluorescent black paper.
- Acquire a photographic image (exposure: ~10 s).
- Acquire a fluorescence image using a 475 nm excitation filter and a 525 nm emission filter (exposure: ~1250 ms) [78].
- Image Quantification:
- Manually outline the region of interest (ROI) containing the eGFP signal.
- Record the fluorescence intensity (photon counts/s/mm²) and area of the ROI.
- Subtract the background autofluorescence by measuring an adjacent eGFP-negative region.
- Calculate the total normalized photon counts generated by the eGFP+ cells [78].
- Histological Validation: After final imaging, perfuse the animal and harvest the target tissue (e.g., TA muscle). Process the tissue for cryosectioning and perform immunohistochemistry (e.g., for dystrophin) to correlate fluorescence signals with functional engraftment [78].
Protocol 2: Evaluating T-Cell Mediated Immunogenicity
This protocol assesses the specific role of cytotoxic T-lymphocytes in rejecting GFP-expressing cells [66].
- Model Selection: Utilize immunocompetent strains (e.g., BALB/c, C57BL/6) and immunodeficient controls (e.g., Nu/Nu mice).
- Tumor Cell Challenge: Use a transplantable tumor cell line (e.g., BM185 pre-B leukemia or EL-4 T-cell lymphoma). Create test groups that are injected with either wild-type or eGFP-transduced tumor cells via different routes (IV vs. SC).
- Endpoint Measurement:
- Survival/Mortality: Monitor and record the survival of the animals. Rejection of eGFP+ cells will be evidenced by a lack of tumor growth and mortality in immunocompetent, but not immunodeficient, hosts [66].
- CTL Quantification: Isolate splenocytes from challenged mice and quantify the cytotoxic T-lymphocyte response against GFP-expressing targets using an assay such as a standard in vitro cytotoxicity assay [66].
- Immunosuppression: To confirm the mechanism, treat a group of animals with an immunosuppressant such as Cyclosporine or Tacrolimus (FK506), which inhibits T-cell activation by blocking calcineurin-mediated IL-2 upregulation. Stable, long-term GFP expression in suppressed hosts confirms T-cell involvement [66].
The Scientist's Toolkit: Key Research Reagent Solutions
Table 3: Essential Reagents and Models for GFP-Based Research
| Reagent / Model | Function and Application | Technical Notes |
|---|---|---|
| C57BL/6 Mouse Strain | An immunocompetent host with minimal anti-GFP immunogenicity; ideal for long-term tracking of GFP-labeled cells. | Preferred over BALB/c or mdx strains for transplantation studies where immune rejection is a concern [66] [78]. |
| GFP-Transgenic Animals | Source of cells that endogenously express GFP. | Myoblasts from GFP-transgenic mice display much more effective engraftment and longer persistence than ex vivo GFP-transduced cells [66] [78]. |
| Immunosuppressants (Cyclosporine, Tacrolimus) | Inhibit T-cell activation to mitigate immune rejection of GFP-expressing cells. | Bind to cyclophilin and FKBP, respectively, inhibiting calcineurin and IL-2 production. Enables stable GFP expression for over 800 days in canine models [66]. |
| Lentiviral Vectors | For stable ex vivo transduction and expression of GFP in primary cells. | Allows for high-efficiency labeling of hard-to-transfect cells like stem cells prior to transplantation [78]. |
| Fluorescence Imaging Station | For non-invasive, in vivo tracking of GFP-labeled cells over time. | Systems like the NightOwl LB981 use specific excitation/emission filters (475/525 nm) and a sensitive CCD camera for quantification [78]. |
| GFP-on Reporter Mouse | A model harboring a silent EGFP gene activatable by base editors; used to test gene-editing delivery efficiency. | Allows for rapid assessment of in vivo delivery vehicles and editing tools by turning on fluorescence in targeted tissues [79]. |
The phylogenetic journey of GFP analogs, from jellyfish to amphioxus, underscores their ancient and diverse biological roles [11] [38] [53]. When harnessing these proteins in modern research, a meticulous approach to model selection is critical. To minimize the confounding effects of immunogenicity, researchers should:
- Prioritize Animal Strains with low inherent immune responses to GFP, such as C57BL/6 mice, over high-responder strains like BALB/c or mdx [66] [78].
- Carefully Consider the Administration Route, understanding that systemic (e.g., IV) delivery is often more immunogenic than local (e.g., SC) delivery, though this is strain-dependent [66] [38].
- Employ GFP-Transgenic Cells whenever possible, as they demonstrate superior engraftment and persistence compared to ex vivo transduced cells [66] [78].
- Utilize Immunosuppression strategically to dissect mechanisms or enable long-term studies, acknowledging the associated experimental complexities [66].
By integrating these principles with a clear understanding of GFP's phylogenetic distribution and immune characteristics, scientists can design more robust and interpretable experiments, thereby advancing the fields of cell therapy, drug development, and developmental biology.
The Green Fluorescent Protein (GFP), originally discovered in the jellyfish Aequorea victoria, has evolved into a diverse family of proteins with a broad phylogenetic distribution across the animal kingdom. Research has identified GFP-like proteins not only in Cnidaria but also in Copepoda and Cephalochordata (amphioxus), with the amphioxus Branchiostoma floridae alone possessing at least 13 functional GFP genes, representing the largest known GFP family [38]. This widespread yet patchy phylogenetic occurrence suggests that GFP genes appeared very early in animal evolutionary history and were subsequently lost in many deuterostome lineages [38]. The conserved β-barrel structure serves as a universal scaffold across this phylogenetic spectrum, while variations in the chromophore environment and amino acid sequences have led to the natural diversity of fluorescent colors observed in these proteins.
The fundamental challenge in GFP engineering stems from a critical property: the isolated chromophore (p-hydroxybenzylidene-imidazolidinone, p-HBDI) is virtually non-fluorescent in solution [80] [28]. The quenching of fluorescence primarily results from internal rotations around the aryl-alkene bond (torsional vibration) and Z/E isomerization of the benzylidene double bond, which provide efficient non-radiative decay pathways for the excited state energy [80] [81]. Nature's solution, honed through evolution across species, is the rigid β-barrel structure that completely encapsulates and restrains the chromophore. This evolutionary innovation provides the blueprint for all artificial enhancement strategies, which fundamentally aim to mimic this restrictive environment through various chemical and genetic approaches.
The Protective Role of the Beta-Barrel Structure
Structural Analysis of the Native GFP Fold
The GFP polypeptide chain folds into a remarkably stable β-barrel structure consisting of eleven β-strands arranged around a central α-helix, forming a nearly perfect cylinder approximately 25 Å in diameter and 40 Å in height [28]. This cylindrical architecture creates a shielded internal cavity that houses the chromophore, formed autocatalytically from the tripeptide Ser65-Tyr66-Gly67 (in A. victoria GFP) through cyclization and oxidation [28] [82]. The interior of the β-barrel provides a precisely engineered environment that enforces chromophore planarity and rigidity through multiple mechanisms:
- Hydrogen Bond Network: Conserved residues (Glu222 and Arg96 in A. victoria GFP) form critical hydrogen bonds with the chromophore, stabilizing its ionization state and geometry [28].
- Hydrophobic Packing: The chromophore is surrounded by hydrophobic side chains that create a tight-fitting cavity, preventing molecular motions and collisions that would dissipate energy thermally [28].
- Steric Constraint: The compact β-barrel physically restricts rotational freedom around the chromophore's bridging bonds between the two aromatic rings [80].
This structural organization is so essential that denatured GFP or the isolated chromophore hexapeptide show virtually no fluorescence (quantum yield < 0.001), despite containing an intact chromophore [28] [82]. The β-barrel's remarkable stability allows it to fold correctly and fluoresce when fused to various proteins and expressed in diverse organisms, making it an exceptionally versatile scaffold for protein engineering [82].
Evolutionary Diversity in Beta-Barrel Proteins
The phylogenetic distribution of GFP-like proteins reveals significant evolutionary innovation within the conserved β-barrel scaffold. In reef Anthozoa, GFP-like proteins have diversified into multiple color classes, falling into at least four distinct clades in Zoantharia, with each clade containing proteins of different emission colors [17]. This pattern suggests multiple recent events of color conversion during evolution, where the β-barrel maintained its structural role while accommodating different chromophore structures and electrostatic environments [17]. The diversity extends beyond fluorescence, with some GFP homologs functioning as non-fluorescent chromoproteins that likely serve ecological roles in coloration [28].
Table 1: Phylogenetic Distribution of GFP-like Proteins
| Taxonomic Group | Representative Organisms | Key Features | Color Diversity |
|---|---|---|---|
| Cnidaria | Aequorea victoria (jellyfish) | Original GFP source; β-barrel structure | Green (GFP) |
| Anthozoa | Coral species (Discosoma sp., Montastraea cavernosa) | Multiple protein clades; diverse chromophores | Green, Yellow, Red, Non-fluorescent purple-blue |
| Copepoda | Pontella mimocerami | Bright variants (QY up to 0.92) | Fluorescent colors |
| Cephalochordata | Branchiostoma floridae (amphioxus) | Largest GFP family (13+ genes) | Specialized expression profiles |
The β-barrel's robustness is evidenced by its tolerance to substantial engineering, including circular permutation (creating new N- and C-termini at different positions) and split GFP systems where the protein is divided into fragments that reassemble when brought together [82]. These engineered variants maintain the essential protective function of the native β-barrel while gaining new sensitivities to microenvironment or protein-protein interactions, dramatically expanding their biosensing applications [82].
Core Strategy I: Locking the Chromophore Through Rigidification
Chemical Modifications and Conjugations
Significant efforts have been dedicated to chemically rigidifying the GFP chromophore core to suppress non-radiative decay pathways. These approaches aim to create synthetic mimics that retain fluorescence without requiring the full protein scaffold:
- Complexation with Boron: The difluoroborate complex has been successfully used to lock the GFP chromophore structure. The boron center coordinates with specific heteroatoms on the chromophore, creating a rigidified complex that exhibits enhanced emission intensity by restricting the torsional freedom responsible for fluorescence quenching [80].
- Metal Complexation: Transition metals have been employed to create coordination complexes with GFP chromophore analogues. The metal-ligand interactions form stable chelates that limit molecular mobility, particularly rotation around the aryl-alkene bond, resulting in improved fluorescence quantum yields [80].
- Macrocyclic Encapsulation: Synthetic macrocycles can partially encapsulate the chromophore, creating a protective microenvironment that mimics the steric constraints of the native β-barrel. This strategy physically impedes the rotational and isomerization motions that lead to non-radiative decay [80].
These chemical approaches provide valuable insights for drug development professionals seeking to design small-molecule fluorescent probes that bypass the need for genetic encoding while maintaining strong emission properties.
Crystallization and Aggregation-Induced Emission Enhancement (AIEE)
The solid-state environment naturally restricts molecular motions, providing a powerful physical method to enhance fluorescence through crystal engineering and controlled aggregation:
- Crystal Packing Optimization: Studies on GFP chromophore analogues (e.g., compounds 2a-d) demonstrated that crystal packing significantly influences emission properties. Incorporating alkyl chains of varying lengths (2b, 2c, 2d) disrupts strong intermolecular interactions like hydrogen bonding between hydroxyl and carbonyl groups (which quenches fluorescence in 2a), leading to enhanced solid-state emission [80].
- Polymorph-Dependent Emission: Different crystal polymorphs of the same chromophore can exhibit distinct photophysical properties. For example, chromophore 5 organizes into five polymorphs with emission wavelengths ranging from 450 nm (blue) to 550 nm (yellow), all showing AIEE with quantum yields of 0.02-0.05, while chromophore 4a forms non-emissive head-to-tail dimers with strong π-π stacking [80].
- Aromatic Substitution Effects: Introducing large aromatic substituents in place of the p-hydroxyphenyl ring (chromophores 6a-e) can induce red-shifted emission but doesn't necessarily restrict intramolecular motions in solution. However, specific derivatives (e.g., 6b) can form polymorphic crystals with AIEE properties [80].
Table 2: Aggregation-Induced Emission Enhancement (AIEE) in GFP Chromophore Derivatives
| Chromophore Series | Structural Modification | Solution QY | Solid-State QY | Key Finding |
|---|---|---|---|---|
| 1a-c | Rotational aromatic groups around core | Weak emission | Increased | Only Z-isomer confirmed in crystals |
| 2a-d | Variable alkyl chains on phenolic oxygen | - | 2b-d: AIEE active 2a: Non-emissive | Chain length reduces intermolecular interactions |
| 3a-d | Alkyl chains at position 2 of imidazolinone | Weak emission | Increased with chain length | Longer chains weaken π-π interactions |
| 4a-f | 2-phenylbenzoxazole with N-alkyl chains | ~0.02 (4a-d) 0.20-0.24 (4e-f) | 0.16-0.26 (4b-d) | Alkyl chains separate molecules in solid state |
| 5 | Polymorphic crystals | Non-emissive | 0.02-0.05 | Emission color varies with polymorph (450-550 nm) |
The following diagram illustrates the relationship between chromophore rigidification strategies and their effects on fluorescence:
Chromophore Rigidification Enhances Fluorescence
Core Strategy II: Mimicking the Beta-Barrel Environment
Protein Engineering Approaches
Rational protein engineering has created diverse GFP variants with enhanced properties by systematically modifying the β-barrel structure and chromophore environment:
- Supercharged FPs (ScGFPs): Resurfacing GFP with unusually high theoretical surface charge by mutating solvent-exposed residues to basic (Arg, Lys) or acidic (Glu, Asp) amino acids creates supercharged variants that retain fluorescence while gaining the ability to interact with polyionic materials, enabling new biosensing and protein delivery applications [82].
- Circularly Permuted FPs (cpFPs): Linking the original N- and C-termini with a short peptide while creating new termini at surface loops (e.g., between residues 145-163) generates cpFPs where the new termini are closer to the chromophore. These variants show increased sensitivity to microenvironmental changes, making them ideal backbone structures for biosensor design [82].
- Unnatural Amino Acid (UAA) Incorporation: Site-specific incorporation of UAAs with novel chemical, physical, and structural properties expands the functional repertoire of GFP. For example, replacing Tyr66 with UAA analogs can create chromophores with altered spectral properties or novel target-responsive behaviors not found in nature [82].
Synthetic Scaffolds and Biomimetics
Beyond protein engineering, researchers have developed completely synthetic systems that replicate the essential protective function of the β-barrel:
- RNA/DNA Mimics: Nucleic acid-based scaffolds can organize fluorescent chromophores in a constrained environment. Specific RNA and DNA aptamers have been selected to bind and rigidify GFP-like chromophores, creating so-called "RNA mimics of GFP" that bring the chromophore into a planar, fluorescent state while protecting it from quenching interactions with solvent [82].
- Synthetic Chromophore Encapsulation: Synthetic macrocycles and cage compounds designed with internal cavities complementary to the GFP chromophore structure can partially reproduce the steric confinement of the native protein environment, leading to enhanced emission from otherwise non-fluorescent chromophores in solution [82].
- Polymer and Dendrimer Scaffolds: Designed polymeric materials with precisely controlled internal volumes can encapsulate chromophores while restricting their molecular motion, offering a versatile platform for developing bright fluorescent labels without the genetic encumbrance of full protein scaffolds.
Experimental Protocols for Fluorescence Enhancement
Synthesis of GFP Chromophore Analogues
The synthesis of GFP chromophore analogues typically follows two main strategies, each providing access to different derivative types:
Erlenmeyer Azlactone Synthesis Protocol:
- Begin with aromatic aldehydes and hippuric acid in acetic anhydride as solvent.
- Heat the mixture under reflux to facilitate condensation, forming an azlactone intermediate.
- Isolate the azlactone by precipitation and filtration.
- React the purified azlactone with a primary amine (e.g., p-anisidine) to open the ring.
- Allow spontaneous cyclization to form the final imidazolidinone core of the GFP chromophore analogue.
- Purify the product using column chromatography and characterize by NMR and mass spectrometry [80].
Knoevenagel Condensation Protocol:
- First synthesize the imidazolidine core structure through standard peptide coupling techniques.
- Perform Knoevenagel condensation between the imidazolidine derivative and an appropriate aromatic aldehyde.
- Use mild base catalysis to facilitate the condensation while avoiding side reactions.
- Monitor reaction progress by TLC until completion.
- Isolate the crude product and purify via recrystallization or chromatography.
- Confirm the structure and isomeric purity using spectroscopic methods [80].
Crystallization and AIEE Characterization
To evaluate aggregation-induced emission enhancement properties:
- Prepare concentrated stock solutions (1-10 mM) of the chromophore in DMSO or other appropriate organic solvents.
- Gradually add a non-solvent (typically water or hexane) to induce aggregation while monitoring by UV-Vis spectroscopy.
- For crystal growth, use slow evaporation, vapor diffusion, or solvent layering techniques to obtain high-quality single crystals.
- Characterize the crystalline material using single-crystal X-ray diffraction to determine molecular packing and intermolecular interactions.
- Measure fluorescence quantum yields in solution and solid state using an integrating sphere, with appropriate standards (e.g., quinine sulfate for green emitters).
- Compare emission intensities between solution and aggregated/crystalline states to quantify the AIEE factor.
- For polymorph studies, systematically vary crystallization conditions (solvent composition, temperature, cooling rate) to obtain different crystal forms [80].
Molecular Complexation Procedures
For complexation with metals or boron:
Difluoroborate Complex Formation:
- Dissolve the chromophore ligand in anhydrous dichloromethane or acetonitrile under inert atmosphere.
- Add boron trifluoride diethyl etherate (BF₃·OEt₂) dropwise with stirring.
- Monitor the reaction by TLC and UV-Vis spectroscopy for characteristic spectral shifts.
- Quench the reaction with aqueous sodium bicarbonate, extract with organic solvent, and purify the complex.
- Characterize the complex using ¹¹B NMR, which shows characteristic shifts upon coordination [80].
Metal Complexation:
- Prepare a solution of the chromophore ligand in methanol or acetonitrile.
- Add stoichiometric amounts of metal salt (e.g., Zn²⁺, Cu²⁺, or other transition metals) in the same solvent.
- Adjust pH if necessary to optimize complex formation.
- Isolate the metal complex by precipitation or solvent evaporation.
- Characterize using elemental analysis, mass spectrometry, and if possible, X-ray crystallography [80].
The Scientist's Toolkit: Essential Research Reagents
Table 3: Key Research Reagents for GFP Chromophore Studies
| Reagent/Category | Specific Examples | Function/Application |
|---|---|---|
| Chromophore Derivatives | p-HBDI, compounds 1a-c, 2a-d, 3a-d, 4a-f, 5, 6a-e | Core structures for studying structure-property relationships and rigidification strategies |
| Complexation Agents | Boron trifluoride etherate, Zinc acetate, Copper chloride | Form fluorescent complexes by restricting chromophore motion through coordination |
| Crystallization Tools | Various organic solvents (DMSO, acetonitrile, methanol), Non-solvents (water, hexane) | Induce aggregation and crystal formation for AIEE studies and polymorph screening |
| Encapsulation Systems | Synthetic macrocycles, Cucurbiturils, Cyclodextrins | Mimic the restrictive environment of the β-barrel through supramolecular chemistry |
| Reference Standards | Quinine sulfate, Fluorescein | Quantum yield determination and instrument calibration |
| Analytical Instruments | Spectrofluorometers, Integrating spheres, Single-crystal X-ray diffractometers | Photophysical characterization and structural determination |
The phylogenetic distribution of GFP-like proteins across Cnidaria, Copepoda, and Cephalochordata demonstrates nature's success in optimizing the β-barrel scaffold for diverse biological functions. The strategies reviewed—chromophore rigidification through chemical modifications, crystallization, complexation, and β-barrel mimicking through protein engineering and synthetic scaffolds—provide a comprehensive toolkit for enhancing fluorescence intensity. These approaches fundamentally address the core photophysical challenge: suppressing non-radiative decay pathways by restricting molecular motion.
For drug development professionals and researchers, these strategies enable the rational design of enhanced fluorescent probes for advanced applications in biosensing, bioimaging, and high-throughput screening. The ongoing discovery of new GFP-like proteins in diverse organisms continues to reveal novel structural solutions to the challenge of fluorescence optimization, providing inspiration for further engineering efforts. Future research directions should focus on developing red-shifted and near-infrared variants with enhanced brightness, improving photostability for long-term imaging studies, and creating increasingly sophisticated biosensors that respond to specific cellular signals while maintaining the fundamental principle of chromophore restraint that underpins all fluorescent protein technology.
A Critical Comparison of Fluorescent Proteins for Specific Research Applications
The discovery of Green Fluorescent Protein (GFP) from the jellyfish Aequorea victoria initiated a revolution in biological imaging, enabling researchers to visualize cellular processes in living systems with genetic precision [17] [37]. The subsequent identification of homologous fluorescent proteins across diverse organisms, including corals and cephalochordates, has revealed a remarkable phylogenetic distribution of GFP-like proteins with varied spectral and biochemical properties [17] [38]. This evolutionary diversity provides a rich resource for protein engineering, but simultaneously necessitates systematic benchmarking to guide appropriate selection for specific research applications. Performance metrics such as brightness, photostability, and maturation speed have become critical parameters for evaluating fluorescent proteins across this expanded phylogenetic spectrum.
The functional diversity of GFP analogs mirrors their evolutionary history. Genomic analyses have revealed that GFP-like proteins are not restricted to Cnidaria but are also present in Copepoda and Cephalochordata, with amphioxus (Branchiostoma floridae) possessing the largest known GFP family comprising 13 functional genes [38]. This widespread phylogenetic distribution indicates that GFP-like proteins appeared early in animal evolutionary history, with multiple independent diversification events creating proteins with different emission colors and properties [17] [38]. For researchers investigating the phylogenetic distribution of GFP analogs, understanding how these evolutionary differences translate to practical performance metrics is essential for both selecting optimal tools and understanding natural function.
Quantitative Benchmarking of Fluorescent Proteins
Defining Key Performance Metrics
The performance of fluorescent proteins is quantified through several standardized metrics. Brightness is defined as the product of the extinction coefficient (ε, a measure of light absorption capacity) and the quantum yield (QY, the efficiency of photon emission per photon absorbed), typically relative to enhanced GFP (EGFP) [37]. Photostability measures resistance to photobleaching, quantified as the half-time (t₁/₂) of fluorescence decay under standardized illumination [37]. Maturation rate describes the kinetics by which a folded, dark FP is converted into a fluorescent species through chromophore formation [83]. Additionally, pH stability (characterized by pKa) indicates performance across physiological pH ranges, while monomeric character ensures minimal disruption to fused proteins [37] [83].
Recent research has revealed that photobleaching in FPs follows a "supra-linear" or "accelerated" pattern, where bleaching rates increase disproportionately with excitation intensity [37]. This phenomenon, quantified by the exponent α in the equation kₜᵉₐ𝑐ₕ = b·Iα, has significant implications for microscopy modality selection. Laser scanning confocal microscopy, with its high instantaneous intensity, exhibits disproportionately faster photobleaching compared to widefield microscopy at identical total photon flux [37]. This mechanistic insight underscores the importance of contextualizing performance metrics within experimental applications.
Comparative Performance Across Spectral Classes
Table 1: Performance Metrics of Selected Fluorescent Proteins
| Fluorescent Protein | Class | Excitation Peak (nm) | Emission Peak (nm) | Extinction Coefficient (mM⁻¹cm⁻¹) | Quantum Yield | Relative Brightness | pKa | Maturation Half-time (min) |
|---|---|---|---|---|---|---|---|---|
| mEGFP [37] | Green | 488 | 507 | 56,000 | 0.60 | 33.6 | 6.0 | ~15 |
| mNeonGreen [37] | Green | 506 | 517 | 116,000 | 0.80 | 92.8 | 5.7 | ~10 |
| mVenus [37] | Yellow | 515 | 528 | 92,200 | 0.64 | 59.0 | 6.2 | ~2 |
| mCherry [37] | Red | 587 | 610 | 72,000 | 0.22 | 15.8 | <4.5 | ~15 |
| mCardinal [37] | Red | 604 | 659 | 87,000 | 0.19 | 16.5 | 4.8 | ~28 |
| mChartreuse [83] | Green | 487 | 510 | 71,000 | 0.75 | 53.3 | 4.9 | 4.9 |
| mJuniper [83] | Cyan | 434 | 475 | 32,000 | 0.43 | 13.8 | 4.7 | 1.7 |
| mLemon [83] | Yellow | 514 | 526 | 125,000 | 0.74 | 92.5 | 4.8 | 12.0 |
| mLychee [83] | Red | 568 | 596 | 80,000 | 0.50 | 40.0 | 6.3 | 36.4 |
The quantitative comparison reveals several important patterns across phylogenetic lineages. Yellow and orange FPs typically exhibit the highest brightness values, exemplified by mLemon (derived from A. victoria GFP) and mNeonGreen (from the cephalochordate Branchiostoma lanceolatum) [37] [83]. This follows fundamental photophysical principles: blue fluorophores have smaller extinction coefficients due to their smaller conjugated systems, while red fluorophores suffer from reduced quantum yields due to increased molecular flexibility [37]. The brightness peak in the middle of the visible spectrum represents an optimal compromise between absorption capacity and emission efficiency.
The phylogenetic origin of FP scaffolds influences multiple performance characteristics. While A. victoria-derived proteins (e.g., mEGFP, mVenus) remain widely used, cephalochordate-derived proteins like mNeonGreen offer superior brightness [37]. Similarly, Discosoma-derived red proteins (e.g., mCherry, mLychee) demonstrate the tradeoffs necessary for red-shifted emission, including longer maturation times and moderate quantum yields [83]. Recent protein engineering efforts have addressed these limitations through targeted mutagenesis; for instance, the introduction of the S131P mutation in Discosoma-derived red FPs eliminates residual oligomerization while maintaining bright fluorescence [83].
Experimental Methodologies for Metric Quantification
Determining Photostability and Environmental Sensitivity
The measurement of FP performance metrics requires standardized experimental protocols to enable direct comparisons. For photostability assessment, purified proteins are embedded in polyacrylamide gels or microdroplets and subjected to controlled illumination, with fluorescence decay monitored over time [37]. Measurements should be performed at multiple illumination intensities to determine the acceleration factor (α), which quantifies the supra-linear bleaching behavior [37]. Cellular photostability assays express FPs in the desired host system (e.g., E. coli or mammalian cells) and monitor fluorescence decay during continuous imaging, providing context for environmental effects on bleaching rates [37].
For maturation kinetics, bacterial systems expressing the FP are treated with protein synthesis inhibitors (e.g., chloramphenicol), and the increase in fluorescence is monitored until plateau [83]. The maturation half-time is determined by fitting the fluorescence recovery curve to a first-order exponential. This parameter is particularly critical in fast-dividing systems like bacteria, where slow maturation leads to fluorescence dilution before chromophore formation [83]. pH stability is quantified by measuring fluorescence intensity across a pH gradient, with the pKa representing the pH at which fluorescence is reduced by half [37].
Diagram 1: Experimental workflow for comprehensive FP performance characterization
Assessing Oligomerization Status and Cellular Performance
Determining the monomeric character of FPs is critical for fusion protein applications. The organized smooth endoplasmic reticulum (OSER) assay is a standard approach, where the FP is targeted to the cytoplasmic side of the endoplasmic reticulum membrane [83]. Multimeric FPs cause quantifiable morphological abnormalities in this membrane system, while true monomers preserve normal architecture. However, some FPs that pass OSER assays may still cause aggregation in specific cellular contexts, necessitating validation in the intended experimental system [83].
For cellular brightness assessment, a robust approach involves creating tandem fusions with a reference FP (e.g., mCherry) and expressing these constructs in the target cell type [83]. Flow cytometry analysis then measures the ratio of the test FP fluorescence to the reference FP fluorescence, normalizing for expression variability. This approach provides a more accurate prediction of in vivo performance than in vitro measurements alone, as it accounts for cellular environment effects, maturation efficiency, and protein stability in the relevant biological context.
The Scientist's Toolkit: Essential Research Reagents
Table 2: Key Research Reagents for Fluorescent Protein Characterization
| Reagent/Method | Primary Function | Application Context | Key Considerations |
|---|---|---|---|
| Spectrofluorometer [37] | Measure excitation/emission spectra and quantum yield | In vitro characterization of purified FPs | Correct for instrument-specific detection efficiency |
| Protein Purification Systems [37] | Obtain purified FPs for quantitative measurements | Determination of extinction coefficients and in vitro photostability | Tags (e.g., His-tag) should not interfere with FP fluorescence |
| Polyacrylamide Matrix [37] | Immobilize FPs for standardized photostability measurements | Controlled bleaching experiments under defined conditions | Minimizes diffusion effects during prolonged illumination |
| Flow Cytometry [83] | High-throughput screening of FP variants and cellular brightness | In vivo performance assessment in cellular contexts | Enables analysis of large cell populations for statistical power |
| OSER Assay System [83] | Evaluate oligomerization state and aggregation potential | Determining suitability for fusion protein applications | Some FPs may pass OSER but still aggregate in specific contexts |
| Site-Directed Mutagenesis [83] | Engineer improved FP variants through targeted mutations | Rational design of FPs with enhanced properties | High-throughput screening needed to identify beneficial mutations |
| Microplate Readers [83] | Medium-throughput analysis of spectral properties | Screening multiple FP variants or conditions simultaneously | Enables pH stability profiling and maturation kinetics |
Structural Basis for Performance Diversity
The diverse performance characteristics across the GFP phylogenetic family originate from structural variations within the conserved β-barrel fold. This 11-stranded β-barrel structure surrounds a central α-helix containing the chromophore, which forms autocatalytically from three amino acid residues (Ser65-Tyr66-Gly67 in A. victoria GFP) [84] [37]. The precise chemical environment within this barrel dictates critical photophysical properties including the chromophore's protonation state, spectral characteristics, and photostability [84].
Structural studies of GFP in different protonation states reveal how atomic-level interactions govern performance metrics. Crystallographic analyses of GFP variants stabilized in distinct states (A-state: protonated/neutral, B-state: deprotonated/negatively charged, I-state: intermediate) identify specific hydrogen-bonding networks that modulate spectral properties [84]. For example, the distance between His148 Nδ1 and the chromophore Oη atom distinguishes these states (2.85 Å in I-state, >3.0 Å in A-state), explaining spectral differences through precise structural arrangements [84]. Similarly, interactions between residue 203 (Val/Thr) and the chromophore influence spectral properties through van der Waals contacts and conformational effects [84].
Diagram 2: Structural basis for FP performance characteristics
Protein engineering exploits these structural insights to enhance performance metrics. The development of mChartreuse from superfolder GFP introduced six mutations (N39I, I128S, D129G, F145Y, N149K, V206K) that collectively improved brightness, photostability, and monomericity [83]. Similarly, the creation of mLychee from mApple incorporated multiple substitutions (V71A, L85Q, S131P, K139R, A145P, I210V) to eliminate residual oligomerization while maintaining bright red fluorescence [83]. These rational engineering approaches demonstrate how phylogenetic diversity provides the structural raw material for optimization.
Implications for Phylogenetic Research and Biotechnology
The quantitative benchmarking of fluorescent protein performance metrics has profound implications for both basic evolutionary studies and applied biotechnology. For researchers investigating the phylogenetic distribution of GFP-like proteins, understanding how natural sequence variation translates to functional differences provides insights into evolutionary mechanisms [17] [38]. The presence of GFP homologs in cnidarians, copepods, and cephalochordates suggests an ancient origin with subsequent lineage-specific diversification, potentially driven by ecological factors such as light environments in marine habitats [38].
From a practical perspective, the expanding palette of engineered FPs enables sophisticated experimental designs in cell biology and drug development. The combination of bright, photostable FPs covering the full visible spectrum facilitates multicolor imaging approaches for tracking multiple cellular components simultaneously [37] [83]. Furthermore, the development of FPs with specialized properties, such as the GFP-inspired solvatochromic dyes for monitoring GPCR conformational changes, extends the utility of these tools beyond simple labeling to molecular sensing [43]. As quantitative benchmarking continues to refine our understanding of performance tradeoffs, researchers can make increasingly informed selections matching FP characteristics to experimental requirements across the phylogenetic spectrum.
The discovery of the Green Fluorescent Protein (GFP) from the jellyfish Aequorea victoria marked a revolutionary advance in biological imaging, providing scientists for the first time with a genetically encoded fluorescent marker that requires no external substrates or cofactors besides molecular oxygen for chromophore maturation [85]. This unique property enabled its use as an excellent in vivo marker for gene expression and protein localization across diverse biological systems [17]. The subsequent exploration of GFP-like proteins from non-bioluminescent Anthozoa species such as reef corals revealed a remarkable natural diversity of fluorescent proteins, spanning the entire visible spectrum and including even non-fluorescent chromoproteins [17] [26].
This article provides an in-depth technical guide for researchers navigating the selection of the four principal fluorescent protein analogs: GFP, CFP (Cyan Fluorescent Protein), YFP (Yellow Fluorescent Protein), and RFP (Red Fluorescent Protein). Framed within the context of phylogenetic distribution research, we will explore how understanding the evolutionary relationships and structural variations among these proteins informs their practical application in modern biological research and drug development.
Technical Specifications and Phylogenetic Origins
Core Structural and Spectral Characteristics
All fluorescent proteins share a fundamental structural motif: a tightly interwoven eleven-stranded β-barrel that encapsulates and protects the central chromophore [85]. The chromophore itself forms spontaneously from a tripeptide sequence (most commonly Ser65-Tyr66-Gly67 in GFP) through a self-catalyzed cyclization, dehydration, and oxidation process [85]. Spectral diversity arises from modifications to this chromophore's covalent structure and the electrostatic environment created by surrounding amino acids [17] [26].
Table 1: Key Spectral Properties and Brightness Comparison of Major Fluorescent Proteins
| Protein | Ex Max (nm) | Em Max (nm) | Extinction Coefficient (M⁻¹cm⁻¹) | Quantum Yield | Relative Brightness | Maturation Time |
|---|---|---|---|---|---|---|
| GFP | 399 [85], 488 [86] | 509 [86], 511 [85] | ~30,000 [85] | ~0.60-0.70 [85] | 1.0 (Reference) | <10 min (sfGFP) [86] |
| CFP | 434 [86], 436 [26], 452 [86] | 476 [86], 485 [26] | ~26,200 (Azurite) [85] | ~0.55 (Azurite) [85] | ~0.4 [26] | Varies by variant |
| YFP | 514 [86], 525 [87] | 527 [86], 538 [87] | ~83,400 (YPet) [87] | ~0.76 (YPet) [87] | ~1.2 (YPet) [87] | ~10-15 min [86] |
| RFP | 558 [86], 574 [17] | 583 [86], 610 [17] | ~72,000 (mCherry) [86] | ~0.22 (mCherry) [86] | ~0.5 [86] | ~15 min (mCherry) [86] |
Phylogenetic Distribution and Evolutionary Relationships
Phylogenetic analysis of GFP-like proteins reveals that they fall into distinct evolutionary clades, with proteins of different emission colors often appearing within the same clade [17]. This topology suggests multiple recent events of color conversion throughout evolution [17]. The phylogenetic pattern and color diversity observed in reef Anthozoa are believed to result from a balance between selection for particular colors and mutation pressure driving color conversions [17].
The derivation of CFP and YFP from the original Aequorea victoria GFP through protein engineering stands in contrast to the discovery of RFP homologs, which were primarily isolated from marine Anthozoa such as Discosoma coral species [17] [26]. This evolutionary divergence is reflected in their chromophore structures, with red-emitting proteins possessing extended chromophore conjugation through an additional oxidation step [17].
Figure 1: Phylogenetic relationships and engineering derivatives of major fluorescent protein classes. CFP and YFP were engineered from Aequorea victoria GFP, while RFPs were primarily discovered in Anthozoa species.
Experimental Considerations and Methodologies
Critical Selection Parameters for Experimental Design
When selecting fluorescent proteins for research applications, several technical parameters must be considered beyond basic spectral characteristics:
Oligomerization Tendency: Early fluorescent proteins, particularly RFPs like DsRed, had a strong tendency to form tetramers, which could interfere with the function of fusion proteins [86]. Most modern variants have been engineered to be truly monomeric (denoted by an "m" prefix, as in mCherry) [86].
Photostability: This critical parameter varies significantly among FPs, ranging from as short as 100ms (EBFP) to over an hour (mAmetrine1.2) under continuous illumination [86]. Photostability can be affected by experimental conditions including excitation light intensity, pH, and temperature [86].
Environmental Sensitivity: Some FPs, particularly YFPs, exhibit high sensitivity to environmental factors such as pH and chloride ion concentration [87]. While this can be a limitation for general use, it has been successfully exploited in the development of biosensors for measuring cytoplasmic pH and chloride concentrations [87].
Maturation Efficiency and Temperature Sensitivity: The time required for chromophore formation and folding varies considerably among FPs, from under 10 minutes for superfolder GFP to over 10 hours for DsRed [86]. Furthermore, folding efficiency and fluorescent intensity can be significantly affected by temperature, with different variants optimized for different temperature ranges [86].
Advanced Applications and Experimental Protocols
FRET-Based Biosensing Experiments
A primary application of CFP and YFP has been in FRET (Förster Resonance Energy Transfer) experiments, where they function as a matched donor-acceptor pair [87] [26]. The CyPet-YPair represents a specially engineered CFP-YFP pair with four-fold enhancement in ratiometric FRET efficiency compared to earlier variants [87].
Table 2: Research Reagent Solutions for Key Experimental Applications
| Application | Essential Reagents | Function/Purpose | Example Variants |
|---|---|---|---|
| FRET Sensing | CFP-YFP FRET pair, Target expression vector, Transfection reagent | Measure protein interactions, conformational changes, second messengers | Cerulean-Venus, CyPet-YPet [87] [26] |
| Multicolor Labeling | Multiple FPs with distinct spectra, Appropriate filter sets | Simultaneously track multiple cellular structures or proteins | ECFP, EGFP, EYFP, mCherry [86] [26] |
| Long-term Tracking | Monomeric FPs, Selection antibiotics (e.g., Geneticin/G418) | Stable cell line generation for extended time-lapse studies | CFP, YFP (superior to GFP for stability) [88] |
| Photoswitching | Photoactivatable FPs (e.g., PA-GFP, Dendra2) | Track protein dynamics, super-resolution imaging | Dendra2, mEOS proteins [86] |
Protocol: FRET-Based Protease Sensor Assembly and Detection
- Vector Construction: Clone genes encoding CFP and YFP into expression vector with protease cleavage sequence (e.g., LVPRGS for thrombin) inserted within flexible linker [89].
- Cell Transfection: Transfert host cells (e.g., HEK293) using lipid-based transfection reagents following manufacturer protocols [88].
- Control Imaging: Acquire baseline fluorescence using 458nm (CFP excitation) and 514nm (YFP excitation) laser lines on confocal microscope [26].
- Protease Application: Add purified protease (e.g., thrombin) to cell culture medium at predetermined concentration.
- FRET Measurement: Monitor decrease in FRET efficiency via acceptor photobleaching or ratio-metric imaging over time [26].
Stable Cell Line Generation for Long-Term Studies
A critical consideration for drug development applications is the generation of stably expressing cell lines. Research has demonstrated that while establishing stable GFP-expressing cell lines is notoriously difficult, stable fluorescent clones expressing either CFP or YFP can be successfully established and maintained for up to 140 population doublings [88].
Protocol: Establishing Stable CFP/YFP-Expressing Cell Lines
- Vector Preparation: Use plasmid vectors (e.g., pEGFP-N3 derivative) containing FP gene plus neomycin resistance gene under SV40 promoter [88].
- Cell Transfection: Seed mammalian cells (e.g., Lig-8 rat hepatic ASCs) at 1/10 confluency and transfect using lipid-based transfection reagents [88].
- Antibiotic Selection: Begin selection with 0.5 mg/ml Geneticin 48 hours post-transfection, maintaining selection for 14 days with medium changes every 3 days [88].
- Clonal Isolation: Isplicate well-separated colonies using cloning cylinders, expand in 25-cm² flasks, and screen for fluorescence intensity and stability [88].
- Cryopreservation: Freeze early passage stocks in liquid nitrogen for long-term storage [88].
Figure 2: Decision workflow for selecting and implementing fluorescent proteins in biological experiments, highlighting key technical considerations at each stage.
Comparative Analysis and Selection Guidelines
Performance Trade-offs and Practical Limitations
Each class of fluorescent protein presents distinct advantages and limitations that must be weighed for specific applications:
GFP Variants offer excellent brightness and photostability but have demonstrated cytotoxicity in long-term studies, making them less suitable for stable cell line generation [88]. The requirement for molecular oxygen in chromophore maturation also limits their use in anaerobic environments [86].
CFP Variants such as Cerulean provide good photostability and have proven invaluable as FRET donors, though their brightness is generally lower than GFP or YFP [26]. The excitation of CFP in the violet-blue range may also present challenges with some microscope systems.
YFP Variants including YPet and Venus are among the brightest fluorescent proteins available but exhibit significant pH sensitivity and chloride sensitivity [87]. Their superior brightness and successful use in stable cell lines make them excellent choices for long-term tracking studies [88].
RFP Variants like mCherry provide the advantage of longer wavelength excitation and emission, which results in reduced autofluorescence and better tissue penetration [86]. However, they typically have lower quantum yields and may require longer maturation times [86].
Optimal Selection Strategy for Research Applications
Based on the technical characteristics and experimental considerations discussed, the following selection strategy is recommended:
For Multicolor Imaging and Co-localization Studies: Select FPs with well-separated emission spectra (e.g., ECFP, EYFP, mCherry) and verify that your imaging system has appropriate excitation sources and emission filters for clear spectral separation [86].
For FRET-Based Biosensors: Utilize optimized pairs such as Cerulean-Venus or CyPet-YPet, which have been specifically engineered for enhanced FRET efficiency [87] [26]. Ensure proper linker design between FPs to maintain sensor flexibility while avoiding steric hindrance.
For Long-Term and Stem Cell Studies: Prefer CFP or YFP over GFP due to their superior performance in establishing stable expressing cell lines with low variability in expression [88].
For Deep Tissue Imaging and In Vivo Applications: Select red-shifted variants such as mCherry or other RFPs, as longer wavelengths experience less scattering and autofluorescence in biological tissues [86].
For Dynamic Processes with Rapid Turnover: Choose rapidly maturing FPs such as superfolder GFP (<10 minutes) or mCherry (~15 minutes) to ensure adequate temporal resolution of the biological process under investigation [86].
The selection of appropriate fluorescent protein analogs represents a critical decision point in experimental design that directly impacts data quality and biological interpretation. By understanding the phylogenetic origins, structural basis of spectral variation, and practical performance characteristics of GFP, CFP, YFP, and RFP, researchers can make informed choices that align with their specific experimental requirements. The continued development of enhanced variants with improved brightness, photostability, and specialized functions promises to further expand the utility of these remarkable molecular tools in biological research and drug development.
The discovery and subsequent engineering of Green Fluorescent Protein (GFP) analogs from marine corals have revolutionized biomedical research, providing a versatile palette of genetically encoded probes for imaging and biosensing. This review offers a comparative analysis of key coral-derived fluorescent proteins (FPs), including mCherry, Midori-ishi Cyan (MiCy), and monomeric Kusabira-Orange (mKO). We examine their phylogenetic origins, structural characteristics, spectrochemical properties, and experimental applications, with a particular focus on their roles in FRET-based assays and super-resolution microscopy. By synthesizing quantitative data on their brightness, photostability, and oligomeric states, this analysis aims to guide researchers in selecting appropriate FPs for specific investigative contexts, from tracking protein localization to probing drug-protein interactions.
The green fluorescent protein (GFP) from the jellyfish Aequorea victoria serves as the foundational progenitor of a now-extensive family of fluorescent proteins [90]. Its intrinsic ability to form a chromophore through autocatalytic post-translational modifications without the need for external cofactors made it a revolutionary tool for live-cell imaging [28]. Subsequent biodiversity exploration revealed that GFP-like proteins are widely distributed among Anthozoans, including corals and anemones, leading to a significant phylogenetic expansion of the available color palette [91] [92].
Proteins such as mCherry, MiCy, and Kusabira-Orange represent key milestones in this expansion. Unlike the GFP from Aequorea victoria, many coral-derived proteins exhibit red-shifted emissions, which are highly advantageous for deeper tissue imaging and multicolor experiments due to reduced light scattering and lower autofluorescence [92]. The drive to improve these proteins for practical research has involved extensive protein engineering to enhance their brightness, maturation efficiency, and oligomeric state—often converting native tetramers into functional monomers to prevent aberrant protein aggregation in fusion constructs [93] [90].
This review provides a technical guide to these novel coral proteins, framing their development and utility within the broader context of GFP analog research. It is intended to equip scientists and drug development professionals with the data necessary to leverage these tools in advanced imaging and screening protocols.
Structural and Spectrochemical Properties
The diverse spectral characteristics of fluorescent proteins are governed by the precise chemical structure of their chromophores and the microenvironment created by the surrounding β-barrel.
Chromophore Structure and Maturation
All GFP-like proteins share a common fold—an 11-stranded β-barrel that encloses a central α-helix containing the chromophore-forming tripeptide [28] [90]. The chromophore is formed via a series of autocatalytic steps: cyclization of the tripeptide, dehydration, and finally oxidation by molecular oxygen to create a conjugated π-electron system responsible for fluorescence [90].
- GFP and Cyan/Yellow Variants: The classic GFP chromophore is p-hydroxybenzylideneimidazolinone, derived from Ser-Tyr-Gly [90]. Cyan (CFP) and yellow (YFP) proteins are typically generated through point mutations in this core Aequorea GFP structure. For instance, the Y66W mutation in CFP substitutes tryptophan, while T203Y in YFP introduces π-stacking that red-shifts the emission [91] [90].
- Red Fluorescent Proteins (RFPs): Coral-derived red proteins like mCherry feature an extended conjugation system. Their chromophore is formed from a Gln-Tyr-Gly sequence that undergoes additional oxidation to form a dihydroxybenzylideneimidazolinone structure, which lowers the energy required for excitation and emission, resulting in red light [90] [92].
The following diagram illustrates the phylogenetic and structural relationships between the major classes of fluorescent proteins discussed in this review.
Comparative Spectral Characteristics
The practical utility of an FP is largely determined by its spectrochemical properties. The table below provides a quantitative comparison of the key proteins discussed.
Table 1: Spectrochemical Properties of Selected Fluorescent Proteins
| Protein | Origin | Ex (nm) | Em (nm) | Brightness (% of EGFP) | Maturation Time (t₀.₅, min) | Oligomeric State | Primary Applications |
|---|---|---|---|---|---|---|---|
| EGFP | A. victoria | 488 | 507 | 100 [91] | ~30 [90] | Monomer | General tagging, localization |
| MiCy | Acropara coral | 472 | 495 | High for CFP class [90] | Not Reported | Homodimer [90] | FRET partner with mKO [94] [90] |
| mKO | Engineered from DsRed | 548 | 559 | Improved brightness [90] | Rapid [90] | Monomer [90] | FRET acceptor, multicolor imaging |
| mCherry | Engineered from DsRed | 587 | 610 | Moderate [93] | Very rapid [93] | Monomer [93] | Protein fusions, multicolor imaging, biosensors |
Key to Properties:
- Ex/Em: Excitation and Emission maxima.
- Brightness: A product of the extinction coefficient and quantum yield, often reported relative to EGFP.
- Maturation t₀.₅: Time required for half of the synthesized protein to become fluorescent.
The Midori-ishi Cyan (MiCy) protein exhibits a red-shifted emission for a CFP, and its fluorescence lifetime is a single exponential (3.4 ns), which is beneficial for FLIM-FRET experiments [90]. mCherry is prized for its rapid maturation and low acid sensitivity, making it a robust tag for various cellular environments [93]. Monomeric Kusabira-Orange (mKO) was developed through extensive mutagenesis to improve folding efficiency, solubility, and brightness, creating a reliable orange-emitting monomer [90].
Experimental Applications and Methodologies
The distinctive properties of these FPs have enabled their use in a wide array of sophisticated experimental protocols.
FRET-Based Assays for E3 Ligase Characterization
Fluorescence Resonance Energy Transfer (FRET) is a powerful technique for monitoring molecular interactions. A prime application is the MiCy/mKO-based FRET assay for characterizing E3 ubiquitin ligase activity, which is crucial for targeted protein degradation and drug discovery [94].
Detailed Experimental Protocol:
- Construct Design: Create genetic fusions where the protein of interest (e.g., an E3 ligase) is tagged with the donor FP MiCy, and its potential substrate or binding partner is tagged with the acceptor FP mKO.
- Cell Transfection: Introduce the constructed plasmids into an appropriate mammalian cell line (e.g., HEK293) using standard transfection methods.
- Image Acquisition: Image live cells using a confocal microscope equipped with suitable lasers and filters.
- Donor channel (MiCy): Excite with a 458 nm or 442 nm laser; collect emission between 470-500 nm.
- Acceptor channel (mKO): Excite with a 543 nm or 561 nm laser; collect emission between 560-590 nm.
- FRET channel: Excite with the donor laser (442/458 nm) and collect emission in the acceptor range (560-590 nm).
- Data Analysis: Calculate the FRET efficiency using acceptor photobleaching or ratiometric methods. A high FRET signal indicates molecular proximity and interaction between the E3 ligase and its target [94].
This assay can determine optimal E2 conjugating enzymes, lysine linkage specificity, and be adapted for high-throughput screening of E3 ligase inhibitors, as demonstrated by its use in screening against bacterial E3 ligases like Shigella IpaH [94].
Advanced Imaging Techniques
Red and far-red FPs like mCherry are indispensable for advanced microscopy, particularly super-resolution techniques that break the diffraction limit of light.
- PALM/STORM: Photoswitchable or photoconvertible FPs enable single-molecule localization microscopy. While mCherry itself is not a photoswitchable protein, it is part of the broader RFP family whose members are routinely engineered for such techniques. These methods allow for spatial resolution down to 10-20 nm, enabling the visualization of fine cellular structures [92].
- Multicolor Imaging: The distinct emission of mKO and mCherry allows for their simultaneous use with GFP variants in multicolor imaging experiments to track multiple cellular targets simultaneously. This requires careful spectral unmixing to resolve the signals [91] [92].
The following workflow diagram outlines a typical experimental pipeline for a FRET-based screening assay using these coral proteins.
The Scientist's Toolkit: Essential Research Reagents
Successful experimentation with these proteins relies on a suite of specific reagents and materials.
Table 2: Essential Research Reagents and Resources
| Reagent/Resource | Function/Description | Example Use Case |
|---|---|---|
| mCherry Plasmid | Mammalian expression vector encoding monomeric mCherry. | Creating C-terminal fusions to study protein localization and dynamics in live cells [93]. |
| MiCy and mKO Plasmids | Donor and acceptor pair for FRET, often available as fusion templates. | Building biosensors to study E3 ligase activity or protein-protein interactions [94] [90]. |
| HEK293 or HeLa Cell Lines | Robust, easily transfected mammalian cell lines for protein expression. | General protein expression, localization studies, and FRET assays [94] [93]. |
| Confocal Microscope | Imaging system with laser lines at ~458 nm (MiCy), ~561 nm (mCherry), and sensitive spectral detectors. | Performing FRET experiments and high-resolution live-cell imaging [94] [91]. |
| Ubiquitin Ligase Assay Kit | Commercial kit containing E1, E2, ubiquitin, and reaction buffers. | In vitro validation of E3 ligase function and inhibitor efficacy [94]. |
The comparative analysis of mCherry, MiCy, and Kusabira-Orange underscores the remarkable success of phylogenetic exploration and protein engineering in expanding the fluorescent protein toolkit. Each protein offers a unique combination of spectral properties, maturation kinetics, and operational stability, making them suited for different niches in biomedical research. mCherry stands as a versatile, monomeric red marker; the MiCy/mKO pair forms a spectrally optimal FRET couple; and all contribute to the multi-color palette enabling complex live-cell imaging.
Future developments in this field will continue to focus on overcoming existing challenges. For RFPs, these include the trade-off between fluorescence and photostability, and the dependence on oxygen for maturation [92]. Ongoing efforts aim to develop brighter, more photostable far-red and near-infrared proteins from both engineered coral proteins and phytochrome-based systems for deeper tissue imaging. Furthermore, the refinement of photoswitchable and photoconvertible variants will continue to drive innovations in super-resolution microscopy, allowing researchers to visualize the intricate workings of cellular machinery at unprecedented resolution. As these tools evolve, they will undoubtedly unlock new frontiers in our understanding of cellular function and accelerate the development of novel therapeutic agents.
Evaluating Cytotoxicity and Immunogenicity Profiles Across Different Protein Variants
Green Fluorescent Protein (GFP) and its analogs are not uniformly distributed across the evolutionary tree. These proteins have been identified in phylogenetically diverse organisms including cnidarians (such as Aequorea victoria), copepods, and cephalochordates (amphioxus) [11]. This sparse distribution across distantly related lineages presents an evolutionary conundrum – whether GFP genes were inherited from a common bilaterian ancestor or acquired through multiple independent horizontal gene transfer events [11]. In cephalochordates, GFP-encoding genes show lineage-specific expansion largely driven by tandem duplications, with strong purifying selection shaping their evolution [11]. The presence of GFP in the early-diverged cephalochordate lineage Asymmetron confirms that GFP genes were likely present in ancestral cephalochordates, though their origin remains uncertain [11]. This phylogenetic framework provides essential context for understanding how different GFP variants may exhibit distinct cytotoxicity and immunogenicity profiles based on their evolutionary origins and structural characteristics.
Cytotoxicity Profiles of GFP Variants
Mechanisms of Cellular Toxicity
GFP cytotoxicity manifests through multiple mechanisms that can confound experimental results, particularly in in vivo cell tracking studies [66]. The primary cytotoxic mechanisms include:
Reactive Oxygen Species (ROS) Generation: GFP expression can induce direct cellular injury through production of reactive oxygen species, particularly during fluorescence excitation [66]. The chromophore formation process involving oxidation of the cyclized chromophore may contribute to oxidative stress within expressing cells [66].
Apoptosis Induction: GFP-transfected cells show increased susceptibility to programmed cell death, though the exact pathways remain under investigation [66]. This apoptosis induction appears to be independent of immune-mediated mechanisms.
Organelle-Specific Toxicity: Studies have documented GFP-related cytotoxicity in specific cellular compartments including:
- Cardiac cytotoxicity: GFP expression has been associated with functional impairment in cardiac cells [66]
- Actin-myosin dysfunction: Muscle cells exhibit disrupted contractile apparatus function when expressing GFP [66]
- Neurodegeneration: Neural cells show particular vulnerability to GFP-associated toxicity [66]
The table below summarizes the key cytotoxic effects observed across different experimental systems:
Table 1: Documented Cytotoxic Effects of GFP and Analogs
| Cytotoxic Effect | Experimental System | Proposed Mechanism |
|---|---|---|
| General Photocytotoxicity [66] | Multiple cell types | ROS generation during light excitation |
| Apoptosis Induction [66] | Various primary cells | Activation of programmed cell death pathways |
| Oxidative Stress [66] | Transplanted hepatocytes | Mitochondrial dysfunction |
| Cardiac Cytotoxicity [66] | Cardiac tissue models | Disruption of electrophysiological function |
| Actin-Myosin Dysfunction [66] | Muscle cells | Interference with contractile apparatus |
| Neurodegeneration [66] | Neural tissue | Unknown, possibly protein misfolding |
Structural Determinants of Cytotoxicity
GFP cytotoxicity is influenced by specific structural features of the protein. The mature GFP structure consists of 238 amino acids forming an 11-stranded β-barrel with an α-helix running through the center [72]. The chromophore, formed from residues Ser-65, Tyr-66, and Gly-67, is encapsulated within this barrel structure which protects it from quenching by water and oxygen [72]. Despite this protective architecture, aspects of the chromophore formation process – particularly the oxidation step requiring molecular oxygen – may contribute to cellular stress [72].
Protein engineering efforts have modified GFP's spectrochemical properties through targeted mutations, which may simultaneously affect cytotoxicity profiles. For instance, the S65T mutation promotes ionization of the phenol group in the chromophore, eliminating the 395nm absorption peak and creating a single-peak variant with potentially different cellular interactions [72]. Similarly, T203Y and other aromatic substitutions introduce π-stacking interactions that stabilize the excited chromophore, causing red-shifted emission in yellow fluorescent proteins (YFPs) [72]. These structural modifications likely alter the protein's interactions with cellular components, potentially modulating their toxicological profiles.
Immunogenicity of GFP Variants
Immunological Recognition Mechanisms
GFP functions as a potent immunogen when introduced into non-native biological systems, primarily through T-cell mediated immunity [66]. The immunological recognition process involves:
MHC Class I Presentation: As an intracellular antigen, GFP is processed through the endogenous pathway and presented on the cell surface by major histocompatibility complex (MHC) class I molecules [66]. This presentation enables recognition by cytotoxic T-lymphocytes (CTLs) leading to elimination of GFP-expressing cells.
Strain-Specific and Administration Route-Dependent Responses: The immunogenicity of GFP exhibits significant variation based on host factors and delivery methods [66]. Studies in Balb/c and C57BL/6 mice demonstrate that both genetic background and administration route (intravenous versus subcutaneous) substantially influence the magnitude of immune responses against GFP-expressing cells [66].
CD8+ T-Cell Activation: In rhesus macaques receiving autologous GFP-transduced CD34+ hematopoietic stem cells, robust CD8+ T-cell responses develop against the GFP antigen, resulting in targeted elimination of transduced cells [66]. Similar findings in human studies show that dendritic cells expressing GFP elicit specific cytotoxic T-cell responses [68].
The diagram below illustrates the primary immunological recognition pathways for GFP:
Immunogenicity in Research and Therapeutic Contexts
The immunogenicity of GFP presents particular challenges for experimental biology and therapeutic applications:
Cell Tracking Limitations: In transplantation studies using GFP-labeled cells, the GFP antigen elicits immune responses that compromise long-term tracking [66]. Hepatocytes from GFP transgenic rats transplanted into wild-type recipients show rapid decline compared to wild-type hepatocytes in GFP-transgenic hosts, accompanied by CD4+ and CD8+ T-cell infiltration [66].
Immunosuppression Strategies: The immunogenicity of GFP can be mitigated through pharmacological intervention. Cyclosporine administration in canine models enables stable GFP expression for over 800 days following hematopoietic stem cell transplantation with GFP-transduced cells [66]. Similarly, tacrolimus treatment reduces rejection of GFP-expressing hepatocytes by inhibiting T-cell activation pathways [66].
Dendritic Cell Enhancement: Paradoxically, GFP's immunogenicity can be harnessed experimentally. Dendritic cells expressing GFP enhance immunogenicity and elicit specific cytotoxic T-cell responses, suggesting potential applications as a functional adjuvant [68]. When used to present tumor antigens like MART1, GFP-expressing dendritic cells generate higher percentages of antigen-specific CD8+ T cells compared to non-GFP controls [68].
Table 2: Documented Immunogenic Responses to GFP and Experimental Modulators
| Immunogenic Response | Experimental System | Immunomodulatory Approach |
|---|---|---|
| T-cell/MHC I Mediated Immunogenicity [66] | Balb/c mice model | Strain selection (C57BL/6 shows lower response) |
| Variation by Administration Route [66] | Subcutaneous vs intravenous delivery | Route optimization |
| Transplanted Hepatocyte Rejection [66] | Rat transplantation model | Tacrolimus immunosuppression |
| CD8+ T-cell Reaction to Hematopoietic Stem Cells [66] | Rhesus macaque model | Cyclosporine treatment |
| Specific Cytotoxic T-cell Responses [68] | Human dendritic cells | Utilization as immunogenicity enhancer |
Experimental Assessment Methodologies
Cytotoxicity Assay Protocols
Reactive Oxygen Species Detection Assay
- Cell Preparation: Plate cells expressing GFP variants at 1×10^4 cells/well in 96-well plates. Include non-transfected controls and positive controls (e.g., H~2~O~2~-treated cells) [66].
- Staining: Load cells with 10μM CM-H~2~DCFDA dye in serum-free medium for 30 minutes at 37°C [66].
- Excitation and Measurement: Excite GFP at appropriate wavelength (395nm/475nm for wild-type) while measuring DCF fluorescence at 535nm [66].
- Data Analysis: Calculate ROS levels as fold-increase over non-transfected controls. Normalize to protein content or cell number [66].
Apoptosis Assessment via Flow Cytometry
- Cell Harvesting: Collect GFP-expressing cells and controls, wash with cold PBS [66].
- Staining: Resuspend 1×10^5 cells in binding buffer containing Annexin V-FITC and propidium iodide (PI) [66].
- Analysis: Analyze by flow cytometry within 1 hour using FITC (GFP) and PI channels. Gate on GFP-positive population and quantify Annexin V/PI staining [66].
- Interpretation: Early apoptotic: Annexin V+/PI-; Late apoptotic/necrotic: Annexin V+/PI+ [66].
Immunogenicity Evaluation Workflows
T-Cell Activation Assay
- Antigen Presentation Cell (APC) Preparation: Generate dendritic cells from peripheral blood monocytes using GM-CSF and IL-4 differentiation [68].
- T-Cell Isolation: Isve CD8+ T cells from autologous peripheral blood using magnetic bead separation [68].
- Co-culture: Incubate GFP-expressing APCs with T cells at 10:1 ratio in RPMI-1640 with 10% FBS for 5 days [68].
- Activation Assessment: Measure IFN-γ production by ELISA and perform Cr^51^ release cytotoxicity assays against GFP-expressing targets [68].
In Vivo Immunogenicity Tracking
- Cell Transplantation: Introduce GFP-expressing cells into immunocompetent hosts via relevant route (intravenous, subcutaneous, or organ-specific delivery) [66].
- Monitoring Schedule: Assess cell persistence at days 3, 7, 14, 28, and 48 post-transplantation using fluorescence imaging, PCR, or flow cytometry [66].
- Immune Cell Infiltration Analysis: Harvest tissues for immunohistochemistry staining of CD4+ and CD8+ T cells in GFP-positive areas [66].
- Immunosuppression Testing: Administer tacrolimus (1mg/kg/day) or cyclosporine (15mg/kg/day) to parallel animal cohorts to confirm T-cell mediated rejection mechanisms [66].
The experimental workflow for comprehensive assessment of GFP variant immunogenicity is illustrated below:
Emerging Engineering Strategies for Improved GFP Variants
Machine Learning-Assisted Protein Engineering
Recent advances in protein language models (PLMs) have enabled more sophisticated engineering of GFP variants with potentially reduced cytotoxicity and immunogenicity [95]. The METL (mutational effect transfer learning) framework combines biophysical simulation data with experimental sequence-function information to predict protein properties including fluorescence, thermostability, and potentially biocompatibility [95]. This approach excels in challenging protein engineering tasks like generalizing from small training sets and position extrapolation [95]. When trained on just 64 GFP sequence-function examples, METL can design functional GFP variants, demonstrating the potential of biophysics-based protein language models for creating improved variants [95].
Complementary approaches using convolutional neural network (CNN) ensembles trained on deep mutational scanning data can predict GFP variant brightness from ESM-2 protein language model embeddings [96]. This lightweight framework combining computational prediction with laboratory validation enables rapid iteration through GFP variant design cycles, completing the entire pipeline from conception to laboratory validation in under four months [96].
Structure-Function Optimization Strategies
Protein engineering efforts have developed numerous GFP variants with modified spectral properties and potentially improved biocompatibility:
Folding Optimization: Superfolder GFP (sfGFP) contains multiple mutations that improve folding efficiency and resistance to aggregation [97]. These mutations enhance fluorescence intensity and potentially reduce endoplasmic reticulum stress associated with GFP expression.
Chromophore Environment Engineering: Mutations such as F64L improve folding at 37°C and enhance fluorescence in mammalian cells, while S65T produces a single excitation peak at 488nm that is more suitable for laser-based imaging systems [72].
Oligomerization State Modification: Native GFP-like proteins from Anthozoa often exist as tetramers, but engineering efforts have created monomeric versions with reduced potential for disrupting cellular processes [17] [72]. For example, mFruit proteins (including mCherry, mOrange, etc.) were derived from Discosoma sp. red fluorescent protein through extensive mutagenesis to create monomeric variants [72].
Research Reagent Solutions Toolkit
Table 3: Essential Research Reagents for GFP Cytotoxicity and Immunogenicity Assessment
| Reagent / Method | Application Context | Key Function |
|---|---|---|
| ESM-2 Protein Language Model [96] | GFP variant design | Generates protein sequence embeddings for predictive modeling |
| METL Framework [95] | Biophysics-informed protein engineering | Integrates molecular simulation data with experimental results |
| Convolutional Neural Network (CNN) Ensemble [96] | Brightness prediction | Predicts fluorescence from ESM-2 embeddings using ensemble approach |
| Multi-wavelength Analytical Ultracentrifugation (MW-AUC) [97] | Complex stoichiometry analysis | Defines oligomerization state and composition of GFP variants |
| Microscale Thermophoresis (MST) [97] | Binding affinity measurement | Determines dissociation constants in nanomolar range |
| Isothermal Titration Calorimetry (ITC) [97] | Thermodynamic characterization | Measures binding thermodynamics of GFP-protein interactions |
| Flow Cytometry with Annexin V/PI [66] | Apoptosis detection | Quantifies cell death pathways in GFP-expressing cells |
| ELISPOT / Intracellular Cytokine Staining [68] | T-cell response measurement | Detects antigen-specific T cell activation against GFP |
| Cyclosporine / Tacrolimus [66] | Immunosuppression control | Inhibits T-cell mediated rejection of GFP-expressing cells |
The phylogenetic distribution of GFP analogs across diverse organisms provides a rich natural repertoire for protein engineering efforts aimed at reducing cytotoxicity and immunogenicity. The sparse distribution of these proteins across cnidarians, copepods, and cephalochordates suggests either multiple horizontal gene transfer events or loss from most intermediate lineages [11]. This evolutionary history has produced structural diversity that can be leveraged to develop improved variants.
Future directions in GFP variant optimization should integrate phylogenetic analysis with machine learning approaches. The METL framework demonstrates how biophysical simulation data can enhance protein language models for engineering tasks [95]. Similarly, CNN ensembles trained on deep mutational scanning data enable prediction of functional properties from sequence embeddings [96]. These computational approaches, combined with high-throughput experimental validation, will accelerate development of GFP variants with reduced cytotoxicity and immunogenicity for specific research and therapeutic applications.
As these engineering efforts progress, comprehensive assessment using the methodologies outlined in this review – including ROS detection, apoptosis assays, T-cell activation measurements, and in vivo persistence tracking – will be essential for characterizing new variants. The research reagent toolkit provides investigators with essential resources for these evaluations. Through continued refinement of GFP variants based on evolutionary insights and advanced protein engineering strategies, researchers can develop increasingly biocompatible fluorescent proteins that minimize confounding effects in biological applications.
Within the broader context of researching the phylogenetic distribution of Green Fluorescent Protein (GFP) analogs, this technical guide addresses a critical intermediate step: the validation of these biomarkers in complex, physiologically relevant models. GFP-like proteins, with their origins in Cnidaria and presence in diverse phyla including Copepoda and Cephalochordata, represent a unique family with varied spectral properties and potential functions [17] [38]. Before these functions can be fully understood in an evolutionary context, rigorous validation in advanced experimental systems is paramount. This document provides an in-depth examination of GFP performance in two such systems—transgenic organisms and 3D tissue cultures—summarizing quantitative data, detailing experimental protocols, and providing essential resources for researchers and drug development professionals.
GFP Performance in Transgenic Organisms
The use of transgenic organisms is a cornerstone for validating gene function and promoter specificity in vivo. Recent research in poplar (Populus trichocarpa) exemplifies the rigorous validation of tissue-specific expression using GFP reporters.
Quantitative Validation of Fiber-Dominant Promoters
In a 2025 study, researchers identified and validated nine xylem fiber-dominant expressing gene promoters in poplar. The table below summarizes the quantitative expression data for these candidates, based on reverse transcription quantitative polymerase chain reaction (RT-qPCR) analysis of laser capture microdissection (LCM)-isolated cells [98].
Table 1: Expression Profiles of Validated Fiber-Dominant Promoters in Transgenic Poplar
| Candidate Gene | Relative Expression in Fibers (IN8) | Relative Expression in Vessels (IN4) | Fiber-Dominant Specificity |
|---|---|---|---|
| PtrMYB103 | High | Negligible | Yes |
| PtrIRX12 | High | Negligible | Yes |
| PtrMAP70 | High | Negligible | Yes |
| PtrFLA12-2 | High | Negligible | Yes |
| PtrFLA12-6 | High | Negligible | Yes |
| PtrMYB52 | High | Negligible | Yes |
| PtrLRR-1 | High | Negligible | Yes |
| PtrKIFC2-3 | High | Negligible | Yes |
| PtrNAC12 | High | Negligible | Yes |
Experimental Protocol: Validating Promoter Specificity with GUS in Transgenic Poplar
The following protocol details the methodology for creating and analyzing transgenic poplars to validate promoter activity, as described in the aforementioned study [98].
Step 1: Identification of Candidate Promoters
- Cross-database analysis: Perform a cross-analysis of single-cell RNA sequencing (scRNA-seq) data and tissue-specific expression databases (e.g., AspWood for poplar) to identify genes with potential fiber-dominant expression.
- Laser Capture Microdissection (LCM) and RT-qPCR verification:
- Harvest stem internodes from three-month-old wild-type plants.
- Prepare fresh-frozen tissue sections and use LCM to isolate pure populations of fiber and vessel cells from distinct internodes (e.g., IN4 for vessels, IN8 for fibers).
- Extract RNA from the isolated cells and perform RT-qPCR using cell-type-specific marker genes (e.g., PtrMYB161 for fibers, PtrXCP1 for vessels) to validate sample purity.
- Analyze the expression of the candidate genes in the purified cell populations to confirm fiber-dominant expression.
Step 2: Vector Construction and Plant Transformation
- Promoter cloning: Clone the approximately 1.5-2.0 kb genomic DNA region upstream of the translation start site of each candidate gene.
- Reporter vector construction: Fuse the cloned promoter fragment upstream of the β-glucuronidase (GUS) reporter gene in a binary vector suitable for plant transformation.
- Transgenic plant generation: Transform the constructed vector into wild-type poplar using Agrobacterium-mediated transformation. Regenerate transgenic plantlets on selective medium.
Step 3: Histochemical GUS Staining and Analysis
- Plant material preparation: Collect tissues from one-month-old plantlets (primary growth) and three-month-old transgenic trees (secondary growth), including leaves, stems, and roots.
- Staining procedure: Incubate tissues in GUS staining solution (containing X-Gluc) at 37°C for several hours or overnight.
- Analysis: Stop the reaction and clear tissues of chlorophyll by immersion in ethanol. Examine tissues under a microscope for the presence and spatial distribution of blue precipitate, indicating promoter activity.
GFP Performance in 3D Tissue Cultures
Three-dimensional tissue cultures have emerged as a powerful tool to bridge the gap between traditional 2D cell culture and in vivo models, offering a more physiologically relevant context for studying cell biology, drug penetration, and therapeutic efficacy.
Applications in Cancer Research and Nanomedicine
3D spheroids, particularly those modeling therapy-resistant cancers like pancreatic ductal adenocarcinoma (PDAC), recapitulate key tumor features such as hypoxia, fibrosis, and chemoresistance, which are difficult to study in 2D [99]. The penetration and distribution of therapeutics, including nanocarriers (NCs), can be visually tracked using fluorescent tags, including GFP. For instance, light sheet microscopy has been identified as superior to confocal microscopy for visualizing the tissue penetration of fluorescently labeled polymeric NCs within these dense structures [99].
Table 2: Characteristics of Representative 3D Spheroid Models for Drug Delivery Studies
| Spheroid Model Component | Description | Function/Relevance in Validation |
|---|---|---|
| Cell Types | PDAC cells (e.g., PANC-1, BxPC-3) co-cultured with human pancreatic stellate cells (hPSCs) | Recapitulates the tumor microenvironment (TME) and stromal interactions, influencing drug response. |
| Scaffold/Matrix | Matrigel (for PANC-1 models) or collagen I | Provides 3D structural support and mimics the extracellular matrix (ECM), creating a barrier to drug/NC penetration. |
| Culture Platform | Low-attachment 96-well plates with centrifugal aggregation | Enables high-throughput, reproducible spheroid formation. |
| Key Readout | Spheroid size, morphology, viability (e.g., via live-cell imaging), and NC penetration depth (via fluorescence microscopy) | Quantifies model integrity and drug/NC efficacy and distribution. |
Experimental Protocol: Establishing a Co-culture Spheroid Model for NC Penetration Studies
This protocol, adapted from recent research, outlines the generation of PDAC spheroids for the evaluation of nanocarriers [99].
Step 1: Spheroid Generation
- Cell preparation: Culture PDAC cells (e.g., PANC-1) and human pancreatic stellate cells (hPSCs). Use a defined, serum-free medium like the Oredsson Universal Replacement (OUR) medium to avoid batch-to-batch variability and improve physiological relevance [100].
- Co-culture seeding: Mix PDAC cells and hPSCs in a desired ratio (e.g., 1:1) and seed them into low-attachment 96-well plates.
- Aggregation: Centrifuge the plates to force cells into close contact at the bottom of the wells, promoting aggregation.
- Matrix supplementation: For certain cell lines (e.g., PANC-1), supplement the culture medium with 2.5% Matrigel to enhance spheroid compaction and density. Incubate under standard conditions.
Step 2: Model Validation and Characterization
- Growth monitoring: Use a live-cell analysis system (e.g., Incucyte) to monitor spheroid formation and growth over time (e.g., 10 days), tracking metrics like diameter and circularity.
- Viability assessment: Perform fluorescence-based viability assays (e.g., using Calcein-AM for live cells and propidium iodide for dead cells) at various time points.
- Morphological analysis: Employ techniques like scanning electron microscopy (SEM) or digital light microscopy for detailed morphological characterization, noting that fixation methods can alter spheroid morphology and should be standardized [101].
Step 3: Drug/Nanocarrier Treatment and Imaging
- Treatment: Add fluorescently tagged NCs (e.g., GFP-tagged) or drug-loaded NCs to the spheroid culture.
- Penetration imaging: After an appropriate incubation period, image the spheroids using light sheet microscopy to accurately visualize and quantify the depth and distribution of the GFP signal within the 3D structure. Confocal microscopy should be avoided for penetration studies due to limited depth capability and light scattering artifacts [99].
- Efficacy analysis: Assess the therapeutic efficacy of drug-loaded NCs by measuring spheroid viability and growth inhibition compared to controls.
The Scientist's Toolkit: Essential Research Reagent Solutions
The table below lists key reagents and materials essential for conducting validation experiments in the complex models discussed herein.
Table 3: Research Reagent Solutions for Validation in Complex Models
| Reagent/Material | Function in Validation | Example Application |
|---|---|---|
| GFP and Variants | Visual reporter for gene expression, protein localization, and cell tracking. | Ptr promoter::GUS analysis in poplar; tagging nanocarriers for penetration studies [98] [99]. |
| scRNA-seq Databases | Identifying cell-type-specific gene expression patterns for promoter discovery. | Screening for fiber-dominant genes in poplar wood formation [98]. |
| Laser Capture Microdissection (LCM) | Isolation of pure cell populations from complex tissues for transcriptomic analysis. | Isulating xylem fiber and vessel cells for RT-qPCR validation [98]. |
| GUS Staining System | Histochemical detection of promoter activity in transgenic plants. | Visualizing spatial activity of fiber-dominant promoters in poplar stem sections [98]. |
| Open Access, Xeno-Free Media (e.g., OUR Medium) | Chemically defined cell culture medium that enhances reproducibility and physiological relevance. | Culturing 3D spheroids and adapting cell lines for robust, ethical in vitro models [100]. |
| Light Sheet Fluorescence Microscope | High-resolution, low-phototoxicity imaging of large, light-scattering samples like 3D spheroids. | Visualizing the penetration depth of GFP-tagged nanocarriers in tumor spheroids [99]. |
| 3D Scaffolds (e.g., PCL-based) | Providing structural and biophysical support for 3D cell culture, mimicking the ECM. | Creating scaffold-based 3D tumor models for high-throughput drug screening [100]. |
Visualizing Experimental Workflows
The following diagrams, generated using Graphviz DOT language, illustrate the core experimental workflows for validating GFP and its applications in the complex models discussed.
Diagram 1: Transgenic Organism Validation Workflow
Diagram 2: 3D Spheroid Validation Workflow
Conclusion
The phylogenetic distribution of GFP analogs reveals a remarkable story of evolutionary innovation, providing researchers with an extensive toolkit that has fundamentally transformed biomedical research. The foundational diversity of these proteins enables sophisticated methodological applications in drug discovery and cellular imaging, yet requires a careful, informed approach to troubleshooting issues of cytotoxicity, immunogenicity, and proper data interpretation. The comparative analysis of available variants allows for the strategic selection of optimal tools, balancing spectral properties with biological compatibility. Future directions point toward the engineering of next-generation fluorescent proteins with minimal immunogenic potential, faster maturation times, and further redshifted spectra for deeper tissue imaging. The integration of these optimized tools with advanced models like 3D organoids and in vivo imaging systems, coupled with AI-driven protein design, promises to unlock new frontiers in understanding disease mechanisms and developing novel therapeutics.
References
- 1. GFP: the green revolution | Nature Cell Biology [https://www.nature.com/articles/milelight18]
- 2. A Brief History of GFP - by Smrithi Sunil [https://www.asimov.press/p/gfp]
- 3. Ancestral Protein‐Based Lighting - PMC - PubMed Central - NIH [https://pmc.ncbi.nlm.nih.gov/articles/PMC12412002/]
- 4. FRET and mechanobiology - PMC - PubMed Central - NIH [https://pmc.ncbi.nlm.nih.gov/articles/PMC2794131/]
- 5. Förster resonance energy transfer [https://en.wikipedia.org/wiki/F%C3%B6rster_resonance_energy_transfer]
- 6. Fluorescence Resonance Energy Transfer (FRET) ... [https://evidentscientific.com/en/microscope-resource/knowledge-hub/techniques/fluorescence/fret/fretintro]
- 7. Synthetic green fluorescent protein (GFP) chromophore ... [https://www.sciencedirect.com/science/article/abs/pii/S0925400518305586]
- 8. Applications of the green fluorescent protein in cell biology ... [https://www.nature.com/articles/nbt1097-961]
- 9. Fluorescent proteins from nonbioluminescent Anthozoa ... [https://pubmed.ncbi.nlm.nih.gov/10504696/]
- 10. The molecular properties and applications of Anthozoa ... [https://www.scilit.com/publications/d8cea644d1bc5bed80533914ee82d6e9]
- 11. The evolution of genes encoding for green fluorescent ... [https://www.nature.com/articles/srep28350]
- 12. Non-excitable fluorescent protein orthologs found in ... [https://bmcecolevol.biomedcentral.com/articles/10.1186/s12862-016-0738-5]
- 13. De Novo Assembly and Characterization of Four ... [https://pmc.ncbi.nlm.nih.gov/articles/PMC4632063/]
- 14. Green fluorescent proteins show divergent patterns among ... [https://link.springer.com/article/10.1007/s00338-025-02781-z]
- 15. Integrative phylogenomics sheds light on the diversity and ... [https://pmc.ncbi.nlm.nih.gov/articles/PMC11896703/]
- 16. Green fluorescent proteins in receptor research [https://www.sciencedirect.com/science/article/abs/pii/S1056871904000656]
- 17. Diversity and evolution of the green fluorescent protein family [https://pmc.ncbi.nlm.nih.gov/articles/PMC123635/]
- 18. Diversity and Evolution of Coral Fluorescent Proteins [https://journals.plos.org/plosone/article?id=10.1371/journal.pone.0002680]
- 19. Green fluorescent protein-like proteins in reef Anthozoa ... [https://pubmed.ncbi.nlm.nih.gov/12502888/]
- 20. Green Fluorescent Protein-like Proteins in Reef Anthozoa ... [https://www.jstage.jst.go.jp/article/csf/27/5/27_5_343/_article/-char/en]
- 21. An Engineered Monomeric Zoanthus sp. Yellow ... [https://www.sciencedirect.com/science/article/pii/S1074552113003128]
- 22. Retracing Evolution of Red Fluorescence in GFP-Like ... [https://pmc.ncbi.nlm.nih.gov/articles/PMC2877551/]
- 23. Trade-Offs Associated with Photoprotective Green ... [https://www.frontiersin.org/journals/marine-science/articles/10.3389/fmars.2018.00011/full]
- 24. Anthozoa Fluorescent Proteins - Zeiss Campus [https://zeiss-campus.magnet.fsu.edu/articles/probes/anthozoafps.html]
- 25. Green fluorescent protein [https://en.wikipedia.org/wiki/Green_fluorescent_protein]
- 26. The Fluorescent Protein Color Palette [https://evidentscientific.com/en/microscope-resource/knowledge-hub/techniques/confocal/applications/fpcolorpalette]
- 27. Review GFP Family: Structural Insights into Spectral Tuning [https://www.sciencedirect.com/science/article/pii/S1074552108002755]
- 28. Green fluorescent protein: A perspective - PMC [https://pmc.ncbi.nlm.nih.gov/articles/PMC3190146/]
- 29. Simulating green fluorescent proteins: The potential of ... [https://arabjchem.org/simulating-green-fluorescent-proteins-the-potential-of-fluorescent-aptamers-and-peptides-for-biosensing-and-imaging/]
- 30. EGFP :: Fluorescent Protein Database [https://www.fpbase.org/protein/egfp/]
- 31. Two-photon excitation and emission spectra of the green ... [https://pubmed.ncbi.nlm.nih.gov/15725123/]
- 32. The evolution of genes encoding for green ... fluorescent proteins [https://www.nature.com/articles/srep28350?error=cookies_not_supported]
- 33. Diversity and evolution of the green family fluorescent protein [https://pubmed.ncbi.nlm.nih.gov/11929996/]
- 34. Amphioxus encodes the largest known family of green ... fluorescent [https://bmcecolevol.biomedcentral.com/articles/10.1186/1471-2148-9-77]
- 35. A highly photostable and bright green fluorescent protein [https://www.nature.com/articles/s41587-022-01278-2]
- 36. Designed active-site library reveals thousands of functional ... [https://www.nature.com/articles/s41467-023-38099-z]
- 37. Quantitative Assessment of Fluorescent Proteins - PMC [https://pmc.ncbi.nlm.nih.gov/articles/PMC4927352/]
- 38. Evolutionary and functional diversity of green fluorescent ... [https://www.sciencedirect.com/science/article/abs/pii/S0378111909003898]
- 39. Fluorescent protein tagging as a tool to define the subcellular ... [https://pmc.ncbi.nlm.nih.gov/articles/PMC3690342/]
- 40. Protein Localization [https://www.neb.com/en-us/applications/cellular-analysis/protein-localization?srsltid=AfmBOoqObTOD2-Lc9sqgjCkjRn5BlbhrO_IVRrFdJQvf0urMRQL1fTuF]
- 41. Pooled multicolour tagging for visualizing subcellular ... [https://www.nature.com/articles/s41556-024-01407-w]
- 42. Live-Cell Imaging Techniques | Learn & Share [https://www.leica-microsystems.com/science-lab/fluorescence-live-cell-imaging-techniques/]
- 43. Monitoring GPCR conformation with GFP-inspired dyes [https://www.sciencedirect.com/science/article/pii/S2589004224016912]
- 44. Progress and Prospects in FRET for the Investigation of ... [https://www.mdpi.com/2079-6374/15/9/624]
- 45. Finding the partner: FRET and beyond [https://www.sciencedirect.com/science/article/abs/pii/S001448272400257X]
- 46. Engineering a new tripartite split-ccGFP system from ... [https://www.nature.com/articles/s41598-025-24657-6]
- 47. FRETting about the affinity of bimolecular protein– ... [https://pmc.ncbi.nlm.nih.gov/articles/PMC6199148/]
- 48. High-Throughput Screening Meets AI and 3D Models [https://www.technologynetworks.com/drug-discovery/articles/how-high-throughput-screening-is-transforming-modern-drug-discovery-405922]
- 49. Permeable Hydrogel Encapsulated Osteosarcoma‐on‐a‐ ... [https://pmc.ncbi.nlm.nih.gov/articles/PMC12257891/]
- 50. High throughput drug screening platform utilizing capillary and ... [https://pubs.rsc.org/en/content/articlehtml/2025/lc/d4lc00950a]
- 51. Finding the Perfect Fit: Conformational Biosensors to ... [https://pmc.ncbi.nlm.nih.gov/articles/PMC9469492/]
- 52. Genetically encoded fluorescent biosensors for GPCR ... [https://www.frontiersin.org/journals/cell-and-developmental-biology/articles/10.3389/fcell.2022.1007893/full]
- 53. A family of GFP-like proteins with different spectral properties ... [https://pmc.ncbi.nlm.nih.gov/articles/PMC2467403/]
- 54. Very Bright Green Fluorescent Proteins from the Pontellid ... [https://journals.plos.org/plosone/article?id=10.1371/journal.pone.0011517]
- 55. and transducer-mediated GPCR conformational changes [https://www.nature.com/articles/s42003-018-0101-z]
- 56. Illuminating the complexity of GPCR pathway selectivity [https://www.sciencedirect.com/science/article/abs/pii/S0959440X21000609]
- 57. GPCR Biosensors to Study Conformational Dynamics and ... [https://pubmed.ncbi.nlm.nih.gov/39298797/]
- 58. Chemically stable fluorescent proteins for advanced ... [https://www.nature.com/articles/s41592-022-01660-7]
- 59. What is Multicolor Flow Cytometry | Cell Sorting Techniques [https://www.bdbiosciences.com/en-us/learn/applications/multicolor-flow-cytometry]
- 60. Overview of Flow Cytometry [https://www.cellsignal.com/applications/flow-cytometry/flow-cytometry-overview?srsltid=AfmBOoqV9D94llLi8M2yJ9Jxg0lmkLoZBvsy3WZ4SPIJgY5-FPQBnshx]
- 61. PXPermute reveals staining importance in multichannel ... [https://pmc.ncbi.nlm.nih.gov/articles/PMC10921034/]
- 62. Multicolor Flow Cytometry: Tips and Tools for Building ... [https://www.sigmaaldrich.com/US/en/technical-documents/technical-article/protein-biology/flow-cytometry/multicolor-flow-cytometry-tips?srsltid=AfmBOop4YbXJs0Z7fNzxdoYDuwb70DWdIzNDbMmp8AWTeRioYxk3Lv-u]
- 63. Flow Cytometry Experimental Process—Spectral versus ... [https://www.thermofisher.com/us/en/home/life-science/cell-analysis/flow-cytometry/flow-cytometry-learning-center/flow-cytometry-resource-library/flow-cytometry-methods/spectral-flow-cytometry-experimental-process.html]
- 64. High-dimensional multi-pass flow cytometry via spectrally ... [https://www.nature.com/articles/s41551-023-01144-9]
- 65. Toward an official model protein system, with GFP as ... [https://pubmed.ncbi.nlm.nih.gov/41211788/]
- 66. Cellular GFP Toxicity and Immunogenicity: Potential ... [https://pmc.ncbi.nlm.nih.gov/articles/PMC5050239/]
- 67. the case of GFP | Signal Transduction and Targeted Therapy [https://www.nature.com/articles/s41392-022-00929-9]
- 68. Green fluorescent protein expression in dendritic cells ... [https://www.sciencedirect.com/science/article/pii/S0301472X0300376X]
- 69. Immune Response to Bioluminescence Imaging Reporters ... [https://pmc.ncbi.nlm.nih.gov/articles/PMC12162783/]
- 70. Ku80 attentuates cytotoxicity induced by green fluorescent ... [https://www.sciencedirect.com/science/article/pii/S2211546312000617]
- 71. On the GFP-Based Analysis of Dynamic Concentration Profiles [https://pmc.ncbi.nlm.nih.gov/articles/PMC3945030/]
- 72. Green Fluorescent Protein: Its Development ... [https://www.jyi.org/2022-march/2022/2/28/green-fluorescent-protein-its-development-protein-engineering-and-applications-in-protein-research]
- 73. Systematic characterization of maturation time ... [https://pmc.ncbi.nlm.nih.gov/articles/PMC5765880/]
- 74. High Variation of Fluorescence Protein Maturation Times in ... [https://journals.plos.org/plosone/article?id=10.1371/journal.pone.0075991]
- 75. Maturation models of fluorescent proteins are necessary for ... [https://www.sciencedirect.com/science/article/pii/S0006349522007718]
- 76. Molecular dynamics guided identification of a brighter ... [https://www.nature.com/articles/s42004-025-01573-4]
- 77. Advances in engineering of fluorescent proteins and ... [https://pmc.ncbi.nlm.nih.gov/articles/PMC2819558/]
- 78. Options for tracking GFP-Labeled transplanted myoblasts ... [https://bmcbiotechnol.biomedcentral.com/articles/10.1186/1472-6750-14-55]
- 79. GFP-on “green mouse” model for interrogation of in vivo ... [https://www.trilinkbiotech.com/blog/gfp-on-green-mouse-model-for-interrogation-of-in-vivo-gene-editing/]
- 80. Locking the GFP Fluorophore to Enhance Its Emission ... [https://pmc.ncbi.nlm.nih.gov/articles/PMC9822164/]
- 81. Locking the GFP Fluorophore to Enhance Its Emission ... [https://pubmed.ncbi.nlm.nih.gov/36615428/]
- 82. Design strategies for fluorescent proteins/mimics and their ... [https://www.sciencedirect.com/science/article/abs/pii/S0165993619305680]
- 83. A palette of bright and photostable monomeric fluorescent ... [https://pmc.ncbi.nlm.nih.gov/articles/PMC12002091/]
- 84. Structural characterization of green fluorescent protein in ... [https://www.nature.com/articles/s41598-024-73696-y]
- 85. The fluorescent protein palette: tools for cellular imaging - PMC [https://pmc.ncbi.nlm.nih.gov/articles/PMC2910338/]
- 86. Which Fluorescent Protein Should I Use? [https://blog.addgene.org/which-fluorescent-protein-should-i-use]
- 87. GFP Derivatives: CFP and YFP [https://www.news-medical.net/life-sciences/GFP-Derivatives-CFP-and-YFP.aspx]
- 88. CFP and YFP, but Not GFP, Provide Stable Fluorescent ... [https://pmc.ncbi.nlm.nih.gov/articles/PMC2288679/]
- 89. GFP Variants with Alternative β-strands and Application as ... [https://pmc.ncbi.nlm.nih.gov/articles/PMC3756597/]
- 90. : Its Development, Protein Engineering... Green Fluorescent Protein [https://jyi.squarespace.com/2022-march/2022/2/28/green-fluorescent-protein-its-development-protein-engineering-and-applications-in-protein-research]
- 91. Olympus Microscopy Resource Center | Confocal Microscopy - The... [http://www.olympusconfocal.com/gfp/primer/techniques/confocal/applications/fpcolorpalette.html]
- 92. A detailed review of genetically encodable RFPs and far- ... [https://www.sciencedirect.com/science/article/abs/pii/S0301462225000444]
- 93. :: mCherry Database Fluorescent Protein [https://www.fpbase.org/protein/mcherry/]
- 94. Midori-ishi Cyan/monomeric Kusabira - Orange -based fluorescence... [https://pubmed.ncbi.nlm.nih.gov/27091465/]
- 95. Biophysics-based protein language models for ... [https://www.nature.com/articles/s41592-025-02776-2]
- 96. Efficient GFP variant design with a simple neural network ... [https://research.arcadiascience.com/pub/result-gfp-variant-design-nn/release/1/]
- 97. A case study with the sfGFP–nanobody complex [https://www.sciencedirect.com/science/article/pii/S0003269725000971]
- 98. Validation of Fiber-Dominant Expressing Gene Promoters ... [https://pmc.ncbi.nlm.nih.gov/articles/PMC12252207/]
- 99. A 3D spheroid model for assessing nanocarrier-based ... [https://www.nature.com/articles/s44385-025-00041-x]
- 100. Advancing humanized 3D tumor modeling using an open ... [https://www.frontiersin.org/journals/toxicology/articles/10.3389/ftox.2025.1529360/full]
- 101. Morphological characterization of 3D cell cultures ... [https://pubmed.ncbi.nlm.nih.gov/41099094/]