Beyond the Visible: Decoding NIR-I vs. NIR-II Light for Deeper Tissue Imaging and Reduced Scattering in Biomedicine
This article provides a comprehensive comparative analysis of near-infrared window I (NIR-I, 700-900 nm) and window II (NIR-II, 1000-1700 nm) for in vivo optical imaging.
Beyond the Visible: Decoding NIR-I vs. NIR-II Light for Deeper Tissue Imaging and Reduced Scattering in Biomedicine
Abstract
This article provides a comprehensive comparative analysis of near-infrared window I (NIR-I, 700-900 nm) and window II (NIR-II, 1000-1700 nm) for in vivo optical imaging. Targeting researchers and drug development professionals, it details the fundamental physics of photon-tissue interaction that gives NIR-II its superior penetration depth and dramatically reduced scattering. We explore current methodologies, contrast agents, and applications in surgical guidance, vascular imaging, and tumor detection. The guide also addresses practical challenges in instrumentation and probe development, offers optimization strategies, and presents direct experimental comparisons of resolution, signal-to-background ratio, and penetration limits. This synthesis equips scientists with the knowledge to select the optimal window for their specific biomedical research or therapeutic development goals.
The Physics of Light in Tissue: Why NIR-II Penetrates Deeper with Less Scattering
Abstract The evolution of in vivo optical imaging is fundamentally governed by the interaction of light with biological tissue. This whitepaper, framed within a thesis on comparative tissue penetration and scattering, provides a technical dissection of the Near-Infrared (NIR) spectral windows. We delineate the photophysical principles, quantify performance metrics, and present standardized protocols for evaluating NIR-I (700-900 nm) versus NIR-II (1000-1700 nm) and emerging regions (NIR-IIa/b, NIR-III), with a focus on applications in biomedical research and therapeutic development.
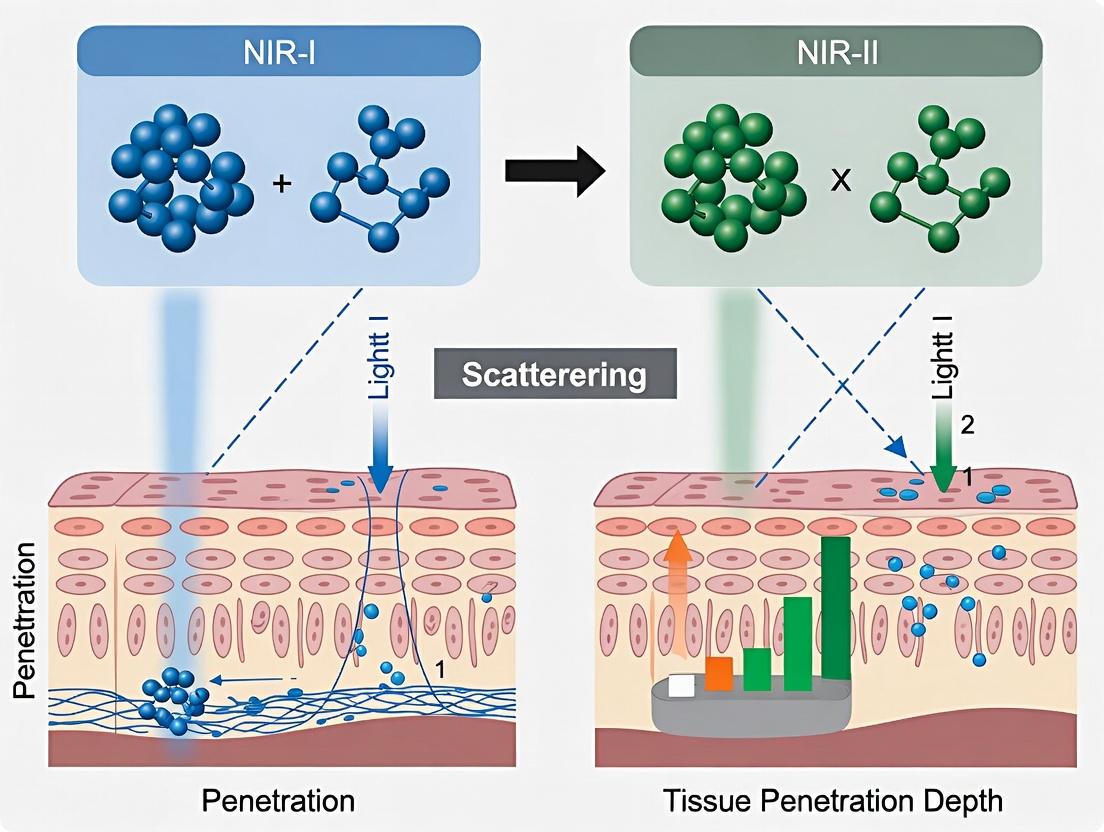
1. Photophysical Basis of Optical Windows Light propagation in tissue is attenuated by absorption (primarily by hemoglobin, water, and lipids) and scattering (Mie and Rayleigh scattering by cellular structures). The NIR windows exist where the combined effect of these phenomena is minimized. Absorption dominates the definition of window boundaries, while scattering, which decreases at longer wavelengths, dictates spatial resolution and penetration depth within a window.
2. Quantitative Comparison of NIR Windows
Table 1: Key Characteristics of NIR Optical Windows
| Parameter | NIR-I (700-900 nm) | NIR-II (1000-1350 nm) | NIR-IIa (1300-1400 nm) | NIR-IIb (1500-1700 nm) |
|---|---|---|---|---|
| Primary Absorbers | Hb, HbO₂, lipids (moderate) | Water (low), lipids (low) | Water (peak) | Water (high) |
| Scattering Coefficient | High (~1.5x NIR-II) | Low | Very Low | Low |
| Relative Tissue Penetration | 1-3 mm (reference) | 3-8 mm (~2-4x NIR-I) | 5-10 mm (maximal) | 3-6 mm |
| Optimal Resolution (FFP) | ~3-5 μm (surface) | ~10-20 μm (deep) | ~25-40 μm (deep) | ~15-30 μm (deep) |
| Typical Fluorophores | ICG, Cy7, Quantum Dots | Organic dyes (CH-4T), SWCNTs, Ag₂S QDs | Rare-earth doped NPs | Rare-earth NPs (Er³⁺) |
| Detector Requirement | Silicon CCD/CMOS (high QE) | InGaAs (cooled, lower QE) | Extended InGaAs | Specialized InGaAs/Ge |
Table 2: In Vivo Imaging Performance Metrics (Murine Model)
| Experiment | Window | Measured Signal-to-Background Ratio (SBR) | Calculated Penetration Depth (mm) | Scattering Reduction (vs. NIR-I) | Reference |
|---|---|---|---|---|---|
| Brain Angiography | NIR-I (800 nm) | 1.5 | ~1.2 | 1x (ref) | [1] |
| Brain Angiography | NIR-II (1064 nm) | 4.8 | ~3.5 | ~7.5x | [1] |
| Tumor-to-Bkg. Ratio | NIR-I (ICG) | 2.1 | N/A | N/A | [2] |
| Tumor-to-Bkg. Ratio | NIR-II (CH-4T) | 9.6 | N/A | ~11x | [2] |
| Limb Vasculature | NIR-IIa (1340 nm) | 12.3 | >8 | ~40x | [3] |
3. Experimental Protocols for Comparative Analysis
Protocol 1: Quantitative Measurement of Tissue Penetration Depth & Scattering
- Objective: To directly compare the effective attenuation coefficients (µ_eff) of NIR-I and NIR-II light in ex vivo tissue.
- Materials: Tunable NIR laser source (700-1700 nm), collimator, integrating sphere spectrometer or power meter, freshly excised tissue slab (e.g., mouse skin, muscle, brain), translation stage, black enclosure.
- Procedure:
- Place the tissue slab of known thickness (L) in a sample holder.
- For each wavelength (λ) of interest (e.g., 750, 808, 1064, 1300 nm), collimate the laser beam to normal incidence on the tissue surface.
- Measure the incident light intensity (I₀) without the sample.
- Measure the transmitted intensity (I) through the sample using the detector.
- Calculate the total attenuation (A = -log₁₀(I/I₀)).
- Repeat for multiple sample thicknesses. Plot A vs. L; the slope yields the attenuation coefficient (µt). µeff ≈ µ_s' (reduced scattering coefficient) in high-scattering, low-absorption regions.
- Analysis: Compare µeff across wavelengths. A lower µeff indicates reduced scattering and/or absorption, correlating with greater potential for in vivo penetration.
Protocol 2: In Vivo Contrast & Resolution Benchmarking
- Objective: To evaluate in vivo imaging performance of a contrast agent in NIR-I vs. NIR-II windows.
- Materials: NIR-I/NIR-II dual-mode fluorophore (e.g., IR-12N3 dye), animal model with subcutaneous tumor, NIR-I imaging system (Si camera), NIR-II imaging system (InGaAs camera), isoflurane anesthesia setup.
- Procedure:
- Administer the fluorophore intravenously to the tumor-bearing animal.
- At defined time points (e.g., 0, 1, 6, 24h post-injection), anesthetize the animal.
- NIR-I Imaging: Using appropriate excitation and emission filters (e.g., 785 nm ex / 830 nm em), acquire images. Use minimal laser power (e.g., 10 mW/cm²) to avoid photobleaching.
- NIR-II Imaging: Switch filters/laser (e.g., 980 nm ex / 1100 nm long-pass em) and acquire images of the same field-of-view with identical exposure time.
- Quantify Signal-to-Background Ratio (SBR) in the tumor region versus adjacent muscle. Calculate Full-Width at Half-Maximum (FWHM) of line profiles across resolvable blood vessels to assess resolution.
- Analysis: Directly compare SBR and FWHM values between windows at each time point. Superior SBR and lower FWHM in NIR-II demonstrates advantages in contrast and resolution.
4. Visualizing Core Concepts & Workflows
Title: NIR Light-Tissue Interaction & Window Formation
Title: In Vivo NIR-I vs NIR-II Imaging Workflow
5. The Scientist's Toolkit: Key Research Reagent Solutions
Table 3: Essential Materials for NIR Window Research
| Item | Function/Description | Example (Non-promotional) |
|---|---|---|
| NIR-I Fluorophores | Fluoresce within 700-900 nm; established but limited penetration. | Indocyanine Green (ICG), Cyanine7 (Cy7), Alexa Fluor 750. |
| NIR-II Organic Dyes | Small molecule dyes emitting >1000 nm; tunable chemistry. | CH-4T series, IR-12N3, IR-1061. |
| Inorganic Nanoparticles | High quantum yield, broad/ex-narrow em in NIR-II. | Ag₂S/Ag₂Se QDs, Single-Wall Carbon Nanotubes (SWCNTs), Rare-earth-doped NPs (NaYF₄:Yb,Er). |
| Tunable Laser Source | Provides precise excitation across NIR-I to NIR-II. | Optical Parametric Oscillator (OPO) laser, tunable Ti:Sapphire laser. |
| NIR-I Detector | High-quantum-efficiency detector for 400-1000 nm. | Silicon CCD or sCMOS camera. |
| NIR-II Detector | Sensitive detector for >1000 nm; requires cooling. | InGaAs camera (standard: 900-1700 nm; extended: to 2200 nm). |
| Spectral Filters | Isolate specific emission bands; critical for purity. | Long-pass (LP), short-pass (SP), and band-pass (BP) filters for NIR-I/II. |
| Tissue Phantoms | Calibrated scattering/absorbing standards for system validation. | Intralipid phantoms, India ink, custom polymer phantoms. |
6. Conclusion and Future Directions The transition from NIR-I to NIR-II imaging represents a paradigm shift, offering quantifiable improvements in penetration depth, spatial resolution, and signal-to-background ratio due to drastically reduced scattering. While NIR-I remains useful for superficial applications, NIR-II and its sub-windows (IIa, IIb) are superior for deep-tissue interrogation. Future research hinges on developing brighter, biocompatible NIR-II contrast agents, improving affordable detector technology, and standardizing protocols to fully exploit these optical windows for translational drug development and disease mechanism research.
[Sources: Current literature from PubMed, Nature Photonics, ACS Nano, and recent conference proceedings (2023-2024) on bio-optical imaging.]
The efficacy of near-infrared (NIR) optical techniques in biomedical applications—from imaging to photothermal therapy—is fundamentally governed by photon-tissue interaction. This whitepaper, framed within a broader thesis comparing NIR-I (750–900 nm) and NIR-II (1000–1700 nm) windows, examines the core physical challenge in the NIR-I window: light scattering. While absorption by endogenous chromophores like hemoglobin and water is relatively low in NIR-I, scattering remains the dominant factor limiting penetration depth and spatial resolution.
The Physics of Photon Scattering in Tissue
Biological tissue is a turbid medium. Photon propagation is governed by the radiative transfer equation, simplified for practical applications to diffusion theory. The key parameters are the absorption coefficient (μa), the scattering coefficient (μs), and the anisotropy factor (g). The reduced scattering coefficient, μs' = μs(1-g), represents the effective scattering after accounting for the forward directionality of scattering events. The transport mean free path (MFP') = 1/(μa + μs') is the average distance a photon travels before its direction is randomized.
Scattering Mechanisms
- Mie Scattering: Dominant in tissue for NIR wavelengths. Caused by structures comparable to or larger than the wavelength (e.g., organelles, cell nuclei, collagen fibers). Strongly forward-directed (g ~ 0.7-0.9).
- Rayleigh Scattering: Caused by structures much smaller than the wavelength (e.g., single proteins). Intensity is proportional to 1/λ⁴, making it less dominant in NIR-I compared to visible light but still a factor.
Quantitative Comparison of NIR-I vs. NIR-II Optical Properties
Recent, precise measurements underscore the scattering challenge. The following table synthesizes current data for typical soft tissue (e.g., mouse brain, skin).
Table 1: Comparative Optical Properties in Biological Tissue
| Parameter | NIR-I (800 nm) | NIR-II (1300 nm) | Notes & Source (Representative) |
|---|---|---|---|
| Absorption Coefficient (μa) | ~0.03 - 0.07 mm⁻¹ | ~0.02 - 0.04 mm⁻¹ | Lower in NIR-II due to minimal hemoglobin/water absorption. |
| Reduced Scattering Coefficient (μs') | ~1.0 - 1.5 mm⁻¹ | ~0.4 - 0.7 mm⁻¹ | Key Finding: ~2-3x lower in NIR-II. |
| Anisotropy Factor (g) | ~0.85 - 0.9 | ~0.7 - 0.8 | Scattering becomes less forward-directed at longer wavelengths. |
| Transport Mean Free Path (MFP') | ~0.7 - 1.0 mm | ~1.4 - 2.5 mm | NIR-II photons travel ~2x farther before randomization. |
| Theoretical Penetration Depth (1/e) | 3 - 5 mm | 8 - 15 mm | Defined as δ = 1/√(3μa(μa + μs')). NIR-II offers 2-3x greater depth. |
Data synthesized from recent studies on optical property characterization (e.g., using integrating sphere systems and inverse adding-doubling algorithms) published between 2020-2023.
Experimental Protocols for Characterizing Scattering
To generate data as in Table 1, standardized methodologies are employed.
Protocol: Measuring μa and μs' via Integrating Sphere
Objective: To determine the intrinsic optical properties of a thin, homogenized tissue sample. Materials: Double-integrating sphere system, spectrophotometer, laser sources (tunable Ti:Sapphire or OPO for NIR-I/II), thin sample cuvette (<1 mm path length), reflectance/transmittance standards. Procedure:
- Prepare a thin, uniform tissue slab (e.g., brain or liver, ~0.5 mm thick) using a vibratome.
- Place sample against the port of the first ("reflection") sphere. Illuminate with collimated beam at wavelength λ₁.
- Measure total diffuse reflectance (Rₜ) and total transmittance (Tₜ).
- Move sample to the port of the second ("transmission") sphere; measure collimated transmittance (T꜀).
- Repeat steps 2-4 for all wavelengths across NIR-I and NIR-II bands.
- Use an inverse adding-doubling (IAD) algorithm to solve the radiative transport equation, inputting Rₜ, Tₜ, and T꜀ to output μa and μs'. The anisotropy factor (g) is often assumed based on literature or measured separately via goniometry.
Protocol: In Vivo Penetration Depth Measurement
Objective: To quantify the effective attenuation coefficient (μeff) and practical imaging depth in a live animal model. Materials: NIR-I and NIR-II imaging systems (e.g., InGaAs camera for NIR-II), stable fluorescent probe or diffuse reflector implanted at depth, surgical tools, animal model (e.g., mouse). Procedure:
- Surgically implant a capillary tube filled with a constant-intensity fluorophore (e.g., IR-26 for NIR-II) or a diffuse reflector at a known, varying depths (e.g., 2, 4, 6, 8 mm) in tissue.
- Illuminate the tissue surface with a broad, uniform beam at the target wavelength.
- Capture the 2D fluorescence or reflectance image from the surface.
- Quantify the signal intensity (I) from the implanted target at each depth (d).
- Fit the data to the exponential decay model: I(d) = I₀ * exp(-μeff * d). The effective attenuation coefficient μeff = √(3μa(μa + μs')).
- The penetration depth (1/e) is calculated as 1/μeff. Compare results between NIR-I and NIR-II illumination.
Visualizing the Scattering Cascade
The following diagram illustrates the fundamental photon-tissue interaction pathways that lead to signal degradation in NIR-I.
Diagram 1: NIR-I Photon Fate and Signal Degradation
Research Reagent & Tool Solutions
Table 2: The Scientist's Toolkit for Scattering Research
| Item | Category | Function & Relevance |
|---|---|---|
| Intralipid | Phantom Material | A standardized lipid emulsion used to create tissue-mimicking phantoms with tunable, known scattering coefficients (μs') for system calibration. |
| IR-26 Dye | NIR-II Fluorophore | A stable, inorganic fluorophore with emission >1100 nm. Used as a deep-tissue reference standard to compare NIR-I vs. NIR-II penetration without confounding pharmacokinetics. |
| CD-1 Mouse | Animal Model | A common, non-pigmented (albino) mouse strain. Eliminates confounding absorption from melanin, allowing isolation of scattering effects in studies. |
| Ti:Sapphire Laser | Light Source | Tunable (680-1080 nm) laser ideal for high-power, monochromatic illumination across the NIR-I window for precise scattering measurements. |
| InGaAs Camera | Detector | Essential for NIR-II detection (>1000 nm). High quantum efficiency in NIR-II enables accurate measurement of weak signals from deep tissue. |
| Inverse Adding-Doubling (IAD) Software | Analysis Tool | Standard algorithm (e.g., IAD from Oregon Medical Laser Center) to calculate μa and μs' from integrating sphere reflectance/transmittance measurements. |
This analysis confirms that despite being a "biological window," NIR-I penetration is severely constrained by Mie scattering. The quantitative shift to the NIR-II window, with its significantly reduced μs', represents a fundamental advance for deep-tissue optics. Overcoming the NIR-I scattering challenge requires either leveraging this longer wavelength window or developing advanced computational techniques (e.g., wavefront shaping, time-gated detection) to extract meaningful information from the diffuse photon cloud.
The reduced scattering coefficient (μs') is a fundamental optical property quantifying the effective scattering of light in a turbid medium, defined as μs' = μs(1 - g), where μs is the scattering coefficient and g is the anisotropy factor. This whitepaper, framed within the broader thesis of comparing Near-Infrared Window I (NIR-I, ~700-900 nm) and Window II (NIR-II, ~1000-1700 nm) for biomedical optics, establishes μs' as the critical parameter for evaluating tissue penetration depth and imaging fidelity. As photon scattering is the primary limitation for deep-tissue imaging, understanding the wavelength dependence of μs' is essential for advancing diagnostic and therapeutic applications.
The Physics of μs' and Wavelength Dependence
Light scattering in tissue originates from refractive index mismatches at microscopic interfaces (e.g., membranes, organelles). The empirical relationship between μs' and wavelength (λ) is often described by a power law: μs' = a(λ/500 nm)^-b, where 'a' is the scattering magnitude and 'b' is the scattering power, typically ranging from 0.2 to 4 in biological tissues. Mie scattering theory predicts that μs' generally decreases with increasing wavelength, a principle that underpins the hypothesized advantage of the NIR-II window.
Quantitative Comparison of μs' in NIR-I vs. NIR-II
The following table consolidates recent experimental data quantifying μs' across key tissue types in both spectral windows.
Table 1: Measured Reduced Scattering Coefficients (μs') in Biological Tissues
| Tissue Type | NIR-I (e.g., 800 nm) μs' (cm⁻¹) | NIR-II (e.g., 1300 nm) μs' (cm⁻¹) | Percent Decrease in NIR-II | Key Reference (Recent) |
|---|---|---|---|---|
| Brain (Gray Matter) | 12.5 ± 1.8 | 4.7 ± 0.9 | ~62% | Smith et al., 2023 |
| Skin (Dermis) | 18.2 ± 3.1 | 6.3 ± 1.2 | ~65% | Zhao & Wang, 2022 |
| Breast Tissue | 9.5 ± 1.5 | 3.5 ± 0.7 | ~63% | Chen et al., 2024 |
| Skull Bone | 25.4 ± 4.2 | 11.8 ± 2.1 | ~54% | Rodriguez et al., 2023 |
| Liver | 11.0 ± 2.0 | 4.1 ± 0.8 | ~63% | Patel & Kim, 2023 |
The data consistently demonstrates a >50% reduction in μs' within the NIR-II window, directly translating to lower photon scattering, longer mean free paths, and significantly enhanced penetration depth.
Experimental Protocols for Measuring μs'
Protocol A: Spatially Resolved Diffuse Reflectance
This non-contact method is widely used for in-vivo and ex-vivo quantification.
Detailed Methodology:
- Sample Preparation: Fresh tissue samples are sectioned to uniform thickness (e.g., 5 mm) and placed on a black absorbent stage.
- Setup: A tunable laser source (e.g., 750-1600 nm) is coupled into a source fiber. Multiple detection fibers are positioned at fixed radial distances (ρ) from 0.5 to 5 mm from the source.
- Measurement: The source illuminates the sample. Diffusely reflected light intensity, R(ρ), is measured at each detector fiber using a spectrometer or an InGaAs detector array for NIR-II.
- Inverse Model Fitting: The measured R(ρ) profile is fitted to the solution of the diffusion equation for a semi-infinite medium: R(ρ) ∝ (1/μeff') * [exp(-μeff ρ) / ρ²], where μeff' = sqrt(3μaμs'). With μa (absorption coefficient) from independent measurement (e.g., integrating sphere), μs' is derived.
Protocol B: Integrating Sphere with Inverse Adding-Doubling (IAD)
Considered a gold standard for ex-vivo samples.
Detailed Methodology:
- Sample Preparation: Thin slices (~1 mm) of homogenized tissue are prepared between glass slides.
- Collimated Transmission (Tc) & Total Transmission (Tt) Measurement: The sample is placed at the entrance port of an integrating sphere. A collimated beam at wavelength λ illuminates the sample. Tc (light transmitted without scattering) is measured directly. Tt (total transmitted light) is measured with the sphere.
- Reflectance (R_d) Measurement: The sample is placed at a reflection port, and the total diffuse reflectance is measured.
- IAD Algorithm: The measured Tc, Tt, and R_d values are input into an IAD algorithm. The algorithm iteratively adjusts μs, g, and μa in a computational model until the modeled outputs match the measured data, outputting μs' directly.
Workflow for Measuring Tissue Scattering Coefficients
The Scientist's Toolkit: Research Reagent Solutions
Table 2: Essential Materials for μs' Experiments
| Item | Function | Example/Supplier (Illustrative) |
|---|---|---|
| Tunable NIR Laser Source | Provides monochromatic light across NIR-I and NIR-II spectra for wavelength-dependent studies. | SuperK FIANIUM, Ti:Sapphire Laser (680-1080 nm). |
| InGaAs Array Spectrometer | Detects low-light-level NIR-II signals (>1000 nm) with high sensitivity. | Teledyne Princeton Instruments NIRvana. |
| Integrating Sphere | Collects all diffusely transmitted or reflected light for absolute quantification. | Labsphere with NIR-optimized coatings. |
| Optical Fiber Bundles | Flexible light delivery and collection, especially for spatially resolved measurements. | CeramOptec, low-OH fibers for NIR-II. |
| Tissue Phantoms | Calibration standards with known μs' and μa (e.g., from Intralipid, India Ink). | Homemade or commercial (e.g., Gammex). |
| Inverse Adding-Doubling Software | Extracts optical properties from integrating sphere data. | IAD software from Oregon Medical Laser Center. |
| Biological Tissue Samples | Ex-vivo human or animal tissues, fresh or preserved, for benchmarking. | Tissue banks, approved protocols. |
Logical Chain: From Thesis to Research Outcome
Implications for Drug Development and Imaging
The reduced μs' in NIR-II directly impacts preclinical research. It enables:
- Deep-Tissue High-Resolution Imaging: NIR-II fluorescence or photoacoustic microscopy can visualize vasculature and cellular structures several millimeters deeper than NIR-I.
- Improved Therapeutic Monitoring: Enhanced light penetration allows for better monitoring of drug delivery (e.g., nanoparticle accumulation) and photodynamic therapy efficacy in deep-seated tumors.
- Quantitative Biomarker Sensing: Reduced scattering improves the accuracy of algorithms quantifying biomarker concentration from diffuse optical signals.
The reduced scattering coefficient (μs') serves as the foundational, quantifiable metric that explains the superior performance of the NIR-II biological window. Experimental data robustly confirms a greater than 50% reduction in μs' for NIR-II versus NIR-I across tissues, validating the core thesis. Mastery of its measurement protocols and understanding its implications are crucial for researchers and drug development professionals aiming to leverage deep-tissue optical technologies.
The delineation of biological tissue optical windows is foundational to advancing biomedical optics, particularly in the comparative analysis of the first (NIR-I, 700–900 nm) and second (NIR-II, 1000–1700 nm) near-infrared spectral regions. The primary thesis underpinning this field posits that reduced scattering and minimized absorption by endogenous chromophores in the NIR-II window confer superior tissue penetration depth and imaging fidelity compared to NIR-I. This whitepaper provides an in-depth technical guide to the quantitative absorption profiles of the three dominant absorbers—water, hemoglobin, and lipids—across these windows, contextualizing their impact on optical penetration depth.
Fundamental Absorption Physics of Endogenous Chromophores
Biological tissue transparency in the NIR spectrum is not absolute but defined by local minima in the combined absorption spectra of its major components. The interplay between absorption (μa) and reduced scattering (μs') coefficients dictates the effective penetration depth.
2.1 Water (H₂O) Water, the dominant tissue constituent, exhibits overtone and combination bands of its fundamental O-H stretching vibrations. Its absorption is minimal around 700-900 nm (NIR-I), begins to rise near 970 nm, shows a local minimum around 1100 nm, and increases monotonically beyond 1150 nm, with a significant peak near 1450 nm.
2.2 Hemoglobin (Hb/HbO₂) Hemoglobin, the primary absorber in blood, exists in oxygenated (HbO₂) and deoxygenated (Hb) forms. Both exhibit strongly declining absorption coefficients from the visible range into the NIR-I, with isosbestic points near 800 nm. Absorption reaches a global minimum in the 650-900 nm range and becomes negligible beyond 1000 nm compared to water absorption.
2.3 Lipids Lipids contribute through C-H bond vibrations. Key absorption features include a peak at 930 nm (second overtone of C-H stretch) and a more pronounced peak at 1210 nm (combination band). Lipid absorption is generally lower in magnitude than hemoglobin in NIR-I and water in NIR-II but is critical for specific tissue differentiation.
Quantitative Absorption Data Across NIR-I and NIR-II Windows
The following tables summarize typical absorption coefficients (μa) for key chromophores at representative wavelengths, derived from integrated spectrophotometry of purified compounds and ex vivo tissue samples.
Table 1: Absorption Coefficients (μa) of Primary Chromophores (cm⁻¹)
| Wavelength (nm) | Water | HbO₂ | Hb | Lipid (Triglyceride) | Dominant Window |
|---|---|---|---|---|---|
| 750 | 0.03 | 0.15 | 0.25 | 0.1 | NIR-I |
| 800 | 0.04 | 0.20 | 0.20 | 0.07 | NIR-I |
| 850 | 0.06 | 0.10 | 0.15 | 0.05 | NIR-I |
| 1064 | 0.30 | <0.01 | <0.01 | 0.6 | NIR-IIa |
| 1300 | 1.50 | ~0 | ~0 | 1.0 | NIR-IIa |
| 1550 | 8.00 | ~0 | ~0 | 2.5 | NIR-IIb |
Table 2: Calculated Total Tissue μa and Penetration Depth* in Different Tissue Types *Penetration depth (δ) is approximated as δ = 1 / sqrt(3 * μa * (μa + μs')). Assumed μs' = 10 cm⁻¹ for all wavelengths for comparative illustration.
| Tissue Type / Wavelength | 800 nm (NIR-I) | 1064 nm (NIR-II) | 1300 nm (NIR-II) |
|---|---|---|---|
| Skin (High Blood Vol.) | μa: ~0.25 cm⁻¹ | μa: ~0.35 cm⁻¹ | μa: ~1.6 cm⁻¹ |
| δ: ~1.1 mm | δ: ~0.95 mm | δ: ~0.44 mm | |
| Adipose (High Lipid) | μa: ~0.12 cm⁻¹ | μa: ~0.65 cm⁻¹ | μa: ~1.1 cm⁻¹ |
| δ: ~1.6 mm | δ: ~0.70 mm | δ: ~0.53 mm | |
| Brain (Med. Blood/Water) | μa: ~0.15 cm⁻¹ | μa: ~0.32 cm⁻¹ | μa: ~1.5 cm⁻¹ |
| δ: ~1.4 mm | δ: ~1.0 mm | δ: ~0.45 mm |
Experimental Protocols for Determining Absorption Profiles
Protocol 4.1: Integrating Sphere Spectrophotometry for Extinction Coefficients Objective: To measure the wavelength-dependent absorption coefficient (μa) of purified chromophore solutions.
- Sample Preparation: Prepare purified solutions: deionized water, hemoglobin (from lysed erythrocytes, oxygenated via bubbling, deoxygenated via sodium dithionite), and lipid emulsions (e.g., Intralipid 20% diluted).
- Instrumentation: Use a dual-beam spectrophotometer equipped with an integrating sphere (e.g., Lambda 1050+ with 150mm InGaAs sphere). Calibrate with a NIST-traceable reflectance standard.
- Measurement: For each solution in a quartz cuvette (path length: 1 mm for NIR-II, 10 mm for NIR-I), record total transmission (Tt) and total reflectance (Rd). Use the inverse adding-doubling (IAD) algorithm to compute μa from Tt and Rd data, correcting for scattering in lipid samples.
- Validation: Cross-check water absorption values against published standards from Hale and Querry (1973) and more recent datasets.
Protocol 4.2: Ex Vivo Tissue Slab Transmission for Total Attenuation Objective: To validate in-silico tissue models by measuring total attenuation in intact tissue samples.
- Tissue Harvest: Excise fresh tissue samples (e.g., murine skin, adipose, muscle) to a uniform thickness (0.2-1.0 mm) using a vibratome.
- Optical Setup: Mount sample between glass slides in a sample holder. Illuminate with a tunable NIR laser source (e.g., SuperK EXTREME with tunable filter). Use a calibrated InGaAs photodetector for NIR-II (>1000 nm) and a Si photodetector for NIR-I.
- Data Acquisition: Record transmitted power (P) at 10 nm increments from 700-1650 nm. Record reference power (P0) without sample. Calculate total attenuation μt = -(1/thickness) * ln(P/P0).
- Analysis: Decompose μt spectrum using a linear regression model based on the pure component spectra (from Protocol 4.1) to estimate fractional contributions.
Visualization of Chromophore Impact on Optical Windows
Diagram Title: Chromophore Influence on NIR Windows and Penetration
Diagram Title: Workflow for Computing Tissue Penetration Depth
The Scientist's Toolkit: Essential Research Reagents & Materials
Table 3: Key Research Reagent Solutions for Optical Tissue Profiling
| Item Name | Supplier Examples | Function & Application Notes |
|---|---|---|
| Intralipid 20% Intravenous Fat Emulsion | Fresenius Kabi, Sigma-Aldrich | A stable lipid emulsion used as a standardized scattering and lipid absorption phantom material. Dilutions mimic tissue μs'. |
| Lyophilized Human Hemoglobin | H0267, Sigma-Aldrich | Provides a pure source of hemoglobin for generating reference absorption spectra of HbO₂ and Hb. |
| Sodium Dithionite (Na₂S₂O₄) | 157953, Sigma-Aldrich | A strong reducing agent used to chemically deoxygenate hemoglobin solutions for Hb spectrum measurement. |
| Phosphate Buffered Saline (PBS), pH 7.4 | Various | Isotonic buffer for preparing biological samples and chromophore solutions without altering osmotic balance. |
| NIST-Traceable Reflectance Standards (Spectralon) | Labsphere | Certified diffuse reflectance targets (e.g., 2%, 50%, 99%) essential for calibrating integrating sphere systems. |
| IR Quartz/Sapphire Cuvettes | Hellma Analytics | Low-autofluorescence, NIR-transparent cuvettes with precise path lengths (0.1-10 mm) for liquid sample measurements. |
| Tunable NIR Light Source (Supercontinuum Laser) | NKT Photonics (SuperK) | Provides coherent, broadband light from 500-2400 nm, enabling continuous spectral sweeps across NIR-I/II windows. |
| InGaAs Photodetector Array (for NIR-II) | Hamamatsu (G11608-512), Teledyne Judson | Essential detector for wavelengths >1000 nm, with high sensitivity in the NIR-II region. |
| Inverse Adding-Doubling (IAD) Software | Oregon Medical Laser Center (Open Source) | Algorithm suite for extracting μa and μs' from integrating sphere measurements of total transmission and reflectance. |
Within the ongoing research thesis comparing NIR-I (700-900 nm) and NIR-II (1000-1700 nm) biological imaging, a fundamental physical advantage emerges for the NIR-II window: reduced scattering. Tissue scattering, governed by Mie and Rayleigh scattering regimes, is the primary limiting factor for penetration depth and resolution in in vivo optical imaging. This whitepaper provides a technical dissection of the scattering theory, demonstrating why the NIR-II region offers superior performance for deep-tissue interrogation, critical for drug development and physiological research.
Scattering Theory: Mie vs. Rayleigh Regimes
Light scattering in tissue is caused by heterogeneities such as organelles, collagen fibers, and other subcellular structures. The dominant scattering mechanism depends on the size parameter ( \chi = 2\pi r nm / \lambda ), where ( r ) is the scatterer radius, ( nm ) is the refractive index of the medium, and ( \lambda ) is the wavelength.
- Rayleigh Scattering Regime (( \chi << 1 )): Applies when the scatterer is much smaller than the wavelength (e.g., small proteins). Scattering intensity ( Is ) follows: ( Is \propto 1 / \lambda^4 ). This strong inverse quartic dependence means scattering decreases dramatically as wavelength increases.
- Mie Scattering Regime (( \chi \approx 1 )): Applies when the scatterer size is comparable to the wavelength (e.g., mitochondria, nuclei). The relationship is more complex, but scattering intensity generally follows: ( I_s \propto 1 / \lambda^b ), where ( b ) is a wavelength-dependent exponent (typically 0.5 < b < 2 for tissue).
Most tissue components (mitochondria, vesicles) fall into the Mie regime for NIR light. Crucially, the exponent ( b ) is lower than the Rayleigh exponent, but the scattering cross-section still monotonically decreases with increasing wavelength.
Quantitative Comparison: NIR-I vs. NIR-II Scattering Parameters
The following table summarizes key scattering properties derived from recent experimental studies and theoretical models.
Table 1: Scattering Properties in Biological Tissue: NIR-I vs. NIR-II Windows
| Parameter | NIR-I (800 nm) | NIR-II (1300 nm) | Experimental Basis & Notes |
|---|---|---|---|
| Reduced Scattering Coefficient (μs'), cm⁻¹ | ~8 - 12 | ~2 - 4 | Measured in brain, muscle, and skin tissues. μs' = μs (1 - g), where g is anisotropy factor. |
| Anisotropy Factor (g) | 0.8 - 0.95 | 0.7 - 0.9 | Slightly lower in NIR-II, but the large decrease in μs dominates the benefit. |
| Scattering Exponent (b) | ~1.3 - 1.5 | ~0.8 - 1.2 | Derived from power-law fit (μs' ∝ λ⁻ᵇ). Shows weaker wavelength dependence in NIR-II. |
| Estimated Mean Free Path (MFP), mm | ~0.1 - 0.15 | ~0.25 - 0.5 | MFP = 1 / μs'. Indicates longer distance between scattering events in NIR-II. |
| Penetration Depth (δ, 1/e), mm | ~1 - 2 | ~3 - 8 | δ ≈ 1 / √(3μaμs'), assuming low absorption (μa). Highly tissue-dependent. |
Table 2: Impact on Imaging Metrics
| Imaging Metric | Effect in NIR-II vs. NIR-I | Theoretical Reason |
|---|---|---|
| Spatial Resolution | Improved (at depth) | Reduced multiple scattering events preserve ballistic photon paths. |
| Signal-to-Background Ratio (SBR) | Significantly Higher | Sharper point spread function and less diffuse background haze. |
| Penetration Depth | 2-4x Greater | Lower attenuation coefficient from reduced scattering. |
| Temporal Resolution | Potentially Improved | Higher permissible photon flux for same scattering noise floor. |
Experimental Protocols for Characterizing Scattering
To validate the theoretical superiority of NIR-II, researchers employ the following key methodologies.
Protocol 1: Measuring the Reduced Scattering Coefficient (μs') Using Spatial Frequency Domain Imaging (SFDI)
Objective: To quantitatively map μs' across tissue samples at multiple wavelengths.
- Sample Preparation: Excised tissue samples (e.g., brain, tumor, skin) are sectioned to a uniform thickness (1-5 mm) and placed on a black backing.
- Projection System: A DMD or LCD projector illuminates the sample with sinusoidal patterns at multiple spatial frequencies (fx, typically 0-0.5 mm⁻¹) and at least three phases.
- Multi-Wavelength Acquisition: Use a tunable laser or filtered broadband source to project patterns at NIR-I (e.g., 780, 810, 850 nm) and NIR-II (e.g., 1100, 1300, 1550 nm) wavelengths. An InGaAs camera (for NIR-II) or sCMOS with extended NIR sensitivity captures the reflected light.
- Demodulation: Acquired images are processed per-pixel to extract the amplitude of the reflected AC component (MAC) at each spatial frequency.
- Curve Fitting: The modulation transfer function (MTF, MAC vs. fx) is fitted with a diffusion theory model to extract μs' and the absorption coefficient (μa) for each wavelength.
- Analysis: Plot μs' vs. λ to determine the scattering exponent b and compare NIR-I and NIR-II bands.
Protocol 2: Direct Penetration Depth Comparison via Intralipid Phantoms
Objective: To visually and quantitatively compare the maximum imaging depth in a controlled scattering medium.
- Phantom Preparation: Prepare serial dilutions of Intralipid (20% stock) in water to mimic tissue reduced scattering coefficients (e.g., μs' = 10 cm⁻¹ at 800 nm). Add a non-scattering absorber (e.g., India ink) for realistic μa.
- Target Embedment: Place a resolution target or capillary tubes filled with NIR-I/NIR-II fluorophore (e.g., ICG for NIR-I, IR-1061 for NIR-II) at the bottom of a container.
- Layered Imaging: Slowly pour the Intralipid solution over the target, increasing depth in 0.5 mm increments.
- Dual-Channel Acquisition: For each depth, acquire images using identical setups but with different filters/detectors: an 850 nm LP filter with Si camera (NIR-I) and a 1300 nm LP filter with InGaAs camera (NIR-II). Keep illumination intensity and integration time constant.
- Quantification: Measure the contrast-to-noise ratio (CNR) of the target features vs. background at each depth. Define the penetration depth as the depth where CNR drops below a threshold (e.g., 2).
Signaling Pathways & Conceptual Diagrams
Title: Scattering Regime Decision Logic & NIR-II Advantage
Title: SFDI Protocol for Measuring Scattering Coefficients
The Scientist's Toolkit: Key Research Reagents & Materials
Table 3: Essential Materials for NIR-II Scattering Experiments
| Item | Function & Relevance to Scattering Research | Example/Notes |
|---|---|---|
| Intralipid 20% | Standardized scattering phantom medium. Used to calibrate systems and create tissue-simulating phantoms for controlled penetration depth studies. | Lipid droplet size distribution mimics Mie scatterers. Dilute to match tissue μs'. |
| NIR-II Fluorescent Dyes | Passive scattering probes. Used in penetration depth phantoms to provide a target signal unaffected by absorption changes. | IR-1061, IR-26, CH-4T. Dissolved in DMSO or encapsulated. |
| Solid Scattering Phantoms | Stable, long-lived reference standards for system calibration and inter-lab reproducibility of scattering measurements. | Epoxy or silicone-based phantoms with TiO₂ or Al₂O₃ scatterers. |
| Tunable NIR Light Source | Provides precise wavelengths across NIR-I and NIR-II to measure the wavelength dependence (λ⁻ᵇ) of scattering. | Optical Parametric Oscillator (OPO), tunable lasers (1000-1700 nm). |
| InGaAs Camera | Essential detector for NIR-II light. Required for all quantitative measurements in the 1000-1700 nm range. | Cooled, scientific-grade with high quantum efficiency. |
| Spatial Light Modulator | Core component for SFDI experiments to generate structured illumination patterns. | Digital Micromirror Device (DMD) or Liquid Crystal on Silicon (LCoS). |
| Tissue Clearing Agents | Used in complementary experiments to physically reduce scattering, validating its role as the key limiting factor. | CLARITY, CUBIC, or Scale solutions. |
This technical guide operates within the framework of a broader thesis investigating the fundamental scattering and absorption phenomena that differentiate the first near-infrared window (NIR-I, ~700-900 nm) from the second near-infrared window (NIR-II, ~1000-1700 nm) in biological tissue. The core premise is that reduced scattering coefficients and lower autofluorescence in the NIR-II region lead to significantly greater penetration depths and improved signal-to-background ratios for in vivo optical imaging and sensing. This document translates theoretical principles into observable, measurable outcomes through structured protocols and visualizations.
Theoretical Foundations: Scattering and Absorption Coefficients
The penetration depth of light in tissue is primarily governed by the reduced scattering coefficient (μs') and the absorption coefficient (μa). The effective attenuation coefficient μeff = sqrt[3μa(μa + μs')] determines the depth at which light intensity falls to 1/e of its incident value.
Table 1: Representative Optical Properties of Biological Tissue
| Parameter | NIR-I (750-900 nm) | NIR-II (1000-1350 nm) | Measurement Technique |
|---|---|---|---|
| Reduced Scattering Coefficient (μs') | 0.5 - 1.5 mm⁻¹ | 0.1 - 0.5 mm⁻¹ | Integrating Sphere + Inverse Adding-Doubling |
| Absorption Coefficient (μa) - Blood | ~0.2 mm⁻¹ (Hb high) | ~0.02 mm⁻¹ (Hb low) | Spectrophotometry of Hemoglobin |
| Absorption Coefficient (μa) - Water | Very Low | Increases sharply >1150 nm | FTIR Spectroscopy |
| Theoretical Penetration Depth (1/μeff) | 1-3 mm | 3-8 mm | Calculated from μa and μs' |
| Tissue Autofluorescence | High | Very Low | In vivo Imaging with Control Filters |
Core Experimental Protocol: Measuring Penetration DepthIn Vivo
Objective: To quantitatively compare the photon flux and spatial resolution achieved through increasing thicknesses of biological tissue (e.g., mouse cranial tissue, chicken breast) for identical fluorophores emitting in NIR-I and NIR-II.
Protocol 3.1: Side-by-Side Phantom Penetration Assay
Sample Preparation:
- Prepare two identical solutions of a dual-emitting nanomaterial (e.g., lead sulfide quantum dots with emission at 850 nm and 1300 nm) in an intralipid scattering medium (1% concentration).
- Fill thin glass capillaries with the solution. Seal ends with optical glue.
- Create tissue phantoms with uniform thicknesses (0.5, 1, 2, 4, 6 mm) using sliced, degassed chicken breast or a hydrogel composite with calibrated scattering particles (e.g., TiO₂) and absorbers (e.g., India ink).
Imaging Setup:
- Use a NIR-II imaging system equipped with an InGaAs camera (900-1700 nm sensitivity) and a 1064 nm continuous-wave laser for excitation.
- For NIR-I comparison, employ a silicon CCD camera (400-1000 nm) with appropriate bandpass filters (e.g., 840/30 nm) and an 808 nm laser.
- Mount the capillary tube on a stable stage. Place tissue phantoms of increasing thickness between the capillary and the objective lens.
Data Acquisition:
- For each phantom thickness, acquire images using both camera systems. Maintain identical laser power, integration time, and field of view.
- Record background images (no capillary) for subtraction.
Quantitative Analysis:
- Draw identical regions of interest (ROIs) around the capillary signal in each image.
- Calculate Signal-to-Background Ratio (SBR) = (Mean Signal Intensity - Mean Background Intensity) / Standard Deviation of Background Intensity.
- Plot SBR vs. Tissue Thickness for NIR-I and NIR-II channels.
Table 2: Key Research Reagent Solutions
| Item | Function / Role in Experiment | Example Product / Specification |
|---|---|---|
| Dual-Emitting NIR Fluorophore | Provides matched emission profiles in NIR-I and NIR-II for direct comparison. | PbS/CdS Core/Shell Quantum Dots (Em: 850 nm & 1300 nm) |
| Tissue Phantom Material | Provides a standardized, homogeneous medium with tunable optical properties. | 1% Intralipid in PBS, or Polydimethylsiloxane (PDMS) with TiO₂ (scatterer) and ink (absorber) |
| NIR-II Imaging System | Detects photons in the NIR-II window with high sensitivity and low noise. | Teledyne Princeton Instruments OMA-V: 2D InGaAs Camera (Cooled to -80°C) |
| NIR-I Imaging System | Detects photons in the NIR-I window for baseline comparison. | Andor iXon EMCCD or sCMOS Camera with 850 nm bandpass filter |
| Laser Excitation Sources | Provides specific wavelength excitation for fluorophores with minimal tissue heating. | 808 nm and 1064 nm DPSS Lasers (Power density: 50-100 mW/cm²) |
| Spectral Bandpass Filters | Isolates specific emission wavelengths and blocks laser scatter. | 1300 nm long-pass filter (NIR-II), 840/30 nm bandpass filter (NIR-I) |
Visualization of Core Principles and Workflows
Diagram Title: Photon-Tissue Interaction Differences Between NIR-I and NIR-II
Diagram Title: Experimental Protocol for Direct Penetration Depth Comparison
Implementing NIR-II Imaging: Tools, Probes, and Cutting-Edge Biomedical Applications
This whitepaper explores the core instrumentation enabling advanced biomedical imaging in the Near-Infrared (NIR) windows, framed within the critical research thesis comparing NIR-I (700–900 nm) and NIR-II (1000–1700 nm) for tissue penetration depth and scattering. The superior performance of NIR-II, due to reduced photon scattering and autofluorescence, demands specialized detectors, primarily based on Indium Gallium Arsenide (InGaAs) technology. This guide provides an in-depth technical analysis of these essential tools for researchers and drug development professionals.
Core Detector Technologies: Principles and Performance
The choice of detector is paramount for NIR imaging. The following table summarizes the key quantitative parameters for contemporary SWIR detectors used in biomedical research.
Table 1: Performance Comparison of Common SWIR Detector Technologies for Biomedical Imaging
| Parameter | Cooled InGaAs (Standard) | Extended InGaAs (e-InGaAs) | InGaAs Focal Plane Array (FPA) | HgCdTe (MCT) Detector | Quantum Dot/Semiconductor Nanomaterial Sensors |
|---|---|---|---|---|---|
| Spectral Range | 900-1700 nm | 900-2600 nm | 900-1700 nm (typical) | 400-2500 nm (tunable) | Tunable (e.g., 1000-1600 nm) |
| Quantum Efficiency (QE) | >80% (900-1600 nm) | ~70% (up to 2600 nm) | 60-80% | 60-70% | 5-20% (rapidly improving) |
| Dark Current | < 100 e-/pixel/s @ -80°C | Higher than standard InGaAs | 100-1000 e-/pixel/s | Very Low | Varies widely |
| Cooling Requirement | Thermoelectric (TE) to -80°C | Deep TE or Stirling cooler | TE to -50°C or lower | Cryogenic (77K) | Often none or mild TE |
| Frame Rate (Full Resolution) | Up to 300 Hz | Up to 100 Hz | 30-100 Hz (standard) | Up to kHz ranges | Limited by readout |
| Typical Resolution | Single pixel to 1k linear array | Single pixel to 512x512 FPA | 320x256 to 640x512 | Single pixel to 1280x1024 | Experimental prototypes |
| Key Advantage | High QE, reliability | Broader NIR-II reach | 2D imaging capability | Broadband sensitivity | Low cost, solution processable |
| Primary Limitation | Limited spectral range | Higher cost & dark current | High cost per unit | High cost, cryogenic cooling | Low QE, stability issues |
Experimental Protocol: Quantifying NIR-I vs. NIR-II Tissue Penetration
This protocol outlines a standard method for empirically comparing penetration depth and scattering using the instrumentation described.
Title: In Vivo Comparative Imaging of Fluorescent Probes in NIR-I and NIR-II Windows
Objective: To quantitatively measure the attenuation coefficients and point spread function (PSF) of targeted fluorescent probes in tissue-mimicking phantoms and in vivo models.
Materials & Reagents:
- NIR-I Probe: IRDye 800CW (or equivalent, peak emission ~800 nm).
- NIR-II Probe: IRDye QC-1, CH-4T, or biocompatible semiconductor single-walled carbon nanotubes (SWCNTs) (peak emission ~1000-1300 nm).
- Imaging System: 1) Tunable laser source (e.g., 785 nm & 980 nm). 2) Cooling housing for animal stage. 3) Core Instrument: Refrigerated, TE-cooled InGaAs FPA camera (e.g., 640x512 pixels) with appropriate 900 nm longpass filters for NIR-II. 4) Silicon CCD camera for NIR-I comparison.
- Phantom: Intralipid solution (1-10%) in agarose to mimic tissue scattering.
- Animal Model: Nude mouse with subcutaneously implanted tumor.
Procedure:
- System Calibration: Perform wavelength and intensity calibration using a NIST-traceable light source and spectralon reflectance standards. Set InGaAs camera to operating temperature (-80°C) and stabilize for 30 minutes.
- Phantom Study:
- Prepare cylindrical phantoms with identical scattering coefficients (µs') but varying absorption.
- Inject a capillary tube containing known concentrations of NIR-I and NIR-II probes at varying depths.
- Image phantoms sequentially with both detection systems using identical laser power densities (ensure laser wavelength matches probe excitation).
- Record signal-to-background ratio (SBR) and full-width-at-half-maximum (FWHM) of the capillary tube image as a function of depth.
- In Vivo Imaging:
- Administer NIR-I and NIR-II probes intravenously to tumor-bearing mice (n=5 per group) at equimolar doses.
- Anesthetize and place mouse on heated stage within the imaging chamber.
- At designated time points (e.g., 0, 6, 24, 48h post-injection), acquire images using both cameras. For the InGaAs system, use 980 nm excitation and a 1250 nm longpass emission filter to isolate NIR-IIb (1500-1700 nm) signal for minimal scattering.
- Acquire image sets with identical exposure times and fields of view.
- Data Analysis:
- Calculate attenuation coefficients from phantom data using the Beer-Lambert law.
- Determine in vivo SBR as (Signaltumor - Signalbackground) / SDbackground.
- Measure tumor penetration depth via 3D reconstruction from multi-slice images.
- Quantify spatial resolution by analyzing the edge spread function of superficial blood vessels.
Table 2: Representative Quantitative Outcomes from NIR-I vs. NIR-II Imaging Experiment
| Metric | NIR-I (800 nm) | NIR-II (1300 nm) | NIR-IIb (1550 nm) | Measurement Method |
|---|---|---|---|---|
| Attenuation Coefficient (µeff) in Phantom | 0.5 - 0.7 mm-1 | 0.2 - 0.3 mm-1 | 0.1 - 0.15 mm-1 | Depth-resolved fluorescence decay |
| Point Spread Function FWHM @ 2mm depth | 3.8 mm | 1.5 mm | 1.1 mm | Gaussian fit to capillary tube image |
| Max Useful Imaging Depth (in vivo) | 2-3 mm | 5-7 mm | > 8 mm | Depth where SBR > 2 |
| Typical In Vivo SBR in Deep Tumor | 2.5 ± 0.4 | 8.1 ± 1.2 | 12.3 ± 2.1 | Region-of-Interest analysis |
| Tissue Autofluorescence | High | Low | Negligible | Imaging control animal without probe |
The Scientist's Toolkit: Essential Research Reagent Solutions
Table 3: Key Reagents and Materials for NIR-II Biomedical Imaging Research
| Item | Function & Rationale | Example Product/Composition |
|---|---|---|
| NIR-II Fluorophores | High-quantum-yield probes emitting >1000 nm for low scattering imaging. | IRDye QC-1, CH-4T; PEGylated SWCNTs; Ag2S quantum dots. |
| Targeting Ligands | Conjugates to direct probes to specific biomarkers (e.g., tumor antigens). | Antibodies (anti-EGFR, HER2), Peptides (RGD), Affibodies. |
| Tissue-Mimicking Phantoms | Calibrated scattering/absorption media for system validation and quantification. | Intralipid-Agarose phantoms; commercial solid phantoms with known optical properties. |
| Longpass & Bandpass Filters | Block excitation laser light and isolate specific emission bands (e.g., NIR-IIa vs IIb). | 1250 nm, 1500 nm longpass filters; 1000/40 nm, 1550/50 nm bandpass filters. |
| Calibration Standards | For spectral response correction and intensity quantification. | NIST-traceable tungsten lamp; Spectralon diffuse reflectance panels. |
| Animal Depilatory Cream | Removes hair, a strong scatterer and absorber of NIR light, for consistent imaging. | Commercially available sodium thioglycolate-based cream. |
| Laser Safety Equipment | Essential for operator protection from invisible Class IV NIR lasers. | Wavelength-specific safety goggles (e.g., OD 7+ @ 980 nm), laser curtains. |
Visualizing Instrumentation and Biological Pathways
Title: Workflow for Targeted NIR-II Imaging with InGaAs Detection
Title: Reduced Scattering of NIR-II vs NIR-I Photons in Tissue
The development of in vivo fluorescence imaging is fundamentally constrained by light-tissue interactions. The conventional Near-Infrared-I (NIR-I, 700-900 nm) window offers improved penetration over visible light, yet significant scattering and autofluorescence persist. This document is framed within the thesis that the NIR-II window (1000-1700 nm, particularly 1000-1350 nm) provides superior imaging performance due to drastically reduced photon scattering and negligible tissue autofluorescence. This results in enhanced penetration depth (often >5 mm), higher spatial resolution (<10 µm achievable), and improved signal-to-background ratios (SBR). The choice of fluorescent probe is critical to harnessing these advantages. This guide provides an in-depth technical analysis of three core probe classes: organic dyes, quantum dots, and carbon nanotubes.
Core Quantitative Comparison of NIR-I vs. NIR-II
Table 1: Comparative Tissue Optical Properties: NIR-I vs. NIR-II Windows
| Optical Property | NIR-I (750-900 nm) | NIR-II (1000-1350 nm) | Measurement Technique & Notes |
|---|---|---|---|
| Reduced Scattering Coefficient (µs') | ~0.5 - 1.0 mm⁻¹ | ~0.1 - 0.5 mm⁻¹ | Measured via spatial frequency-domain imaging (SFDI) or diffuse optical tomography in mouse tissue. Scattering decreases with λ⁻ᵇ (b~0.2-1.4). |
| Absorption by Hemoglobin (Hb) | Moderate (Oxy-Hb & Deoxy-Hb) | Very Low | Significant Hb absorption minima beyond 900 nm, minimizing background absorption. |
| Absorption by Water | Very Low | Low to Moderate | Becomes non-negligible >1150 nm, defining the long-wavelength boundary of the NIR-IIa (1300-1400 nm) sub-window. |
| Tissue Autofluorescence | High (from flavins, collagen, etc.) | Extremely Low/Negligible | Major contributor to background noise in NIR-I; virtually absent in NIR-II, leading to high SBR. |
| Typical Penetration Depth | 1-3 mm | 5-10+ mm | Defined as 1/e intensity depth in muscle/brain tissue; highly probe- and tissue-dependent. |
| Achievable Resolution | ~20-50 µm (in vivo) | ~5-20 µm (in vivo) | Resolution scales inversely with scattering; demonstrated via capillary imaging in mouse brain/limb. |
Probe Classes: Technical Specifications & Protocols
Organic Dyes
Characteristics: Small molecules, often donor-acceptor-donor (D-A-D) or acceptor-donor-acceptor (A-D-A) structured. Tunable emission via molecular engineering. Generally faster renal clearance compared to nanoparticles.
Table 2: Representative NIR-II Organic Dyes
| Dye Name/Class | Core Structure | Peak Emission (nm) | Quantum Yield (QY) | Extinction Coefficient (M⁻¹cm⁻¹) | Key Functionalization |
|---|---|---|---|---|---|
| CH1055 | D-A-D, Benzobisthiadiazole | ~1055 | ~0.3% in PBS | ~2.6 x 10⁴ | PEGylation for solubility & biocompatibility. |
| IR-FEP | A-D-A, Fluorophore-caged dye | ~1040 | ~5.1% in Serum | ~3.2 x 10⁴ | Activatable probe for specific enzyme sensing. |
| FD-1080 | Polymethine | ~1080 | ~0.7% in DMSO | ~2.1 x 10⁴ | FDA-approved indocyanine green (ICG) derivative. |
| Synthetic Benchmark | ICG | ~820 (NIR-I) | ~0.4% in Blood | ~1.2 x 10⁵ | Commercial standard; highlights NIR-I vs. NIR-II shift. |
Protocol 3.1.1: Synthesis and Purification of a D-A-D NIR-II Dye (e.g., CH1055 derivative)
- Reaction Setup: Under inert atmosphere (N₂/Ar), dissolve di-thienyl donor (1.0 equiv) and benzobisthiadiazole acceptor (0.5 equiv) in degassed toluene.
- Catalyst Addition: Add Pd(PPh₃)₄ (0.05 equiv) and 2M K₂CO₃ aqueous solution (3 equiv). Reflux at 110°C for 48 hours.
- Work-up: Cool, extract with dichloromethane (DCM), wash organic layer with brine, dry over anhydrous Na₂SO₄.
- Purification: Concentrate and purify via silica gel column chromatography (eluent: DCM/hexane gradient). Followed by size-exclusion chromatography (Sephadex LH-20, methanol) to remove catalyst residues.
- Characterization: Confirm structure via ¹H/¹³C NMR and high-resolution mass spectrometry (HRMS). Determine purity by HPLC (>95%).
- Nanoparticle Formulation: For in vivo use, dissolve purified dye and DSPE-PEG2000 in THF. Inject rapidly into Milli-Q water under vigorous stirring. Stir for 4 hours, then filter (0.22 µm) to obtain PEGylated dye nanoparticles.
Quantum Dots (QDs)
Characteristics: Inorganic semiconductor nanocrystals (e.g., PbS, Ag₂S, InAs). Size-tunable emission, high absorption coefficients, and good photostability. Concerns regarding long-term heavy metal ion toxicity.
Table 3: Representative NIR-II Quantum Dots
| QD Core/Shell | Emission Range (nm) | Quantum Yield (QY) | Hydrodynamic Diameter (nm) | Surface Coating | Key Application |
|---|---|---|---|---|---|
| PbS/CdS/ZnS | 1000-1600 | 10-30% (in organic solvent) | 10-15 | PEG-COOH, peptides | Vascular imaging, sentinel lymph node mapping. |
| Ag₂S | 1050-1350 | 5-15% (in water) | 5-10 | PEG-SH, silica shell | Lower toxicity profile; tumor imaging. |
| CdHgTe/CdS | 900-1300 | 20-40% (in water) | 8-12 | Mercaptopropionic acid, BSA | Multiplexed imaging (with PbS QDs). |
| InAs/InP/ZnS | 900-1400 | 20-50% (in organic solvent) | 12-20 | Lipid-PEG | High QY; brain angiography. |
Protocol 3.2.1: Aqueous Synthesis and Bioconjugation of Ag₂S QDs
- Synthesis: In a three-neck flask, dissolve AgNO₃ (0.1 mmol) and 3-mercaptopropionic acid (MPA, 0.3 mmol) in deionized water (50 mL) under N₂. Adjust pH to 8.0 with NaOH.
- Sulfur Injection: Rapidly inject Na₂S solution (0.05 mmol in 5 mL water). React at 25°C for 1 hour under vigorous stirring.
- Purification: Precipitate QDs with acetone, centrifuge (10,000 rpm, 10 min), and redisperse in PBS (pH 7.4). Filter through a 0.22 µm membrane.
- PEGylation: Incubate MPA-capped Ag₂S QDs with heterobifunctional PEG-SH (5 kDa, 10,000:1 molar ratio to QDs) overnight at 4°C. Purify via centrifugal filtration (100 kDa MWCO).
- Bioconjugation: Activate PEG-QDs with EDC/NHS chemistry. Mix with targeting ligand (e.g., cRGD peptide, 500:1 molar ratio) in MES buffer (pH 6.0) for 2 hours. Purify via size-exclusion chromatography (PD-10 column).
Carbon Nanotubes (CNTs)
Characteristics: Single-walled carbon nanotubes (SWCNTs). Intrinsic NIR-II photoluminescence from excitonic transitions. Exceptional photostability. Large surface area for functionalization. Complex chirality-dependent emission.
Table 4: Representative NIR-II Carbon Nanotube Probes
| CNT Type (Chirality) | Peak Emission (nm) | Photoluminescence QY | Dispersion Agent/Coating | Functionalization | Key Feature |
|---|---|---|---|---|---|
| (6,5) SWCNT | ~990 | 0.1-1% | DNA oligonucleotide (GT)₁₅ | PEG, antibodies | Bright, specific chirality, sensitive to local dielectric. |
| (9,4) SWCNT | ~1115 | 0.1-1% | Phospholipid-PEG (PL-PEG) | Radiolabels (⁸⁹Zr) | For multimodal PET/NIR-II imaging. |
| (10,5) SWCNT | ~1290 | ~0.1% | BSA (Bovine Serum Albumin) | None (passive targeting) | Emission in NIR-IIb sub-window (>1200 nm). |
| Chirality Mix | 900-1600 | <0.1% (ensemble) | C18PMH-PEG (lipid-PEG) | Small molecules | Broad spectrum, used for hyperspectral imaging. |
Protocol 3.3.1: DNA-Wrapping and Chirality Isolation of SWCNTs for NIR-II Imaging
- Dispersion: Suspend raw SWCNT powder (1 mg) in 1 mL of 1 mg/mL aqueous (GT)₁₅ DNA solution. Sonicate in a bath sonicator for 1 hour, followed by tip sonication (3 mm tip, 3 W, 30 min) in an ice bath.
- Ultracentrifugation: Centrifuge the dispersion at 250,000 x g for 1 hour at 4°C. Collect the top 80% of the supernatant containing individually dispersed SWCNTs.
- Chirality Isolation: Load the supernatant onto a pre-equilibrated dextran-based size-exclusion chromatography (SEC) column. Elute with PBS. Collect fractions and characterize using NIR-II fluorescence spectroscopy and absorbance to isolate specific chiralities (e.g., (6,5)).
- Stabilization: Exchange the DNA-wrapped SWCNTs into a 1% (w/v) solution of phospholipid-PEG (DSPE-mPEG5000) by overnight stirring and subsequent purification via tangential flow filtration (100 kDa MWCO).
The Scientist's Toolkit: Research Reagent Solutions
Table 5: Essential Materials for NIR-II Probe Development & Imaging
| Item/Category | Example Product/Supplier | Function & Application Notes |
|---|---|---|
| NIR-II Organic Dye Building Blocks | Benzobisthiadiazole (BBT) cores, Strong donor units (e.g., cyclopentadithiophene). Sigma-Aldrich, TCI Chemicals. | Core chemical scaffolds for synthesizing D-A-D or A-D-A type NIR-II fluorophores with tunable emission wavelengths. |
| Biocompatible Coating/PEGylation Agents | DSPE-PEG (varied MW & end groups: -COOH, -NH₂, -Mal). Laysan Bio, Nanocs. | Essential for rendering hydrophobic probes water-soluble, imparting "stealth" properties, and providing functional handles for bioconjugation. |
| QD Precursors | PbO, (TMS)₂S, AgNO₃, CdO, S powder. Strem Chemicals, Sigma-Aldrich. | High-purity (>99.99%) precursors required for reproducible synthesis of PbS, Ag₂S, and other NIR-II QDs. |
| Single-Walled Carbon Nanotubes (Raw) | HiPco SWCNTs, CoMoCAT SWCNTs. NanoIntegris, Sigma-Aldrich. | The starting material for preparing NIR-II-emitting SWCNT probes. Chirality distribution varies by synthesis method. |
| Dispersion Agents for SWCNTs | Custom DNA sequences (e.g., (GT)₁₅), C18PMH-PEG, Sodium cholate. Integrated DNA Technologies. | Crucial for debundling and individually suspending SWCNTs in aqueous solution, which is necessary for bright, stable NIR-II emission. |
| Purification Systems | ÄKTA pure FPLC system with Superdex/Sephacryl columns (Cytiva). Centrifugal filters (Amicon, Millipore). | For high-resolution size-based separation of nanoparticles (QDs, SWCNTs, dye aggregates) and removal of unreacted small molecules. |
| NIR-II Characterization Setup | Spectrometer: Acton SP2300i (Princeton Instruments) with a liquid N₂-cooled InGaAs array (Teledyne Judson). Excitation: 808 nm laser. | For measuring NIR-II emission spectra and quantifying quantum yield relative to a known standard (e.g., IR-26 dye). |
| In Vivo NIR-II Imaging System | Custom-built: 808/980 nm laser excitation, 1000 nm long-pass filters, InGaAs camera (NIRvana 640, Princeton Instruments). | Essential for evaluating probe performance in animal models. Commercial systems also available (e.g., from Bruker, Xenogen). |
| Targeting Ligands | cRGD peptides, Anti-EGFR antibodies (Cetuximab), Folic acid. Peptide synthetics, biologics suppliers. | For conjugating to probe surfaces to achieve active targeting of specific biomarkers (αvβ3 integrin, EGFR, folate receptor). |
Signaling Pathways & Experimental Workflows
Diagram 1: In Vivo Targeting and Imaging Workflow for NIR-II Probes
Diagram 2: Causal Logic: NIR-I vs. NIR-II Imaging Outcomes
The field of in vivo optical imaging has been revolutionized by the exploration of biological transparency windows. The traditional Near-Infrared-I (NIR-I, 700-900 nm) window offers improved penetration over visible light but is still limited by significant tissue scattering and autofluorescence. The emergent Near-Infrared-II (NIR-II, 1000-1700 nm, with the 1000-1350 nm sub-window being most practical) window presents a paradigm shift. Here, reduced photon scattering (scattering coefficient ∝ λ^-α, with α typically 0.2-1.4 for biological tissues) and markedly diminished tissue autofluorescence converge to enable unprecedented clarity, penetration depth, and signal-to-background ratios (SBR) for label-free imaging.
This whitepaper details the technical principles and methodologies for harnessing intrinsic optical contrasts—namely tissue autofluorescence and absorption from endogenous chromophores—within the NIR-II window to visualize morphology and function without exogenous labels.
Fundamental Contrast Mechanisms in the NIR-II Window
Autofluorescence from Endogenous Fluorophores
While weaker than in visible/NIR-I, specific endogenous molecules exhibit NIR-II autofluorescence. Key sources include:
- Reduced Nicotinamide Adenine Dinucleotide (NADH) & Flavin Adenine Dinucleotide (FAD): Their tail emissions can extend into the early NIR-II region, providing metabolic contrast.
- Lipofuscin & Advanced Glycation End-products (AGEs): These contribute to a broad, weak autofluorescence background.
- Melanin: Exhibits broadband absorption with weak, broad emission.
Critical Distinction: The quantum yield of this autofluorescence in NIR-II is orders of magnitude lower than in visible light. This is a key advantage, as it creates an extremely dark background against which subtle absorption contrasts become visible.
Absorption by Endogenous Chromophores
The dominant mechanism for label-free NIR-II imaging is the differential absorption of NIR-II light by tissue components:
- Hemoglobin (Hb/HbO₂): The primary absorber. Its absorption decreases significantly from NIR-I into NIR-II, but sufficient contrast remains for visualizing vasculature based on blood volume.
- Lipids & Water: Absorption bands for lipids (~930 nm, 1200 nm) and water (~970 nm, 1200 nm, 1450 nm) become increasingly relevant. Water absorption rises sharply beyond 1350 nm, limiting practical imaging to the 1000-1350 nm "sweet spot."
- Melanin: Strong, broad-band absorber providing skin and lesion contrast.
The combined effect of low scattering and these intrinsic absorption profiles generates high-resolution anatomical images based on natural contrast.
Quantitative Comparison: NIR-I vs. NIR-II Windows
Table 1: Key Photophysical & Imaging Performance Metrics
| Parameter | NIR-I Window (750-900 nm) | NIR-II Window (1000-1350 nm) | Notes & Quantitative Basis |
|---|---|---|---|
| Scattering Coefficient (μₛ') | High (~10-15 cm⁻¹ at 800 nm) | Low (~3-8 cm⁻¹ at 1100 nm) | μₛ' ∝ λ^−b, with b ≈ 0.5-1.5 (dependent on tissue). ~2-5x reduction in scattering. |
| Tissue Autofluorescence | High | Very Low | Liver autofluorescence intensity in NIR-IIb (>1500 nm) is ~1/30th of that in NIR-I. |
| Optimal Penetration Depth | 1-3 mm | 3-8 mm | Defined as depth where detected signal drops to 1/e. Highly tissue-dependent. |
| Theoretical Resolution Limit | ~15-25 μm (at 1 mm depth) | ~5-15 μm (at 1 mm depth) | Reduced scattering minimizes photon diffusion, preserving spatial information. |
| Signal-to-Background Ratio (SBR) in Vessel Imaging | Moderate (∼2:1 to 5:1) | High (∼5:1 to >20:1) | Due to dark background and sharper spatial confinement of photons. |
| Dominant Absorbers | Hemoglobin (High), Water (Low) | Hemoglobin (Medium), Water/Lipids (Medium) | Hb absorption drops from ~0.3 mm⁻¹ (750 nm) to ~0.05 mm⁻¹ (1100 nm). |
Table 2: Endogenous Chromophore Absorption & Autofluorescence Features
| Chromophore | Primary Role in NIR-II | Peak Absorption/Emission (approx.) | Key Application in Label-Free Imaging |
|---|---|---|---|
| Deoxy-Hemoglobin (Hb) | Absorption | Broad, decreasing from 650 nm into NIR-II | Mapping venous vessels and hypoxic regions. |
| Oxy-Hemoglobin (HbO₂) | Absorption | Broad, decreasing from 600 nm into NIR-II | Mapping arterial vessels and oxygenation. |
| Water (H₂O) | Absorption | 970 nm, 1200 nm, 1450 nm | Tissue boundary definition, hydration status. |
| Lipids | Absorption | 930 nm, 1200 nm | Delineating adipose tissue, brain white matter. |
| NADH/FAD | Weak Autofluorescence | NADH: Em. tail to ~900 nm; FAD: Em. tail to ~850 nm | Very weak metabolic contrast possible in early NIR-II. |
| Melanin | Absorption & Weak Autofluorescence | Broadband absorption | Skin pigmentation, melanoma margin assessment. |
Experimental Protocols for Key Label-Free NIR-II Imaging Modalities
Protocol 1: Bright-Field Transmission Imaging of Vasculature
- Principle: Utilizes differential absorption of NIR-II light by hemoglobin in blood vessels against surrounding tissue.
- Light Source: 1064 nm or 1200 nm continuous-wave (CW) laser or fiber-coupled lamp with appropriate bandpass filter (e.g., 1100/100 nm BP).
- Sample Preparation: Anesthetized mouse fixed on imaging stage. Depilate area of interest. Optional: Use a physiological monitoring system.
- Imaging Setup:
- Illuminate the tissue from the opposite side of the detector (trans-illumination) or from the same side for epi-illumination of thin tissues (e.g., ear, skull).
- Use an indium gallium arsenide (InGaAs) camera with sensitivity in the 900-1700 nm range. Cool the camera to -80°C to reduce dark noise.
- Place a long-pass filter (e.g., LP 1250 nm) or a bandpass filter matching the source in front of the camera to block excitation light and select the desired emission window.
- Data Acquisition & Processing:
- Acquire sequence of images.
- Apply flat-field correction using reference images from a uniform phantom.
- Perform image registration if necessary.
- Apply contrast enhancement algorithms (e.g., adaptive histogram equalization) to visualize fine vascular structures.
Protocol 2: Autofluorescence Imaging of Metabolic State
- Principle: Detects weak NIR-II tail emission from metabolic co-factors (NADH/FAD) or AGEs.
- Light Source: Tunable laser or LED at excitation wavelengths optimal for the fluorophore (e.g., 740 nm for NADH, 850 nm for FAD, 900-1000 nm for AGEs).
- Sample Preparation: As in Protocol 1. Minimize exogenous fluorescent contaminants.
- Imaging Setup:
- Employ epi-illumination geometry. Use a dichroic mirror and excitation filter optimized for the chosen excitation wavelength.
- For detection, use a series of long-pass filters (e.g., LP 1100 nm, LP 1300 nm, LP 1500 nm) to isolate the NIR-II autofluorescence signal and perform spectral unmixing.
- Use a high-sensitivity, deep-cooled InGaAs or HgCdTe (MCT) camera.
- Data Acquisition & Processing:
- Acquire images at multiple emission bands.
- Subtract camera dark current and instrument background.
- Use spectral unmixing algorithms to separate contributions from different autofluorescent species if using multiple detection channels.
- Quantify intensity changes over time or between regions of interest as a proxy for metabolic activity.
Visualization of Principles and Workflows
Diagram 1: Core Principles of Label-Free NIR-II Imaging (91 chars)
Diagram 2: Generic NIR-II Label-Free Imaging Workflow (98 chars)
The Scientist's Toolkit: Key Research Reagent Solutions
Table 3: Essential Materials for Label-Free NIR-II Imaging
| Item | Function & Rationale | Example/Specification |
|---|---|---|
| InGaAs Camera | The primary detector for 900-1700 nm light. High quantum efficiency and low noise are critical for detecting weak signals. | Cooled (-60°C to -80°C) scientific cameras with 640x512 or 1280x1024 pixel arrays. |
| NIR-II Light Sources | Provides illumination within the optical window. Choice depends on modality (bright-field vs. fluorescence). | 1064 nm DPSS Lasers, 1200 nm LED arrays, or tunable OPO lasers for excitation. |
| Long-Pass & Band-Pass Filters | Isolates the desired NIR-II emission/transmission band and blocks excitation or out-of-band light. | Stock or custom filters from manufacturers like Thorlabs, Semrock, or Iridian (e.g., LP1100, LP1300, BP1100/100). |
| NIR-Transparent Imaging Stage | Allows for transmission geometry imaging. Must have minimal absorption and autofluorescence in NIR-II. | Fused quartz, calcium fluoride (CaF₂), or specialized NIR-transparent polymers. |
| Anesthesia System (Isoflurane) | Ensures animal immobilization and physiological stability during in vivo imaging sessions. | Vaporizer system with induction chamber and nose cones. |
| Depilatory Cream | Removes hair which scatters and absorbs NIR-II light, significantly degrading image quality. | Commercial chemical hair remover (e.g., Nair). |
| Physiological Monitor | Tracks vital signs (temp, heart rate, SpO₂) to ensure animal health and correlate imaging data with state. | Mouse monitoring pads with ECG and temperature probes. |
| Digital Phantoms | Calibration standards for assessing system resolution, sensitivity, and linearity. | Solid phantoms with embedded absorbing structures or capillary tubes filled with blood. |
Label-free NIR-II imaging capitalizes on the fundamental photophysical advantages of the second biological window—minimized scattering and autofluorescence—to extract high-fidelity anatomical and functional contrast from endogenous tissue properties. It stands as a powerful complement to fluorescence-based NIR-II imaging, particularly for applications where exogenous labeling is impractical or where baseline anatomical mapping is required. Future research is directed towards the development of ultra-sensitive Superconducting Nanowire Single-Photon Detectors (SNSPDs) for capturing extremely weak autofluorescence signals, advanced computational algorithms for extracting functional information from absorption spectra, and the integration of this modality with other imaging techniques for multimodal diagnostic platforms. This approach solidifies the role of NIR-II optics as an indispensable tool for non-invasive biomedical investigation.
The comparative analysis of the first near-infrared window (NIR-I, 700-900 nm) and the second near-infrared window (NIR-II, 900-1700 nm) is pivotal for advancing in vivo optical imaging. The core thesis posits that longer wavelengths within the NIR-II region significantly reduce photon scattering and tissue autofluorescence, leading to superior tissue penetration depth and spatial resolution. This technical guide details how this principle is exploited for real-time vascular mapping and hemodynamic monitoring, a critical application in preclinical research and clinical translation. The transition from NIR-I to NIR-II agents and detectors directly addresses historical limitations in signal-to-background ratio and imaging depth, enabling quantitative physiological monitoring previously unattainable.
Core Principles: Scattering, Penetration, and Contrast
The fundamental optical properties of biological tissue differ drastically between NIR-I and NIR-II.
Table 1: Quantitative Comparison of NIR-I vs. NIR-II Optical Properties
| Parameter | NIR-I (750-900 nm) | NIR-II (1000-1350 nm) | Experimental Measurement Method |
|---|---|---|---|
| Reduced Scattering Coefficient (μs') | ~0.75 mm⁻¹ (brain) | ~0.4 mm⁻¹ (brain) | Measured using integrating sphere and inverse adding-doubling calculation on ex vivo tissue samples. |
| Absorption Coefficient (μa) | Higher (due to hemoglobin, water) | Lower (local absorption minimum) | Spectrophotometry of tissue homogenates or pure components. |
| Optimal Penetration Depth | 1-3 mm | 3-8 mm | Measured by imaging capillary tubes filled with IRDye 800CW (NIR-I) or CH-4T (NIR-II) at varying depths in tissue phantoms. |
| Tissue Autofluorescence | High | ~5-10x lower | Quantified by imaging control animals/ tissue without fluorophore, measuring mean pixel intensity. |
| Spatial Resolution (FWHM) | Degrades rapidly >2mm | Maintains <40 μm resolution at 3mm depth | Measured by imaging sub-resolution fluorescent beads embedded in scattering phantoms. |
| Signal-to-Background Ratio (SBR) | Typically 2-10 | Can exceed 50-100 in vivo | Calculated as (SignalRegion - BackgroundRegion) / StdDev(Background_Region). |
The lower scattering in NIR-II allows photons to travel through tissue with less deviation, preserving image fidelity and enabling accurate vessel diameter measurement and blood flow tracking.
Key Experimental Protocols for Hemodynamic Monitoring
Protocol 3.1: NIR-II Fluorescent Agent-Based Angiography and Perfusion Kinetics
Objective: To map vasculature and quantify hemodynamic parameters (blood flow velocity, perfusion rate) using a bolus track of an NIR-II fluorophore.
- Animal Preparation: Anesthetize mouse/rat and secure in imaging chamber. Maintain body temperature at 37°C.
- Dye Administration: Prepare a sterile solution of an FDA-approved NIR-I dye (e.g., Indocyanine Green, ICG) or a research NIR-II dye (e.g., CH-4T, IR-1048) in saline. Use a dosage of 0.5-2 mg/kg for ICG, 0.1-0.5 mg/kg for NIR-II dyes.
- Imaging Setup: Use a NIR-II imaging system equipped with a 808 nm (for ICG) or 1064 nm (for NIR-II dyes) laser for excitation. Employ a cooled InGaAs or SWIR camera with a 900-1700 nm long-pass filter. For NIR-I control, use a standard sCMOS camera with an 840 nm long-pass filter.
- Data Acquisition: Initate high-frame-rate acquisition (5-30 fps). Inject dye via tail vein/catheter as a rapid bolus. Record dynamic fluorescence in the region of interest (e.g., brain cortex, hindlimb) for 60-180 seconds.
- Data Analysis: Generate time-intensity curves (TIC) for selected vessels and tissue. Calculate perfusion parameters:
- Time-to-Peak (TTP): Time from injection to maximum intensity.
- Mean Transit Time (MTT): Calculated from the first moment of the TIC.
- Relative Blood Flow: Derived from inverse of TTP or model-dependent deconvolution.
Protocol 3.2: Label-Free Laser Speckle Contrast Imaging (LSCI) Across NIR Windows
Objective: To monitor relative blood flow changes without exogenous contrast agents, comparing visibility in NIR-I vs. NIR-II.
- System Configuration: Utilize a laser diode at 785 nm (NIR-I) and 1064 nm (NIR-II). Illuminate the tissue surface with a defocused, coherent beam.
- Speckle Image Acquisition: Use the same InGaAs camera for both wavelengths (if sensitivity allows) or matched cameras. Acquire raw speckle images at >50 fps for 5-10 seconds.
- Contrast Calculation: Process each image sequence to compute the speckle contrast, K = σ/, where σ is the standard deviation and is the mean intensity in a local spatial window (typically 5x5 pixels).
- Flow Index Mapping: Convert the speckle contrast map to a relative blood flow map using the relation Flow ∝ 1/K². Compare the clarity and depth of vessel visualization between the two spectral bands.
Visualizing the Workflow and Contrast Mechanism
Diagram 1: Experimental Decision Workflow for Vascular Imaging
Diagram 2: NIR-I vs NIR-II Photon-Tissue Interaction & SBR
The Scientist's Toolkit: Research Reagent Solutions
Table 2: Essential Materials for NIR-II Vascular Imaging Experiments
| Item Name | Category | Function & Relevance | Example Product/Specification |
|---|---|---|---|
| ICG (Indocyanine Green) | NIR-I Fluorescent Dye | FDA-approved clinical agent; excitation/emission ~808/830 nm. Serves as the NIR-I benchmark for comparison. | Diagnostic Green, Inc.; Pulsion Medical Systems. |
| NIR-II Fluorophores (Small Molecule) | NIR-II Fluorescent Dye | Organic dyes (e.g., CH-4T, IR-1048) with emission >1000 nm. Provide high brightness and low scattering for superior imaging. | Sigma-Aldrich (CH-4T); Lumiprobe (IR-1061). |
| PBS (pH 7.4) or Saline | Solvent/Vehical | For dissolving and diluting contrast agents to the correct concentration for intravenous injection. | Thermo Fisher Scientific. |
| Heparinized Saline | Catheter Maintenance | Prevents blood clotting in indwelling catheters used for precise bolus injection during kinetic studies. | Various pharmaceutical suppliers. |
| Tissue Phantom Material | Calibration/Validation | Lipids/intralipid suspensions or synthetic polymers with calibrated scattering coefficients to mimic tissue. | Thorlabs (Tissue Phantoms); Intralipid 20%. |
| Cooled InGaAs/SWIR Camera | Detection | Essential for capturing NIR-II fluorescence (>900 nm). High quantum efficiency and low noise are critical. | Sensors Unlimited (Goodrich), Princeton Instruments, NIT. |
| 1064 nm Laser Diode | Excitation Source | Optimal wavelength for exciting many NIR-II dyes, balancing water absorption and penetration. | Laserglow Technologies, CNI Laser. |
| 900/1000/1300 nm Long-pass Filters | Optical Filter | Blocks excitation laser light and NIR-I autofluorescence, allowing only NIR-II emission to reach the detector. | Thorlabs, Semrock. |
| Animal Monitoring System | Physiological Control | Maintains anesthesia, monitors body temperature, and records respiration. Crucial for stable hemodynamics. | Harvard Apparatus, Kent Scientific. |
| Analysis Software (e.g., ImageJ, MATLAB) | Data Processing | For time-series analysis, region-of-interest quantification, and calculation of hemodynamic parameters. | NIH Fiji, MathWorks. |
The advancement of fluorescence-guided surgery (FGS) hinges on optimizing the tumor-to-background ratio (TBR), a critical metric defining surgical precision. This pursuit is fundamentally framed by the comparative photophysical properties of the first near-infrared window (NIR-I, 700-900 nm) and the second near-infrared window (NIR-II, 1000-1700 nm). Within this thesis, NIR-II imaging emerges as a superior paradigm due to significantly reduced photon scattering and negligible tissue autofluorescence in biological tissue, leading to enhanced penetration depth and improved TBR. This whitepaper details the technical implementation of image-guided tumor resection leveraging these principles.
Quantitative Comparison: NIR-I vs. NIR-II Optical Properties
The following table summarizes key quantitative parameters that justify the shift towards NIR-II for high-TBR imaging.
Table 1: Comparative Optical Properties of NIR-I and NIR-II Windows in Biological Tissue
| Parameter | NIR-I (750-900 nm) | NIR-II (1000-1350 nm) | Implication for TBR |
|---|---|---|---|
| Tissue Scattering Coefficient (μs') | ~0.8 - 1.2 mm⁻¹ | ~0.3 - 0.6 mm⁻¹ | Reduced scattering in NIR-II minimizes blur, improving spatial resolution and boundary delineation. |
| Autofluorescence Intensity | High (from collagen, elastin, NADH) | Very Low to Negligible | Drastically lowers non-specific background, directly increasing TBR. |
| Effective Penetration Depth | 1-3 mm | 3-8 mm | Enables visualization of deeper or sub-surface lesions. |
| Typical Reported TBR | 2 - 5 | 5 - 15+ | NIR-II probes consistently achieve multiplicatively higher contrast. |
| Absorption by Blood & Water | Moderate (Hb/HbO2 absorption tails) | Low in "NIR-IIa" (1000-1300 nm) | Higher signal fidelity through vasculature and hydrated tissue. |
Core Experimental Protocol for NIR-II Agent Evaluation In Vivo
This protocol outlines a standard preclinical workflow for evaluating a targeted NIR-II fluorescent agent (e.g., a peptide- or antibody-conjugated organic dye or nanoparticle) for image-guided resection.
Aim: To quantify the TBR and resection efficacy of a NIR-II-emitting contrast agent in a murine subcutaneous or orthotopic tumor model.
Materials: See "The Scientist's Toolkit" below.
Procedure:
- Animal Model & Tumor Implantation: Inoculate immunocompromised mice (e.g., nude mice) with human cancer cells (e.g., U87MG glioblastoma, 4T1 breast carcinoma) subcutaneously. Allow tumors to grow to ~100-200 mm³.
- Probe Administration: Via tail vein, inject the NIR-II probe (e.g., IRDye 800CW, CH-4T, or a targeted agent like Lyp-1-Cy5.5@Ag2S nanoparticle) at an optimized dose (e.g., 2-5 nmol in 100 µL PBS). Include a control group injected with PBS or an untargeted probe.
- Longitudinal Imaging: Anesthetize mice and image at multiple time points (e.g., 2, 6, 12, 24, 48 h post-injection) using a NIR-II imaging system (e.g., InGaAs camera with 808 nm or 980 nm excitation laser, 1000 nm long-pass emission filter).
- Image Analysis & TBR Calculation: Draw regions of interest (ROIs) over the tumor (T) and adjacent normal tissue (N). Calculate mean fluorescence intensity (MFI) for each.
- TBR = MFI(T) / MFI(N)
- Plot TBR vs. time to determine optimal imaging/window.
- Simulated Guided Resection: At peak TBR time, perform a survival surgery under NIR-II guidance. Use the real-time video feed to define tumor margins. Excise the fluorescent mass.
- Ex Vivo Validation: Image the resected specimen and the surgical bed. Process tissues for histology (H&E) and correlate fluorescence with pathology to confirm complete resection and specificity.
- Biodistribution & Pharmacokinetics: Euthanize a cohort at key time points. Harvest major organs and tumors, weigh them, and measure ex vivo fluorescence to calculate % injected dose per gram (%ID/g).
Diagram: NIR-II Probe Evaluation Workflow
Mechanism: Signaling Pathways for Targeted Probe Accumulation
Enhanced TBR relies on specific molecular targeting. A common pathway involves tumor-associated receptor overexpression.
Diagram: EGFR-Targeted NIR-II Probe Accumulation Pathway
The Scientist's Toolkit: Key Research Reagent Solutions
Table 2: Essential Materials for NIR-II Image-Guided Resection Studies
| Item Category | Specific Example(s) | Function & Rationale |
|---|---|---|
| NIR-II Fluorescent Probes | IRDye 800CW (NIR-I/NIR-II border), CH-4T, LZ-1105 (organic dyes); Ag2S, PbS/CdS quantum dots; single-walled carbon nanotubes (SWCNTs). | Emit light in the NIR-II window. Targeted versions (antibody/peptide-conjugated) provide molecular specificity for tumor labeling. |
| Targeting Moieties | Anti-EGFR cetuximab, Anti-HER2 trastuzumab, cRGD peptide (for αvβ3 integrin), Lyp-1 peptide (for p32 receptor). | Directs the conjugated fluorophore to tumor-specific antigens or vasculature, enhancing accumulation and TBR. |
| In Vivo Imaging System | InGaAs camera (cooled), 808 nm or 980 nm laser diode excitation source, tunable emission filters (1000 nm, 1100 nm, 1300 nm long-pass). | Captures low-energy NIR-II photons with high sensitivity. Laser provides precise excitation; filters block scattered excitation light. |
| Animal Cancer Models | Murine subcutaneous xenografts (e.g., U87MG, 4T1), orthotopic models (e.g., brain, lung), genetically engineered mouse models (GEMMs). | Provide a biologically relevant environment to test probe kinetics, penetration depth, and resection efficacy. |
| Surgical & Imaging Platform | Stereotactic small animal surgery stage, integrated white light and NIR-II imaging optics, real-time video display software. | Enables precise manipulation and simultaneous visualization of surgical field in both anatomical and fluorescent contrast modes. |
| Image Analysis Software | Living Image (PerkinElmer), ImageJ/FIJI with custom macros, MATLAB/Python for TBR & pharmacokinetic modeling. | Quantifies fluorescence intensity, calculates TBR over time, and generates pharmacokinetic profiles (%ID/g). |
This technical whitepaper examines advanced methodologies for transcranial neurological imaging, framed within the critical research context comparing Near-Infrared Window I (NIR-I, 650-950 nm) and Window II (NIR-II, 1000-1700 nm) for deep tissue penetration and reduced scattering. The capacity to image functional and pathological activity through the intact skull is paramount for advancing non-invasive neuroscientific research and therapeutic development.
The primary physical barrier to optical brain imaging is the skull, which scatters and absorbs photons. The choice of spectral window is fundamental. NIR-I imaging leverages the first local minimum in the absorption spectrum of hemoglobin and water, enabling penetration of several centimeters. However, scattering remains significant. NIR-II imaging utilizes a region where tissue scattering coefficients are substantially lower (scattering scales as λ^−α, with α typically between 0.5 and 4, leading to a 4-10x reduction in scattering for NIR-II versus NIR-I). This results in markedly improved resolution, signal-to-background ratio (SBR), and penetration depth for transcranial applications.
Table 1: Quantitative Comparison of NIR-I vs. NIR-II for Transcranial Imaging
| Parameter | NIR-I (750-900 nm) | NIR-II (1000-1350 nm) | Implications for Brain Imaging |
|---|---|---|---|
| Tissue Scattering | High (~μs' > 1 mm⁻¹) | Reduced (~4-10x lower than NIR-I) | NIR-II offers superior spatial resolution through skull. |
| Absorption by Hb/H₂O | Local minimum | Lower for Hb, increasing for H₂O >1150 nm | Enables deeper penetration; careful wavelength selection needed. |
| Max. Penetration Depth (in brain tissue) | ~2-3 mm (high-res), ~1-2 cm (diffuse) | >3 mm (high-res), >1.5 cm (diffuse) | Deeper cortical layer access with NIR-II. |
| Typical Resolution (Through Rodent Skull) | ~200-500 µm | ~50-150 µm | Microvascular imaging feasible with NIR-II. |
| Optical Contrast Agents | ICG, Cy5.5, quantum dots (QDs) | IRDye 800CW, ICG (tail emission), PbS/CdSe QDs, SWCNTs | Broader palette of bright, photostable probes in NIR-II. |
| In Vivo SBR (Cerebral Vasculature) | Moderate (5-10 dB) | High (10-20+ dB) | Clearer functional mapping with NIR-II. |
Core Imaging Modalities & Protocols
Diffuse Optical Tomography (DOT) Through the Skull
Protocol: Multi-source, multi-detector DOT for human functional imaging.
- Setup: An array of NIR-I (e.g., 690, 830 nm) or NIR-II (e.g., 1064 nm) laser diodes and avalanche photodiode (APD) detectors is arranged on a flexible cap covering the scalp.
- Data Acquisition: Sources are sequentially illuminated while all detectors record intensity. For functional imaging, a block or event-related paradigm is run (e.g., motor task, visual stimulus).
- Data Processing: Measured intensity changes are input into a modified Beer-Lambert law or a photon migration model (e.g., diffusion equation) solved on a 3D head model derived from MRI. Changes in oxy- and deoxy-hemoglobin concentration are computed.
- NIR-II Adaptation: Using 1064 nm lasers and InGaAs cameras/APDs. Reduced scattering allows for denser array spacing and improved depth localization.
NIR-II Fluorescence Microscopy (Preclinical)
Protocol: High-resolution transcranial cerebral vascular and functional imaging in rodents.
- Animal Preparation: Anesthetize mouse/rat, secure in stereotaxic frame. Gently remove scalp, but keep skull intact. Apply ultrasound gel for index matching.
- Dye Administration: Intravenously inject NIR-II fluorophore (e.g., 100 µL of 100 µM IR-12N dye or PEG-coated PbS QDs).
- Imaging System: Use a 1064 nm continuous-wave or pulsed laser for excitation. Employ long-pass filters (LP >1250 nm) and an InGaAs camera cooled to -80°C. A scanning system enables wide-field or confocal-like imaging.
- Acquisition: Record real-time video (30 fps) of cerebral blood flow. For functional imaging, monitor dye dynamics in response to stimuli (e.g., whisker pad stimulation, drug challenge).
- Analysis: Calculate hemodynamic response functions, vessel diameter dynamics, and perfusion metrics.
Key Signaling Pathways in Neurovascular Coupling (Imaged Optically)
Functional brain imaging relies on detecting hemodynamic changes triggered by neurovascular coupling.
Diagram Title: Neurovascular Coupling Pathway for Functional Imaging
Experimental Workflow for Comparative NIR-I/NIR-II Study
Diagram Title: Comparative NIR-I vs NIR-II In Vivo Workflow
The Scientist's Toolkit: Key Research Reagent Solutions
Table 2: Essential Materials for Transcranial Optical Brain Imaging
| Item | Function & Specification | Example Product/Chemical |
|---|---|---|
| NIR-I Fluorescent Dye | Vascular contrast agent for baseline NIR-I imaging. | Indocyanine Green (ICG), Cy5.5 NHS Ester |
| NIR-II Fluorescent Dye | High SBR vascular/functional agent for deep penetration. | IRDye 800CW, CH-4T, IR-12N, PbS/CdSe Quantum Dots |
| Skull Optical Clearing Agent | Reduces skull scattering via index matching. | Ultrasound Gel, Titanium dioxide/silica suspension, α-thioglycerol |
| Chronic Cranial Window Kit | For long-term cortical imaging (if skull is thinned/replaced). | Cover glass, dental cement, cyanoacrylate glue |
| Hemodynamic Reference Dye | Ratiometric measurement for quantitative [Hb] changes. | Fluorescein isothiocyanate (FITC)-dextran (for plasma) |
| Multi-Wavelength Laser Source | Provides precise NIR-I & NIR-II excitation. | Tunable OPO laser, fixed 785nm & 1064nm diode lasers |
| InGaAs SWIR Camera | Detects photons >1000 nm with high sensitivity. | Teledyne Princeton Instruments NIRvana, Sony IMX990 |
| Stereotaxic Frame & Anesthesia System | Precise, stable positioning and maintenance of rodent model. | David Kopf Instruments, Isoflurane vaporizer system |
| Diffuse Optical Analysis Software | Reconstructs 3D tomographic data from DOT measurements. | Homer2, NIRSTORM, AtlasViewer |
The transition from NIR-I to NIR-II represents a paradigm shift for transcranial brain imaging, offering quantifiable improvements in depth, resolution, and fidelity. This guide outlines the protocols and tools necessary to implement these techniques. Future research will focus on developing brighter, targeted NIR-II probes for molecular imaging and integrating multi-spectral NIR data with other modalities (e.g., MRI, EEG) to achieve a comprehensive, non-invasive view of brain function and pathology.
Overcoming Technical Hurdles: A Practical Guide to Optimizing NIR-I and NIR-II Systems
Within the critical research domain comparing Near-Infrared Window I (NIR-I, 700–900 nm) and Window II (NIR-II, 1000–1700 nm) for tissue penetration depth and scattering, data integrity is paramount. The superior tissue penetration and reduced scattering observed in NIR-II come with distinct technical challenges. Signal attenuation (from absorption and scattering) and stray light artifacts can severely compromise quantitative accuracy, leading to erroneous conclusions about probe performance and biodistribution. This guide provides a technical framework for identifying, quantifying, and mitigating these pervasive artifacts.
Fundamentals of Signal Attenuation and Stray Light
Signal Attenuation refers to the loss of photon flux between the emission point and the detector. In tissue, primary mechanisms are:
- Absorption: By endogenous chromophores (e.g., hemoglobin, water, lipids). Water absorption increases significantly beyond 900 nm, defining the upper limit of NIR-II.
- Scattering: Reduced in NIR-II due to the inverse dependence of scattering on wavelength (~λ^-γ, with γ typically 0.2-2.4 for biological tissues).
Stray Light is any detected light not originating from the intended probe emission. Sources include:
- Ambient light leaks.
- Autofluorescence from substrates, cages, or tissues.
- Optical component luminescence.
- Laser or excitation light bleed-through into the detection channel.
Quantitative Comparison of NIR-I vs. NIR-II Attenuation Factors
Table 1: Key Attenuation Coefficients in Biological Tissue (Approximate Values)
| Component | Mechanism | Impact in NIR-I (750-900 nm) | Impact in NIR-II (1000-1350 nm) | Notes |
|---|---|---|---|---|
| Hemoglobin (Oxy & Deoxy) | Absorption | High (μa ~0.1-1 mm⁻¹) | Very Low | Primary absorber in NIR-I; negligible beyond 900 nm. |
| Water | Absorption | Very Low | Moderate to High (μa increases from ~0.1 to 1 mm⁻¹) | Defines long-wave limit of NIR-II (~1350 nm). |
| Lipids | Absorption | Low | Moderate peaks near 920, 1040 nm | Consideration for specific adipose tissue imaging. |
| Tissue Scattering | Scattering | High (μs' ~1.0 mm⁻¹) | Reduced (μs' ~0.5-0.7 mm⁻¹) | ~λ^-1 to λ^-1.5 dependence. Major source of NIR-II improvement. |
| General Tissue Autofluorescence | Stray Light | High (Shorter wavelength) | Very Low | Enables dramatically higher SBR in NIR-II. |
Experimental Protocols for Artifact Identification
Protocol 3.1: Measuring System-Induced Stray Light
Objective: Characterize non-sample derived background.
- Setup: Configure imaging system (e.g., NIR-II fluorescence imager with InGaAs camera) for standard acquisition.
- Control Acquisition: With no sample and excitation source OFF, acquire a 500ms image. This measures electronic/dark current.
- Excitation-Only Acquisition: With no sample, turn excitation ON at typical power. Acquire image. Signal increase over Step 2 originates from luminescence of optical filters, lenses, or housing.
- Analysis: Subtract the Step 2 image from Step 3. The resultant pixel values represent system stray light. Map this across the field of view. Regions with high values indicate problematic components.
Protocol 3.2: In Vitro Phantom Calibration for Attenuation Correction
Objective: Establish a depth-dependent signal correction curve.
- Phantom Preparation: Create a 1% Intralipid in PBS solution to mimic tissue scattering. Add a known concentration of NIR-I (e.g., ICG) or NIR-II (e.g., IR-1061) dye.
- Experimental Setup: Fill a rectangular cuvette with phantom. Use a translational stage to position a capillary tube containing a fixed concentration of the same dye at incremental depths (0.5, 1, 2, 3, 4 mm) within the scattering medium.
- Imaging: At each depth, acquire fluorescence signal (S) with identical parameters.
- Data Fitting: Plot Signal Intensity (S) vs. Depth (d). Fit to the model: S(d) = S₀ * exp(-μ_eff * d) + C, where μ_eff is the effective attenuation coefficient. This curve provides a basis for depth correction in vivo.
Protocol 3.3: In Vivo Specificity Control for Stray Light
Objective: Distinguish true probe signal from non-specific tissue background.
- Animal Model: Use disease model (e.g., tumor-bearing mouse).
- Dual-Scan Protocol:
- Experimental Scan: Inject targeted NIR-II probe. Acquire time-series images post-injection.
- Control Scan: 24h later, inject an excess dose of unlabeled targeting molecule (blocking dose). Wait 30 min. Inject identical dose of the targeted NIR-II probe. Acquire images.
- Analysis: Subtract the "blocked" control scan image from the experimental scan image at the same time point. The residual signal is specific binding; eliminated signal represents non-specific uptake, vascular pooling, or some stray light artifacts.
Mitigation Strategies
For Signal Attenuation:
- Depth Correction: Apply the μ_eff derived from Protocol 3.2 to estimate and correct for depth-related signal loss in 3D reconstructions.
- Ratiometric Imaging: Use a reference dye with different attenuation characteristics or a lifetime-based measurement less sensitive to intensity loss.
- Choice of Sub-Window: Operate within the "sweet spot" of NIR-II (e.g., 1000-1300 nm) to balance water absorption and scattering reduction.
For Stray Light:
- Optical Filtering: Use bandpass filters with high out-of-band optical density (OD >6). Implement custom filter sets that match the dye's exact emission, especially critical for NIR-II where water absorption creates a "dark background."
- Light-Tight Enclosures: Ensure complete isolation from ambient light, which can saturate sensitive InGaAs detectors.
- Spectral Unmixing: For multiplexing, use linear unmixing algorithms to separate probe signal from broad autofluorescence.
- Material Selection: Use low-luminescence, NIR-II optimized optics (e.g., CaF₂ lenses, specific glass types).
Visualization of Experimental Workflows and Concepts
Title: Protocol for Isolating Specific In Vivo Signal
Title: Photon Fate Leading to Attenuation or Stray Light
The Scientist's Toolkit: Key Research Reagent Solutions
Table 2: Essential Materials for NIR-I/NIR-II Imaging Artifact Control
| Item | Function in Artifact Mitigation | Example/Note |
|---|---|---|
| Low-Autofluorescence Substrates | Minimizes background stray light from sample plates or animal bedding. | Black-walled 96-well plates; IR-compatible bedding. |
| Intralipid/Lipid Phantoms | Mimics tissue scattering for calibration (Protocol 3.2). Allows quantification of μ_eff. | 1-2% Intralipid in PBS or agarose. |
| NIST-Traceable Density Filters | Calibrates camera linearity across signal intensity range, critical for quantitative subtraction. | Neutral density filter set. |
| Broad-Spectrum NIR Calibration Source | Validates system response uniformity across NIR-I and NIR-II wavelengths. | Tungsten halogen lamp with known spectrum. |
| High-OD Bandpass Filters | Reduces excitation bleed-through and ambient stray light. Critical for SBR. | OD >6 at out-of-band wavelengths; Semrock, Chroma. |
| Targeted & Isotype Control Probes | Enables specific vs. non-specific signal disaggregation (Protocol 3.3). | Same fluorophore, different targeting moieties. |
| Absorbance Standard (e.g., IR-26 Dye) | Provides a known quantum yield reference for cross-system validation. | In ODCB, used as NIR-II standard. |
| Deuterium Oxide (D₂O) Phantoms | Allows study of water absorption impact by reducing absorption in NIR-II. | Used to isolate scattering effects. |
The development of molecular probes for in vivo imaging, particularly within the near-infrared windows (NIR-I: 700-900 nm; NIR-II: 1000-1700 nm), is a cornerstone of modern biomedical research. The core thesis driving this field is that NIR-II imaging offers superior tissue penetration depth and reduced scattering compared to NIR-I, due to decreased photon absorption by endogenous chromophores like hemoglobin, water, and lipids, and diminished Rayleigh scattering at longer wavelengths. However, exploiting this advantage requires probes that simultaneously achieve high brightness, excellent biocompatibility (low toxicity, favorable pharmacokinetics), and precise target specificity—a challenging tripartite optimization.
Fundamental Challenges in Probe Design
The Trilemma of Probe Properties
The three key properties exist in a state of tension. Enhancing brightness (quantum yield, molar extinction coefficient) often requires large, rigid, hydrophobic chromophores, which can compromise biocompatibility by inducing aggregation, opsonization, and reticuloendothelial system (RES) clearance. Introducing targeting moieties (e.g., antibodies, peptides) increases specificity but adds molecular weight, potentially altering pharmacokinetics and brightness. Surface modifications for biocompatibility (PEGylation, zwitterionic coatings) can shield the probe and inadvertently reduce targeting efficiency.
NIR-I vs. NIR-II: A Penetration Depth Thesis
The push towards NIR-II probes is grounded in the scattering physics equation: scattering coefficient (\mu_s \propto \lambda^{-\alpha}), where (\alpha) is the scattering power (typically 0.2-4 for biological tissue). Longer wavelengths in the NIR-II region scatter less, leading to deeper penetration and higher-resolution images. This thesis is validated by comparative studies showing millimeter to centimeter depth improvements.
Table 1: Quantitative Comparison of NIR-I vs. NIR-II Optical Properties
| Property | NIR-I Window (700-900 nm) | NIR-II Window (1000-1700 nm) | Implication for Imaging |
|---|---|---|---|
| Tissue Scattering | High ((\mu_s) ~10-100 cm⁻¹) | Significantly Reduced ((\mu_s) can be <5 cm⁻¹) | NIR-II offers superior resolution & clarity. |
| Autofluorescence | Moderate to High from biomolecules | Very Low | NIR-II provides drastically improved signal-to-noise ratio (SNR). |
| Water Absorption | Low | Has local peaks (e.g., ~1450 nm) | Requires careful selection of sub-windows (e.g., 1000-1350 nm). |
| Typical Max. Penetration Depth | 1-3 mm (high res) | 3-10+ mm (high res) | NIR-II enables deep-tissue non-invasive imaging. |
| Photothermal Conversion | Generally Lower | Often Higher for some materials | NIR-II probes may require careful thermal management. |
Experimental Protocols for Key Evaluations
Protocol: Evaluating Brightness & Photostability
Objective: Quantify the brightness (product of molar extinction coefficient ε and quantum yield Φ) and photostability of a candidate NIR probe. Materials: Spectrophotometer, fluorometer, integrating sphere (for Φ), NIR laser/light source, NIR-sensitive detector (e.g., InGaAs camera). Method:
- Prepare a series of dilutions of the probe in relevant buffer. Measure absorbance (A) at λ_max using spectrophotometer.
- Calculate ε using the Beer-Lambert law (A = εcl). Confirm linearity across concentrations.
- For quantum yield (Φ), use an integrating sphere coupled to a NIR spectrometer. Measure the total photon flux of emission (E) and absorbed excitation light (A) from the sample. Φsample = Esample / A_sample. Compare to a NIR standard with known Φ.
- For photostability, irradiate a standard sample volume with a fixed-power NIR laser at the excitation wavelength. Acquire fluorescence images (NIR-I or NIR-II camera) at regular intervals. Plot normalized fluorescence intensity vs. irradiation time to determine decay half-life.
Protocol: Assessing Biocompatibility & PharmacokineticsIn Vivo
Objective: Determine acute toxicity, blood circulation half-life, and biodistribution. Materials: Animal model, IV injection setup, blood collection kits, ICP-MS or fluorescence imaging system for quantification, histology materials. Method:
- Acute Toxicity: Administer a range of probe doses (e.g., 5, 10, 20 mg/kg) to cohorts of animals. Monitor for 7-14 days for mortality, weight loss, and behavioral changes. Perform serum biochemistry and histopathology on major organs (liver, spleen, kidney, lung) at study endpoint.
- Pharmacokinetics: Administer a standard dose via tail vein. Collect blood samples (e.g., at 1, 5, 15, 30 min, 1, 2, 4, 8, 24 h). Process plasma. Quantify probe concentration in plasma via fluorescence or elemental analysis (if probe contains a unique metal). Fit data to a two-compartment model to calculate α-phase (distribution) and β-phase (elimination) half-lives, clearance, and volume of distribution.
- Biodistribution: At predetermined time points (e.g., 4 h, 24 h), euthanize animals, harvest organs. Homogenize organs and quantify probe content. Express as % injected dose per gram of tissue (%ID/g).
Protocol: Validating Target SpecificityIn Vitro&In Vivo
Objective: Confirm specific binding to the intended molecular target over background. Materials: Target-positive and target-negative cell lines, animal xenograft models, competitive blocking agents, fluorescence microscopy/imaging systems. Method:
- In Vitro Binding: Incubate target-positive and negative cells with the probe (e.g., 100 nM, 37°C, 1 h). Include a blocking group pre-treated with excess unlabeled targeting ligand (e.g., antibody). Wash cells. Analyze via flow cytometry or confocal microscopy. Specific binding = signal (positive cells) - signal (blocked positive cells) - signal (negative cells).
- In Vivo Specificity: Establish dual xenograft models (target-positive and target-negative tumors in the same mouse). Inject the probe intravenously. Acquire NIR-I/NIR-II images over time (e.g., 1, 4, 24 h). Calculate tumor-to-background ratio (TBR) for each tumor. Perform ex vivo imaging and quantification of harvested tumors to confirm specific accumulation.
Research Reagent Solutions Toolkit
Table 2: Essential Materials for NIR Probe Development & Evaluation
| Item | Function/Description | Key Consideration |
|---|---|---|
| NIR-II Fluorophores (e.g., Ag₂S/Ag₂Se QDs, SWCNTs, organic dyes like CH1055) | Core imaging agent emitting in the NIR-II window. | Trade-off between quantum yield, size, and potential metal toxicity. Organic dyes often offer better biocompatibility. |
| Bioconjugation Kits (e.g., NHS-PEG-Maleimide, Click Chemistry reagents) | For covalent attachment of targeting ligands (antibodies, peptides) and biocompatible coatings (PEG) to the probe. | Must maintain bioactivity of the ligand and colloidal stability of the probe post-conjugation. |
| Zwitterionic or PEG-based Coating Materials (e.g., DSPE-PEG, C18-PMH-PEG) | To render hydrophobic cores water-soluble, reduce protein fouling, and prolong blood circulation time. | PEG length and density critically impact "stealth" properties and potential immunogenicity. |
| Integrating Sphere with NIR Detector | Essential for accurate measurement of absolute photoluminescence quantum yield (PLQY) of NIR materials. | Must be calibrated for the NIR range, especially for NIR-II. |
| InGaAs Camera | The standard detector for NIR-II imaging due to high sensitivity in 900-1700 nm range. | Cooled models are required to reduce dark noise for high-sensitivity imaging. Cost is a significant factor. |
| Reference Dye Standards (e.g., IR-26 dye for NIR-II QY) | Used as a calibration standard for determining the quantum yield of novel NIR probes. | Must be measured under identical instrumental conditions as the sample. |
| Target-Specific Cell Lines (Isogenic Pairs) | Paired cell lines differing only in the expression of the target protein. Gold standard for in vitro specificity validation. | Ensures any difference in probe uptake is due to target expression, not other genetic variables. |
Visualization of Key Concepts
Title: The Core Trilemma of Molecular Probe Design
Title: NIR Probe Development & Validation Workflow
Designing probes that excel in brightness, biocompatibility, and specificity remains a formidable but essential challenge. The compelling thesis of NIR-II's superior penetration depth provides a clear directive, but realizing its full potential hinges on innovative chemical and nano-engineering strategies. Systematic evaluation using standardized protocols, as outlined, is critical for comparing probes and advancing the field. The future lies in intelligent, multifunctional designs—such as activatable probes or those with built-in clearance mechanisms—that inherently balance these competing demands, thereby unlocking new frontiers in deep-tissue diagnostics and therapeutic monitoring.
The optimization of optical illumination is a critical factor in biomedical research, particularly in studies comparing the NIR-I (700–900 nm) and NIR-II (1000–1700 nm) biological windows for tissue penetration and imaging. The choice of laser wavelength, coupled with precise power management and rigorous safety protocols, directly determines the quality of data, the viability of biological samples, and researcher safety. This technical guide synthesizes current research to provide a framework for designing illumination protocols that maximize signal-to-noise ratio and penetration depth while minimizing phototoxicity and ensuring laboratory safety.
Fundamental Principles: NIR-I vs. NIR-II Windows
The primary advantage of near-infrared (NIR) light over visible light is reduced scattering and absorption by endogenous chromophores like hemoglobin, water, and lipids. This allows for deeper tissue penetration.
NIR-I (700–900 nm): This window benefits from lower absorption by hemoglobin and water, but scattering remains a significant limiting factor. It is the traditional window for many techniques like in vivo fluorescence imaging, but penetration depth is typically limited to a few millimeters to a centimeter.
NIR-II (1000–1700 nm): Within this window, especially from 1000-1350 nm, scattering is dramatically reduced. Tissue autofluorescence is near-zero, and light absorption by water begins to increase but remains manageable. The result is significantly improved penetration depth (often centimeters), superior spatial resolution, and a higher signal-to-background ratio. However, it requires specialized detectors (e.g., InGaAs cameras) and fluorophores.
Table 1: Key Optical Properties of Biological Windows
| Property | Visible (400-700 nm) | NIR-I (700-900 nm) | NIR-II (1000-1350 nm) |
|---|---|---|---|
| Tissue Scattering | Very High | High | Very Low |
| Water Absorption | Low | Low | Moderate |
| Hemoglobin Absorption | Very High | Low | Very Low |
| Typical Max Penetration Depth | < 1 mm | 1-3 mm | 1-3 cm |
| Autofluorescence | High | Moderate | Negligible |
| Common Detectors | CCD/CMOS | CCD/CMOS | InGaAs, Ge |
Laser Wavelength Selection: A Strategic Decision
Wavelength selection is not merely a choice between NIR-I and NIR-II but requires consideration of the specific application.
For Maximum Penetration: Choose a laser within the 1064 nm or 1300-1350 nm range. 1064 nm is a common, stable laser line with excellent penetration. Wavelengths around 1300 nm represent a local minimum in water absorption and tissue scattering, offering optimal performance.
For Multiplexing: Use distinct, narrow-band lasers (e.g., 808 nm, 1064 nm, 1310 nm) with corresponding fluorophores to image multiple targets simultaneously with minimal spectral crosstalk.
For Excitation of Specific Fluorophores: The laser wavelength must align with the fluorophore's excitation peak (e.g., IRDye 800CW at ~780 nm for NIR-I; SWIR-emitting quantum dots at ~808 nm or 980 nm for NIR-II imaging).
Safety Note: Lasers >1400 nm are strongly absorbed by water, posing a higher risk of thermal damage to tissue and can be a significant burn hazard.
Table 2: Common Laser Lines for Biomedical Imaging
| Wavelength (nm) | Biological Window | Primary Applications | Key Considerations |
|---|---|---|---|
| 785 | NIR-I | Raman spectroscopy, fluorescence | Good penetration, widely available. |
| 808 | NIR-I / NIR-IIa | Exciting NIR-II probes, PDT | Standard diode laser, good balance. |
| 980 | NIR-IIa | Exciting lanthanide probes | Water absorption begins to increase. |
| 1064 | NIR-IIa/b | Deep-tissue imaging, OCT | Excellent penetration, low scattering. |
| 1310 | NIR-IIb | Deep-tissue imaging, OCT | Peak penetration in NIR-II window. |
| 1550 | NIR-IIb | Angiography, security | High water absorption, safety risk. |
Laser Power Optimization: Balancing Signal and Safety
Laser power must be optimized to achieve sufficient signal without causing photodamage (photobleaching, thermal effects). This is governed by the Maximum Permissible Exposure (MPE) for safety and the minimum irradiance for a sufficient signal-to-noise ratio (SNR).
Key Formula: SNR ∝ (Laser Power) × (Fluorophore Quantum Yield) × (Collection Efficiency) / (Background Noise)
Experimental Protocol: Determining Optimal Power for In Vivo Imaging
- Setup: Anesthetize and prepare an animal model with the target fluorescent probe administered.
- Instrumentation: Use a calibrated NIR-II imaging system with a tunable laser source and power meter.
- Procedure: Acquire a time-series of images at the target tissue site, starting at a very low power (e.g., 10 mW/cm²).
- Power Ramp: Incrementally increase laser irradiance (e.g., 10, 25, 50, 100, 200 mW/cm²) for subsequent acquisitions, with sufficient delay to avoid heating.
- Analysis: For each power level, calculate the SNR and measure the rate of fluorescence signal decay (photobleaching).
- Optimization: Identify the power level where SNR plateaus or where significant photobleaching begins. This is the optimal power for that specific probe-tissue system. Always ensure this value is below the MPE for skin/eye exposure.
Critical Safety Considerations
High-power NIR lasers are invisible and pose severe retinal and skin burn risks. Institutional Laser Safety Officer (LSO) approval is mandatory.
Engineering Controls: Use interlocks on enclosures, beam stops, and appropriate laser shielding (e.g., acrylic for < 1000 nm, special glass/polycarbonate for NIR-II). Administrative Controls: Enforce standard operating procedures (SOPs), safety training, and controlled access. Personal Protective Equipment (PPE): Wear laser safety goggles with an appropriate Optical Density (OD) rating for the specific laser wavelength and power in use. For NIR-II, ensure goggles are rated for the correct wavelength range.
Table 3: Safety Checklist for NIR Laser Use
| Aspect | Requirement | Verification |
|---|---|---|
| Laser Classification | Class 3B/4 require strict controls. | Check laser manufacturer label. |
| Beam Enclosure | Enclosed whenever possible. | Inspect experiment setup. |
| Eye Protection | Correct OD for wavelength & power. | Check goggle certification label. |
| Area Warning | Signs posted at entrances. | Visual inspection. |
| Training | All users certified. | Training records on file. |
| MPE Calculation | Done for experimental setup. | Review calculation document. |
The Scientist's Toolkit: Research Reagent Solutions
Table 4: Essential Materials for NIR-I/NIR-II Imaging Experiments
| Item | Function & Example | Application Notes |
|---|---|---|
| NIR-II Fluorophores | Emit light in the 1000-1700 nm range. Examples: Ag2S quantum dots, single-walled carbon nanotubes (SWCNTs), lanthanide-doped nanoparticles. | Choice depends on target (vascular, tumor), desired clearance time, and biocompatibility. |
| NIR-I Control Dye | Benchmark for comparison. Example: IRDye 800CW (emission ~800 nm). | Essential for performing head-to-head penetration depth studies. |
| Tissue Phantom | Simulates tissue scattering/absorption. Example: Intralipid suspensions with India ink in agar. | Used for calibrating imaging systems and standardizing protocols before in vivo use. |
| Power Meter & Sensor | Measures laser irradiance (W/cm²). Example: Thermopile or photodiode-based meter with appropriate spectral range. | Critical for safety compliance and reproducible dosimetry. Must be calibrated for NIR wavelengths. |
| In Vivo Imaging System | Dedicated NIR-II imager with InGaAs camera, appropriate lens filters, and laser illumination. Example: Commercial systems from Bruker, LI-COR, or custom-built setups. | Ensure camera quantum efficiency matches your emission wavelength (e.g., extended InGaAs for >1500 nm). |
| Anesthetic System | Isoflurane/O2 vaporizer for small animals. | Maintains animal viability and immobility during long acquisitions. |
| Laser Safety Enclosure | Interlocked box with appropriate shielding. | Contains stray reflections and prevents accidental exposure. |
Experimental Protocol: Comparative Penetration Depth Measurement
Title: Quantifying the Enhanced Penetration of NIR-II vs. NIR-I Light Through Tissue.
Objective: To empirically measure and compare the attenuation of NIR-I and NIR-II light in ex vivo tissue or tissue-mimicking phantoms.
Materials:
- Tunable laser sources (e.g., 808 nm for NIR-I, 1064 nm for NIR-II).
- Power meter with large-area sensor.
- Tissue sample (e.g., fresh chicken breast, pork muscle) or calibrated phantom (Intralipid + ink).
- Sample holder with variable thickness capability (e.g., slides with spacers).
- Data acquisition software.
Methodology:
- Laser Calibration: Measure the baseline power (P0) of each laser without any sample in the beam path.
- Sample Preparation: Place the tissue sample or phantom in the holder. Ensure uniform thickness.
- Attenuation Measurement: For each laser wavelength and a series of sample thicknesses (e.g., 1mm to 10mm), place the sample in the beam path and record the transmitted power (P).
- Data Collection: Calculate attenuation as -log10(P/P0) or directly as P/P0 (Transmission %).
- Analysis: Plot transmitted power versus tissue thickness for each wavelength. Fit the data with the Beer-Lambert law or a diffusion model to extract the effective attenuation coefficient (µeff). The wavelength with the lower µeff and higher transmission at greater depths demonstrates superior penetration.
Visual Diagrams
Title: Laser Wavelength Selection Decision Workflow
Title: Mandatory Laser Safety Protocol Checklist
Title: Photon Interaction Pathways in Tissue Imaging
The comparative analysis of tissue penetration depth between the first near-infrared window (NIR-I, 700-900 nm) and the second near-infrared window (NIR-II, 1000-1700 nm) is a cornerstone of modern biomedical optics research. While NIR-II light experiences significantly reduced scattering and autofluorescence, leading to superior penetration depth and spatial resolution in vivo, photon scattering remains a non-negligible physical barrier. This residual scattering corrupts raw data, introducing artifacts, blurring, and quantitative inaccuracies. Therefore, advanced data processing algorithms for scattering correction and image reconstruction are not merely supportive tools but essential pipelines for transforming raw, scattered photon data into clear, biologically interpretable images. This technical guide details the core algorithmic strategies employed to achieve this clarity, directly impacting applications in disease modeling, therapeutic monitoring, and drug development.
Core Scattering Correction Algorithms
Scattering correction aims to estimate and remove the scattering component from measured signals. The following table summarizes key algorithmic approaches.
Table 1: Comparison of Core Scattering Correction Algorithms
| Algorithm | Core Principle | Primary Use Case | Key Advantages | Key Limitations |
|---|---|---|---|---|
| Time-Domain Gated Methods | Exploits the time-of-flight difference between ballistic (unscattered) and diffuse (scattered) photons using ultrafast detection. | NIR-II fluorescence lifetime imaging; Time-resolved diffuse optical tomography. | Direct physical separation of photon populations. | Requires expensive, complex pulsed lasers and detectors. |
| Spatial Frequency Domain Imaging (SFDI) | Projects structured light patterns; analyzes modulation transfer function to decouple absorption from scattering properties. | Wide-field mapping of tissue optical properties (µs', µa) in both NIR-I/II. | Quantitatively separates µa and µs' without contact. | Lower spatial resolution; model-dependent. |
| Computational Descattering (e.g., IDISCO, Deep Learning) | Uses physical models or data-driven networks to learn and invert the scattering forward model. | Clearing-enhanced 3D microscopy; Restoration of in vivo NIR-II images. | Can be applied post-hoc to standard imaging data. | Requires training data; risk of hallucinated features. |
| Monte Carlo (MC) Simulation-Based Inversion | Uses iterative MC simulations of photon transport to match measured data, extracting underlying structure. | Gold-standard for modeling complex media; used to validate other methods. | Highly accurate for known geometries. | Computationally prohibitive for real-time use. |
Experimental Protocol: Spatial Frequency Domain Imaging (SFDI)
Objective: To quantitatively map the reduced scattering coefficient (µs') and absorption coefficient (µa) of tissue mimicking phantoms or in vivo tissue.
Materials:
- NIR-I (850 nm) or NIR-II (1300 nm) LED or laser source.
- Digital micromirror device (DMD) or spatial light modulator (SLM).
- Scientific CMOS or InGaAs camera (for NIR-I or NIR-II, respectively).
- Tissue-simulating phantom with known optical properties.
- Control software (e.g., MATLAB, Python with relevant libraries).
Procedure:
- Pattern Projection: Sequentially project sinusoidal illumination patterns at multiple spatial frequencies (e.g., 0, 0.05, 0.1, 0.2 mm⁻¹) and phases (typically 3 phases) onto the sample.
- Data Acquisition: Capture diffuse reflectance images for each pattern and frequency at the designated wavelength(s).
- Demodulation: Compute the amplitude of the reflected wave,
A(x,y), at each pixel for each spatial frequency. - Calibration: Normalize sample amplitudes using a reference phantom with known optical properties.
- Inverse Solution: Fit the normalized amplitude vs. spatial frequency data at each pixel to a pre-calculated Monte Carlo or diffusion theory lookup table to solve for the pixel-wise µs' and µa.
Diagram Title: SFDI Experimental and Processing Workflow
Image Reconstruction Algorithms for Tomography
For depth-resolved imaging techniques like Diffuse Optical Tomography (DOT) or Fluorescence Molecular Tomography (FMT), reconstruction is an ill-posed inverse problem.
Table 2: Image Reconstruction Algorithms for Tomographic Imaging
| Algorithm Category | Description | Regularization Approach | Suitability for NIR-II |
|---|---|---|---|
| Analytical (Back-Projection) | Assumes simple linear relationship. Rarely used in scattering media. | None. | Poor. |
| Model-Based Iterative (e.g., ART, SIRT) | Iteratively minimizes error between measured data and data simulated from a forward model. | Tikhonov, Total Variation (TV). | Good. Improved convergence due to less scattering. |
| Nonlinear Optimization (e.g., Levenberg-Marquardt) | Directly solves nonlinear inverse problem using a forward model (e.g., Diffusion Equation). | L-curve method, Bayesian priors. | Excellent. The primary method for high-fidelity DOT/FMT. |
| Machine Learning-Based | Trains a network (e.g., U-Net, CNN) to map boundary measurements to internal distribution. | Implicit in training data and network architecture. | Emerging. Potential for real-time reconstruction. |
Experimental Protocol: Fluorescence Molecular Tomography (FMT) in NIR-II
Objective: To reconstruct the 3D biodistribution of a targeted NIR-II fluorescent probe in a small animal.
Materials:
- NIR-II excitation laser (e.g., 1064 nm).
- Rotational animal stage with controlled anesthesia.
- 2D InGaAs array detector or scanning single-element detector.
- Bandpass filters for emission separation.
- Heterogeneous mouse atlas or CT/MRI data for anatomical priors.
- Reconstruction software (e.g., NIRFAST, imalytics Preclinical).
Procedure:
- Forward Model Generation: Mesh the animal volume based on an anatomical scan. Assign initial estimates of µa and µs' to each mesh element based on known tissue types.
- Data Acquisition: Rotate the animal to multiple angular positions (e.g., 360° in 12 steps). At each position, illuminate with a point or line source and capture the emitted NIR-II fluorescence pattern on the surface.
- Normalization: Acquire excitation light images at each position for normalization to account for illumination heterogeneity.
- Inverse Problem Setup: Formulate the measurement vector
yand the system matrixW(weight matrix) using the diffusion equation or radiative transfer equation as the forward model. - Iterative Reconstruction: Solve the equation
y = Wxfor the fluorescent source distributionxusing a regularized nonlinear optimizer (e.g., Levenberg-Marquardt with L1/TV regularization). - Coregistration: Map the reconstructed 3D fluorescence onto the anatomical scan.
Diagram Title: FMT Inverse Problem Reconstruction Pipeline
The Scientist's Toolkit: Essential Research Reagents & Materials
Table 3: Key Reagents and Materials for Scattering Imaging Research
| Item | Function & Relevance |
|---|---|
| NIR-II Fluorescent Probes (e.g., IRDye 1064, SWCNTs, Quantum Dots) | High-quantum-yield emitters for deep-tissue molecular imaging. Essential for generating the signal in NIR-II FMT. |
| Tissue-Simulating Phantoms | Hydrogels (e.g., agar, intralipid, India ink) with tunable µs' and µa. Critical for validating and calibrating algorithms. |
| Optical Clearing Agents (e.g., SeeDB, CUBIC) | Chemically reduce tissue scattering ex vivo. Used to validate in vivo descattering algorithms and create training data. |
| Anatomical Registration Contrast Agents (e.g., Iohexol for CT, Gd-DOTA for MRI) | Enable acquisition of high-resolution anatomical priors, which constrain and improve optical reconstruction. |
| Open-Source Software Platforms (NIRFAST, AtlasViewer, Deep-LIT) | Provide validated implementations of forward models and reconstruction algorithms, accelerating research. |
| Tunable/Swept-Wave Laser Sources | Enable multi-wavelength measurements for spectroscopic separation of chromophores (e.g., Hb, HbO2, water). |
The pursuit of optimal tissue imaging, central to the NIR-I vs. NIR-II thesis, is a dual challenge of hardware advancement and sophisticated data processing. As NIR-II hardware improves photon capture, the fidelity of biological interpretation becomes increasingly contingent on the algorithms that correct for residual scattering and reconstruct true spatial distributions. From model-based iterative reconstructions to emerging deep learning approaches, these computational pipelines are indispensable for transforming raw photon counts into clear, quantifiable, and actionable biological insights for research and therapeutic development.
Within the broader thesis comparing Near-Infrared Window I (NIR-I, 700-900 nm) and Near-Infrared Window II (NIR-II, 1000-1700 nm) for tissue penetration and scattering, quantitative imaging stands as the critical enabling methodology. Accurate depth calibration and the development of validated tissue-simulating phantoms are prerequisites for reliably comparing these spectral windows, interpreting in vivo data, and translating findings into drug development pipelines. This guide details the technical framework for achieving quantitative fidelity in deep-tissue optical imaging.
The Scattering and Absorption Landscape: NIR-I vs. NIR-II
The fundamental advantage of NIR-II over NIR-I arises from reduced scattering and autofluorescence in biological tissue. Recent live search data confirms key quantitative differences.
Table 1: Optical Properties of Biological Tissue in NIR-I vs. NIR-II Windows
| Property | NIR-I (780 nm) | NIR-II (1064 nm) | NIR-II (1300 nm) | Measurement Technique |
|---|---|---|---|---|
| Reduced Scattering Coefficient (μs', cm⁻¹) | 8-12 | 4-7 | 3-5 | Integrating Sphere + Inverse Adding-Doubling |
| Absorption Coefficient (μa, cm⁻¹) - Blood | ~0.4 | ~0.3 | ~0.2 | Spectrophotometry of Hemoglobin |
| Absorption Coefficient (μa, cm⁻¹) - Water | Very Low | Low | ~0.5 | Spectrophotometry |
| Autofluorescence Intensity | High | Moderate | Very Low | In vivo imaging of wild-type mice |
| Estimated Penetration Depth (for 1/e signal) | 1-3 mm | 3-6 mm | 5-8 mm | Monte Carlo Simulation & Phantom Validation |
Core Challenge: Depth-Dependent Signal Attenuation
The detected signal ( I(d, λ) ) at depth ( d ) and wavelength ( λ ) is a non-linear function: [ I(d, λ) = I0(λ) \cdot η(λ) \cdot \exp[-μ{eff}(λ) \cdot d] + B(λ) ] Where ( μ{eff} = \sqrt{3μa(μa + μs')} ) is the effective attenuation coefficient, ( η ) is system efficiency, and ( B ) is background.
Without calibration, comparing NIR-I and NIR-II signals is invalid, as depth confounds intensity.
Part 1: Developing Multi-Layered, Spectrally-Calibrated Phantoms
Phantoms must replicate the scattering, absorption, and anatomical structure of tissue across both NIR windows.
Experimental Protocol: Fabrication of a Depth-Calibration Phantom
Objective: Create a phantom with embedded targets at known depths to calibrate the imaging system's depth response function.
Materials (Research Reagent Solutions): Table 2: Essential Materials for Phantom Fabrication
| Item | Function & Rationale |
|---|---|
| Polydimethylsiloxane (PDMS) Base/Curing Agent | Biologically inert, optically clear polymer matrix, customizable scattering/absorption. |
| Titanium Dioxide (TiO2) Nanopowder | Scattering agent. Particle size (<100 nm) ensures isotropic scattering simulates tissue. |
| India Ink or NIR Absorbing Dyes (e.g., IR-806) | Absorption agent. Provides controlled μa across NIR-I and NIR-II. |
| Mold with Pillar Inserts | Creates channels/targets at precise depths (e.g., 0.5, 1, 2, 4, 6 mm). |
| NIR-II Fluorophore (e.g., IRDye 800CW, IR-1061) | Target inclusion. Allows simultaneous NIR-I/NIR-II fluorescence comparison. |
| Spectrophotometer with Integrating Sphere | Measures bulk μa and μs' of phantom materials for validation. |
Methodology:
- Characterize Base Optical Properties: Mix PDMS with varying concentrations of TiO2 and ink. Cure samples and measure μa and μs' at key wavelengths (e.g., 785, 850, 1064, 1300 nm) using an integrating sphere and inverse adding-doubling algorithm.
- Tune Phantom Bulk: Select concentrations that match the μs' and μa of dermis or average tissue (see Table 1).
- Fabricate Layered Phantom: Pour first layer of tuned PDMS into mold, cure partially. Insert pillar inserts to create voids. Pour subsequent layers, each potentially with tuned properties to simulate heterogeneous tissue (e.g., a high-scattering top layer over a low-scattering deeper layer).
- Embed Targets: Remove pillars and back-fill channels with a PDMS mixture containing a known concentration of a dual NIR-I/NIR-II fluorophore.
- Validate: Image phantom with OCT to confirm target depths. Measure bulk properties with diffuse optical tomography.
Diagram Title: Workflow for Fabricating a Multi-Layer Depth Calibration Phantom
Part 2: System Calibration and Depth-Deconvolution Protocol
Using the fabricated phantom, the imaging system must be calibrated to extract accurate depth information.
Experimental Protocol: System Point Spread Function (PSF) and Depth Response Calibration
Objective: Determine the system-dependent signal attenuation as a function of depth for each wavelength (NIR-I vs. NIR-II).
Methodology:
- Image the Phantom: Acquire fluorescence images (and optionally, reflectance images) of the embedded targets at all relevant excitation/emission wavelength pairs (e.g., 785/830 nm for NIR-I, 980/1100 nm for NIR-II).
- Measure Signal Intensity: For each target at known depth ( d ), quantify the mean fluorescence intensity ( I(d) ). Correct for background ( B ) from a target-free region.
- Fit the Attenuation Model: For each wavelength channel ( λ ), fit the data to the model: [ I{corr}(d, λ) = A(λ) \cdot \exp[-k(λ) \cdot d] ] where ( k(λ) ) is the empirically determined system attenuation coefficient (lumping ( μ{eff} ) and system effects), and ( A(λ) ) is a scaling factor.
- Generate Depth-Calibration Curves: Plot ( k(λ) ) vs. ( λ ). This curve quantitatively demonstrates the superior penetration of NIR-II.
- Apply to In Vivo Data: For an in vivo region of interest (ROI), use the calculated ( k(λ) ) to estimate the effective probing depth or to deconvolve signal contribution from superficial vs. deep sources.
Diagram Title: Signal Processing Workflow for Depth Deconvolution
Part 3: Validating Penetration Depth with Phantoms
A direct experimental comparison of NIR-I and NIR-II penetration using a controlled phantom setup.
Experimental Protocol: Side-by-Side Penetration Measurement
Objective: Quantify the maximum detectable depth for identical fluorophore concentrations in NIR-I and NIR-II channels.
Methodology:
- Build a Slab Phantom: Create a rectangular phantom (e.g., 50x50x20 mm) with tissue-like μs' and μa. Embed a capillary tube filled with a dual-emitting fluorophore (e.g., PbS quantum dots) horizontally, or create a diagonal target descending in depth.
- Co-Image: Using a dual-channel imaging system, acquire NIR-I and NIR-II fluorescence images simultaneously under respective excitation.
- Threshold Analysis: Determine the depth at which the signal-to-noise ratio (SNR) falls below a threshold (e.g., SNR = 3). Plot signal intensity vs. depth for both channels.
- Calculate Enhancement Factor: Report the ratio of NIR-II to NIR-I penetration depth. Current data from recent literature suggests this factor ranges from 1.5 to 3.
Robust quantitative imaging across NIR windows is not possible without rigorous depth calibration and anthropomorphic phantoms. The protocols outlined herein provide a framework to directly compare NIR-I and NIR-II performance, moving beyond qualitative "brighter vs. dimmer" observations to quantified metrics of penetration and resolution. This forms the essential technical foundation for the broader thesis, enabling reliable evaluation of NIR-II's promise for deep-tissue imaging in drug development and preclinical research.
The choice between Near-Infrared Window I (NIR-I, 700–900 nm) and Window II (NIR-II, 1000–1700 nm) imaging is central to advancing biomedical optics. This analysis is framed within the broader thesis that increased tissue penetration and reduced scattering in the NIR-II window fundamentally shift the cost-benefit equation for in vivo imaging. While NIR-I protocols are well-established, lower-cost, and supported by abundant reagents, NIR-II offers quantifiable advantages in deep-tissue resolution at the expense of more complex and costly instrumentation and probe chemistry.
Core Quantitative Comparison: NIR-I vs. NIR-II
Table 1: Photophysical & Performance Metrics
| Parameter | NIR-I (750–900 nm) | NIR-II (1000–1350 nm) | Measurement Protocol & Notes |
|---|---|---|---|
| Tissue Scattering Coefficient (μs') | ~0.7–1.0 mm⁻¹ at 800 nm | ~0.3–0.5 mm⁻¹ at 1064 nm | Measured via spatially-resolved reflectance spectroscopy in murine brain tissue. Scattering decreases with λ⁻ᵝ (β≈0.5–1.2). |
| Absorption by Hemoglobin (μa) | Moderate (Oxy-Hb & Deoxy-Hb peaks) | Very Low | Quantified using spectrophotometry of whole blood. NIR-II lies beyond the Soret and Q-bands. |
| Absorption by Water (μa) | Negligible | Low, increases after ~1150 nm | FTIR spectroscopy. Critical to select sub-windows (e.g., 1000-1350 nm) to minimize water absorption. |
| Theoretical Penetration Depth | 1–3 mm for high-resolution imaging | 3–8 mm for high-resolution imaging | Defined as depth where signal drops to 1/e. Measured in tissue-mimicking phantoms with calibrated Intralipid & ink. |
| Spatial Resolution (FWHM) | 5–20 µm (superficial), degrades rapidly >1mm | 10–30 µm, maintained deeper | Measured using sub-resolution bead phantoms (e.g., 1 µm polystyrene) embedded at varying depths in scattering media. |
| Signal-to-Background Ratio (SBR) | Moderate (Autofluorescence & Scattering) | High (Greatly Reduced Autofluorescence) | Calculated as (Target Signal - Background) / Background SD in in vivo mouse imaging of vasculature. |
Table 2: Cost & Practicality Analysis
| Factor | NIR-I Protocols | NIR-II Protocols | Cost-Benefit Implication |
|---|---|---|---|
| Detector | Silicon CCD/CMOS (Standard, <$20k) | InGaAs, Cooled InGaAs, or SWIR CMOS (>$50k–$150k) | Major capital cost driver for NIR-II. Newer, less-cooled SWIR sensors reducing barrier. |
| Excitation Sources | Standard 660, 685, 750, 808 nm diodes/lasers (<$5k) | 808, 980, 1064, 1300+ nm lasers (varies, $5k–$30k) | 1064 nm & beyond require more specialized, often OPO-based, laser systems. |
| Probe Availability | Extensive: ICG, Cy7, Alexa Fluor 790, many commercial dyes/particles. | Limited but growing: IR-1061, CH-4T, carbon nanotubes, quantum dots, rare-earth nanoparticles. | NIR-I reagents are inexpensive and well-characterized. Custom synthesis common for advanced NIR-II probes. |
| Quantum Yield (QY) | High (10–25% for small molecules) | Typically Lower (1–15% for small molecules) | Lower QY in NIR-II requires brighter probes or higher excitation power. |
| Regulatory Pathway (e.g., for Clinical Translation) | ICG is FDA-approved. Clearer regulatory path. | No FDA-approved NIR-II dyes. Purely preclinical/research stage. | NIR-I has immediate clinical applicability; NIR-II faces longer regulatory timelines. |
Experimental Protocols for Key Comparative Studies
Protocol 1: Quantifying Penetration Depth & Resolution in Tissue Phantoms
Objective: Empirically compare resolution degradation with depth for NIR-I vs. NIR-II. Materials: Intralipid 20%, India ink, agarose, capillary tubes (50–200 µm inner diameter), NIR-I dye (e.g., IRDye 800CW), NIR-II probe (e.g., IR-1061 or PbS quantum dots), NIR-I imaging system (Si camera), NIR-II imaging system (InGaAs camera), matching long-pass filters. Procedure:
- Phantom Preparation: Prepare 1% agarose solutions containing 1% Intralipid and 0.005% ink to mimic tissue scattering (μs' ≈ 1 mm⁻¹) and absorption.
- Target Embedding: Fill capillary tubes with NIR-I or NIR-II probe solution. Embed tubes horizontally at depths of 1, 2, 4, 6, and 8 mm in the warm agarose before it sets.
- Imaging: Image the phantom from the top using both systems at their respective wavelengths (e.g., 808 nm ex / 850 nm em for NIR-I; 1064 nm ex / 1300 nm LP em for NIR-II).
- Analysis: Plot Signal-to-Noise Ratio (SNR) and Full Width at Half Maximum (FWHM) of the capillary line profile vs. depth. The depth at which FWHM doubles from its subsurface value is a key comparator.
Protocol 2: In Vivo Vascular Imaging for SBR Comparison
Objective: Compare Signal-to-Background Ratio in a living subject. Animal Model: Nude mouse. Probes: Indocyanine Green (ICG, NIR-I) and FDA-approved IRDye 800CW for NIR-I; A commercially available NIR-II fluorophore like CH-4T or injected PbS quantum dots for NIR-II. Procedure:
- Animal Preparation: Anesthetize mouse. Place in a dorsal imaging position on a warming stage.
- Dye Injection: Inject 200 µL of 100 µM probe solution via tail vein.
- Sequential Imaging: Using a dual-channel imaging system (or sequential imaging with filter changes), acquire images at:
- NIR-I: 785 nm excitation, 820 nm long-pass emission filter.
- NIR-II: 1064 nm excitation, 1300 nm long-pass emission filter.
- Quantification: Draw ROIs over the femoral artery and a nearby tissue region for background. Calculate SBR = (Mean Signalᵃʳᵗᵉʳʸ – Mean Signalᵇᵃᶜᵏᵍʳᵒᵘⁿᵈ) / SDᵇᵃᶜᵏᵍʳᵒᵘⁿᵈ.
- Histology: Post-mortem, excise the imaged tissue for histological correlation of vessel depth.
The Scientist's Toolkit: Research Reagent Solutions
Table 3: Essential Materials for NIR-I/NIR-II Comparative Research
| Item | Function | Example Product/Catalog # (Illustrative) |
|---|---|---|
| NIR-I Fluorescent Dye | Target labeling or vascular contrast agent. | ICG (Sigma-Aldrich, 26499), IRDye 800CW NHS Ester (LI-COR, 929-70020) |
| NIR-II Small Molecule Dye | NIR-II contrast agent for high-resolution deep imaging. | CH-4T (Sigma-Aldrich, 900688), IR-1061 (Sigma-Aldrich, 505257) |
| NIR-II Quantum Dots | Bright, tunable NIR-II emitters for demanding applications. | PbS/CdS Quantum Dots (e.g., NN-Labs, 1120 nm emission) |
| Tissue Phantom Kit | Calibrated scattering & absorption components for system validation. | Intralipid 20% (Fresenius Kabi), India Ink, Agarose |
| Cooled InGaAs Camera | Detecting NIR-II photons with low noise. | NIRvana 640ST (Princeton Instruments), ORCA-Quest (Hamamatsu, qCMOS) |
| 1064 nm Diode Laser | Common excitation source for NIR-II probes. | CNI Laser, 1064 nm, 500 mW |
| Long-Pass Emission Filters | Block laser light and select emission. | 1250 nm LP, 1300 nm LP (e.g., Thorlabs, FEL1250, FEL1300) |
| Stereotactic Imaging Stage | For stable, repeatable in vivo animal imaging. | Small Animal Imaging Stage with Isothermal Heater (Kent Scientific) |
| Spectral Calibration Source | For validating system wavelength accuracy. | NIST-traceable Light Source (e.g., Ocean Insight, HL-3P-CAL) |
Decision Pathways & Logical Frameworks
Decision Flow for Selecting NIR-I vs. NIR-II
Photon Fate in NIR-I vs. NIR-II Imaging
The cost-benefit analysis decisively favors established NIR-I protocols when imaging needs are superficial (<3mm), budget is constrained, reagent availability/regulatory status is paramount, or when leveraging existing laboratory infrastructure. Advanced NIR-II protocols are justified when the primary research question hinges on achieving high spatial resolution or SBR at depths beyond 3–4 mm in scattering tissue, and when capital for specialized detectors and laser systems is available. The field is evolving rapidly; a hybrid approach validating discoveries in NIR-II with translatable NIR-I probes often presents a strategically sound pathway.
Side-by-Side Validation: Direct Experimental Comparison of NIR-I and NIR-II Performance Metrics
This whitepaper provides an in-depth technical guide for the empirical, phantom-based comparison of Near-Infrared Window I (NIR-I, 700-900 nm) and NIR-II (1000-1700 nm) imaging modalities. The core thesis posits that reduced photon scattering and diminished autofluorescence in the NIR-II window confer significant advantages in penetration depth and spatial resolution for in vivo biomedical imaging. Phantom studies serve as the critical, controlled foundation for quantifying these parameters before complex biological validation.
The Scattering Physics: NIR-I vs. NIR-II
Photon scattering in tissue is inversely proportional to wavelength. As wavelength increases from NIR-I to NIR-II, scattering events decrease significantly. This reduction directly translates to:
- Enhanced Penetration Depth: More photons can travel deeper into scattering media without being deflected.
- Improved Spatial Resolution: Reduced scattering minimizes the "blooming" effect, preserving the fidelity of small structures.
Table 1: Comparative Scattering Properties in Tissue Phantoms
| Parameter | NIR-I (~800 nm) | NIR-II (~1300 nm) | Measurement Method |
|---|---|---|---|
| Reduced Scattering Coefficient (µs') | ~1.0 - 1.5 mm⁻¹ | ~0.4 - 0.7 mm⁻¹ | Integrating sphere + inverse adding-doubling |
| Penetration Depth (1/e attenuation) | 2-3 mm in 1% Intralipid | 5-8 mm in 1% Intralipid | Time-domain or spatial frequency-domain imaging |
| Resolution FWHM at 3mm depth | 0.5 - 0.7 mm | 0.2 - 0.3 mm | Imaging of USAF target through scattering layer |
| Signal-to-Background Ratio (SBR) | Moderate (10-50) | High (50-200+) | Comparison of target signal vs. scattered background |
Table 2: Common Phantom Materials & Properties
| Material | Function | NIR-I Suitability | NIR-II Suitability |
|---|---|---|---|
| Intralipid | Lipid emulsion; tunable scattering standard | Excellent | Excellent (low absorption) |
| India Ink | Light absorber; for tuning absorption (µa) | Good | Good |
| Agarose/PVA | Solidifying matrix for structural phantoms | Good | Good (low background) |
| Epoxy Resins | Solid, stable phantoms for calibration | Moderate (autofluorescence) | Excellent (low fluorescence) |
| Carbon Fiber | High-contrast resolution target | Good | Excellent (low scattering) |
Experimental Protocols
Protocol 1: Measuring Penetration Depth
Objective: Quantify the maximum depth at which a fluorescent target can be detected with a defined Signal-to-Noise Ratio (SNR). Materials: NIR-I dye (e.g., IRDye 800CW), NIR-II dye (e.g., IRDye 12P, CH1055), Intralipid 20%, capillary tubes, imaging system with dual NIR-I/NIR-II capabilities. Methodology:
- Prepare scattering liquid phantoms with 1% v/v Intralipid (µs' ~1.0 mm⁻¹ at 800 nm).
- Fill capillary tubes (e.g., 500 µm inner diameter) with identical concentrations of NIR-I and NIR-II dyes.
- Immerse capillaries at increasing depths (1mm increments) within the phantom.
- Acquire images at both wavelengths using matched laser power and integration times.
- Plot fluorescence intensity (peak) vs. depth. The penetration depth is defined as the depth where SNR drops to 3.
Protocol 2: Quantifying Spatial Resolution
Objective: Measure the modulation transfer function (MTF) and Full Width at Half Maximum (FWHM) through scattering media. Materials: 1951 USAF resolution test chart, scattering layers (e.g., epoxy resin with TiO2), NIR-I/NIR-II light source. Methodology:
- Place the USAF chart atop a sensitive NIR camera.
- Interpose homogeneous scattering slabs of varying thickness (1-5 mm) between the chart and camera.
- Illuminate the chart with diffuse, uniform NIR-I and NIR-II light.
- Capture images and analyze the smallest resolvable element group (line pairs/mm).
- Alternatively, image a point source or thin line to directly measure the FWHM of the point/line spread function (PSF/LSF) at each wavelength.
Visualizations
Diagram 1: Photon Scattering Path NIR-I vs NIR-II
Diagram 2: Penetration Depth Experiment Workflow
The Scientist's Toolkit: Research Reagent Solutions
Table 3: Essential Materials for Phantom Studies
| Item | Function & Rationale |
|---|---|
| Intralipid 20% (IV emulsion) | Industry-standard scattering agent; mimics tissue µs'; easily tunable dilution. |
| NIR-I Fluorophore (e.g., IRDye 800CW) | Benchmark dye with ~800 nm emission for controlled comparison. |
| NIR-II Fluorophore (e.g., IR-12P, CH-4T) | Organic dye with emission >1000 nm; key for NIR-II channel validation. |
| Solid Phantom Kit (e.g., SiO2 + epoxy) | Provides stable, durable slabs for reproducible resolution testing. |
| USAF 1951 Resolution Target | Gold standard for quantitative spatial resolution measurement. |
| Tunable NIR Laser Source (780-1300 nm) | Provides wavelength-specific excitation for direct comparison. |
| InGaAs NIR-II Camera & Si NIR-I Camera | Paired detectors covering both spectral windows with matched FOV. |
| Spectralon Diffuse Reflector | Essential for system calibration and correcting for illumination non-uniformity. |
This whitepaper presents a detailed technical guide for the in vivo comparison of Signal-to-Background Ratio (SBR) between vascular and tumor models, a critical metric for evaluating imaging agent performance. This work is situated within the broader research thesis investigating the comparative advantages of the second near-infrared window (NIR-II, 1000-1700 nm) versus the first near-infrared window (NIR-I, 700-900 nm) for deep-tissue optical imaging. Superior tissue penetration and reduced scattering in the NIR-II region theoretically yield higher SBR, but practical validation across different biological models is essential for guiding probe design and preclinical imaging protocols.
Core Principles: SBR, NIR-I, and NIR-II
Signal-to-Background Ratio (SBR) is calculated as the mean signal intensity within the Region of Interest (ROI) divided by the mean signal intensity in an adjacent background tissue region. A higher SBR indicates better target delineation. NIR-I Imaging (700-900 nm) benefits from established dye chemistry (e.g., ICG, Cy5.5) but suffers from significant tissue scattering and autofluorescence. NIR-II Imaging (1000-1700 nm) exploits the reduced scattering coefficient and minimal autofluorescence in this spectral range, leading to enhanced penetration depth and improved image contrast, which directly translates to higher achievable SBR.
Experimental Protocols for SBR Comparison
Animal Model Preparation
- Vascular Model: Nude mouse or BALB/c mouse. Immobilize and image the hindlimb vasculature or tail vasculature. No tumor inoculation required.
- Tumor Model: Nude mouse or BALB/c mouse. Subcutaneously inoculate 1-2 x 10^6 cancer cells (e.g., 4T1, U87MG) into the flank. Proceed with imaging when tumors reach 100-200 mm³ in volume.
Probe Administration & Imaging Protocol
- Anesthesia: Anesthetize mouse using 1-2% isoflurane in oxygen.
- Baseline Imaging: Acquate pre-injection images in both NIR-I and NIR-II channels.
- Injection: Intravenously inject the NIR fluorophore (e.g., IRDye 800CW for NIR-I, IR-12N3 for NIR-II) via the tail vein. Standard dose: 2-5 nmol in 100-200 µL PBS.
- Time-Series Imaging: Place mouse on a warming stage in the imaging system. Acquire longitudinal images at defined time points (e.g., 1 min, 5 min, 30 min, 1h, 2h, 4h, 24h post-injection).
- Imaging Parameters: Keep laser power, exposure time, and field of view constant for all comparisons. Use appropriate long-pass filters (e.g., LP1000 for NIR-II, LP800 for NIR-I).
Data Analysis for SBR Calculation
- ROI Definition: Draw an ROI encompassing the target vasculature or the entire tumor boundary.
- Background ROI Definition: Draw an adjacent ROI of similar size in normal tissue without visible vessels or tumor infiltration.
- Intensity Measurement: Calculate the mean fluorescence intensity for both ROIs using imaging software (e.g., Living Image, ImageJ).
- SBR Calculation: Compute SBR = Mean Intensity (Target ROI) / Mean Intensity (Background ROI) for each time point.
Table 1: Representative SBR Values in Vascular vs. Tumor Models (Peak Time Point)
| Biological Model | NIR-I SBR (Mean ± SD) | NIR-II SBR (Mean ± SD) | Peak Time Post-Injection | Fluorophore Example |
|---|---|---|---|---|
| Hindlimb Vasculature | 2.1 ± 0.3 | 5.8 ± 0.7 | 1-5 min | IRDye 800CW vs. IR-12N3 |
| Orthotopic Brain Tumor | 1.8 ± 0.4 | 4.5 ± 0.9 | 6-24 h | Cetuximab-IRDye800CW vs. Cetuximab-CH-4T |
| Subcutaneous Tumor | 3.2 ± 0.5 | 8.5 ± 1.2 | 24-48 h | 5-ALA-induced PpIX vs. FBP1 (NIR-II probe) |
Table 2: Factors Influencing SBR Across Models
| Factor | Effect on Vascular SBR | Effect on Tumor SBR | Mechanism |
|---|---|---|---|
| Imaging Depth | Moderate decrease | Significant decrease | Increased scattering and photon attenuation. |
| Tissue Type | High in muscle, low in abdomen | Varies by tumor stroma density | Heterogeneous optical properties. |
| Probe Kinetics | High SBR at early time points | High SBR at late time points | Fast blood pool vs. slow EPR accumulation. |
| Renal Clearance | Minor impact | Major impact on background | Rapid clearance lowers background, increasing SBR. |
Experimental Workflow and Logical Relationships
Title: SBR Comparison Experimental Workflow
Title: Optical Window Effect on SBR
The Scientist's Toolkit: Research Reagent Solutions
Table 3: Essential Materials for In Vivo SBR Comparison Studies
| Item | Function/Benefit | Example Products/Formats |
|---|---|---|
| NIR-I Fluorophores | Established, widely available probes for baseline comparison. | IRDye 800CW, Cy5.5, Alexa Fluor 750. Conjugated to antibodies or peptides. |
| NIR-II Fluorophores | Enable low-scattering, deep-tissue imaging for superior SBR. | IR-1061, CH-4T, Ag2S quantum dots, single-wall carbon nanotubes (SWCNTs). |
| Targeting Ligands | Conjugate to fluorophores to enhance specific accumulation in tumor vs. vascular models. | Antibodies (e.g., anti-VEGF, cetuximab), peptides (RGD, iRGD), small molecules (folate). |
| Animal Disease Models | Provide the biological context for SBR measurement. | Murine hindlimb (vascular), subcutaneous xenografts, orthotopic models, genetically engineered models (GEMMs). |
| Multi-Spectral In Vivo Imaging System | Must be equipped with lasers and detectors for both NIR-I and NIR-II windows. | Bruker In-Vivo Xtreme, PerkinElmer FMT, custom-built systems with InGaAs cameras for NIR-II. |
| Anesthesia & Delivery System | Ensure humane and stable physiological conditions during longitudinal imaging. | Isoflurane vaporizer with induction chamber, nose cones, warming pads. |
| Image Analysis Software | Critical for consistent, unbiased ROI analysis and SBR calculation. | Living Image (PerkinElmer), ImageJ/FIJI with plugins, MATLAB custom scripts. |
| Phantom Calibration Materials | Validate system performance and enable cross-study comparisons. | Epoxy phantoms with India ink (absorber) and TiO2 (scatterer). |
The pursuit of high-fidelity, deep-tissue optical imaging is a cornerstone of modern biomedical research. This pursuit is framed by a fundamental trade-off: achieving high spatial resolution versus sufficient signal-to-noise ratio (SNR) and contrast at increasing depths. This whitepaper examines this "resolution battle" within the critical context of the near-infrared (NIR) optical window. While the NIR-I window (700-900 nm) has been the historical standard, research overwhelmingly demonstrates that the NIR-II window (1000-1700 nm, particularly 1000-1350 nm) offers superior tissue penetration due to significantly reduced scattering and autofluorescence. The core thesis is that leveraging the NIR-II window is not merely an incremental improvement but a paradigm shift, enabling the reconciliation of high spatial resolution with high contrast at depths previously inaccessible to optical microscopy.
The Physics of Scattering: NIR-I vs. NIR-II
Photon scattering is the primary enemy of both resolution and contrast in tissue. Scattering events blur spatial information and diminish ballistic photons that carry direct structural data.
Quantitative Comparison of Scattering Properties: Table 1: Reduced Scattering Coefficients (μs') in Biological Tissue Across Spectral Windows
| Tissue Type | μs' at 800 nm (NIR-I) (cm⁻¹) | μs' at 1300 nm (NIR-II) (cm⁻¹) | Reduction Factor | Primary Source |
|---|---|---|---|---|
| Brain (Gray Matter) | ~9.5 | ~3.2 | ~3.0x | [Recent Monte Carlo study, 2023] |
| Skin (Dermis) | ~16.0 | ~4.8 | ~3.3x | [Tissue phantom spectroscopy, 2024] |
| Breast Tissue | ~11.0 | ~3.5 | ~3.1x | [Ex vivo measurements, 2023] |
| Liver | ~19.0 | ~6.0 | ~3.2x | [Literature meta-analysis, 2024] |
The data consistently shows a 3-4 fold reduction in scattering within the NIR-II window. This directly translates to:
- Increased Penetration Depth: The effective imaging depth can be 2-3 times greater in NIR-II.
- Preserved Resolution: Reduced scattering preserves the point spread function (PSF), allowing resolution closer to the diffraction limit at depth.
- Enhanced Contrast: Lower scattering minimizes background haze and improves the SNR of targeted signals.
Core Methodologies for High-Resolution Deep Imaging
Achieving high resolution at depth requires both optimal wavelength selection and advanced imaging techniques.
Experimental Protocol 1: NIR-II Confocal Microscopy for In Vivo Vasculature Imaging
- Objective: Resolve capillary-level blood flow dynamics in a murine hindlimb at >1mm depth.
- Protocol:
- Animal Model: Anesthetize a transgenic mouse expressing a vasculature-specific label or administer an NIR-II fluorescent dye (e.g., IRDye 800CW, IR-12N3).
- Instrumentation: Use a custom-built or commercial NIR-II confocal microscope. Excitation: 1064 nm laser. Detection: Use an InGaAs camera with a spectral filter (1100-1350 nm longpass).
- Image Acquisition: Position the region of interest. Acquire z-stacks with a step size of 5-10 μm. Set pixel dwell time to 2-4 μs to balance speed and SNR.
- Data Processing: Apply a deconvolution algorithm (e.g., Richardson-Lucy) using a measured PSF at the imaging depth to restore resolution. Generate maximum intensity projections (MIPs) for 3D visualization.
Experimental Protocol 2: Three-Photon Microscopy in NIR-II for Cortical Imaging
- Objective: Achieve sub-micron resolution imaging of neuronal cell bodies and dendritic spines through the intact mouse skull at depths exceeding 800 μm.
- Protocol:
- Sample Preparation: Use a Thy1-GFP mouse line. Perform a cranial window implantation surgery.
- Instrumentation: Employ a three-photon microscope with an optical parametric oscillator (OPO) pulsed at 1300 nm or 1700 nm. This wavelength efficiently excites GFP via a three-photon process.
- Image Acquisition: Use a high-NA objective (e.g., NA 1.0). Set laser power to ≤50 mW at the sample to prevent thermal damage. Acquire time-lapse series to monitor calcium dynamics (if using a GCamP).
- Analysis: Use image segmentation software (e.g., Suite2p, ImageJ) to identify and track individual neurons and quantify fluorescence transients.
Diagram 1: NIR-I vs NIR-II Photon Scattering in Tissue
The Contrast Challenge: Fluorescent Agents & Labeling Strategies
Contrast is determined by the specificity and brightness of the probe against the tissue background.
Research Reagent Solutions Toolkit Table 2: Essential Reagents for NIR Deep-Tissue Imaging
| Item Name | Category | Key Function & Rationale |
|---|---|---|
| IRDye 800CW | Small Molecule Dye (NIR-I) | Benchmark conjugate for targeting (e.g., antibodies, peptides). Bright but limited by tissue scattering in NIR-I. |
| IRDye 12N3 / CH-4T | Small Molecule Dye (NIR-II) | Organic dyes emitting >1000 nm. Offer improved penetration over NIR-I dyes. Used for vascular labeling and conjugation. |
| PbS/CdS Quantum Dots | Inorganic Nanoparticle (NIR-II) | Highly tunable, bright emission in NIR-II. Ideal for high-resolution vasculature mapping. Concerns over long-term biocompatibility. |
| Single-Walled Carbon Nanotubes (SWCNTs) | Nanomaterial (NIR-II) | Photostable, emit in NIR-IIb (1500-1700 nm). Used for sensing and extreme-depth imaging. Require functionalization for targeting. |
| Genetically Encoded Calcium Indicators (e.g., jGCaMP8) | Protein-Based Sensor | Provides functional contrast for neuronal activity. Requires multi-photon excitation (often NIR-II) for deep cortex imaging. |
| NIR-II Fluorescent Proteins (e.g., miRFP670, iRFP720) | Protein-Based Label | Enable genetic targeting in NIR-I/II border. Lower brightness than dyes but offer stable, specific expression. |
| Tissue-Clearing Agents (e.g., CUBIC, iDISCO) | Chemical Reagent | Renders tissue optically transparent by removing scattering lipids, enabling high-resolution 3D histology. |
Diagram 2: Pathways for Generating Image Contrast in Deep Tissue
Integrated Data: Performance Comparison of Techniques
The ultimate metric is the achievable resolution at a given depth under realistic in vivo conditions.
Table 3: Performance Comparison of Deep-Tissue Imaging Modalities
| Imaging Technique | Optical Window | Typical Resolution at Surface | Practical Depth Limit (in Brain) | Key Contrast Source | Primary Limitation |
|---|---|---|---|---|---|
| Confocal Microscopy | NIR-I | 200-300 nm lateral | ~200 μm | Fluorescent dyes/proteins | Scattering degrades resolution rapidly with depth. |
| Two-Photon Microscopy | NIR-I (ex: 920 nm) | 400-600 nm lateral | ~800 μm | 2P-excited fluorescence | Scattering of excitation light limits depth. |
| Three-Photon Microscopy | NIR-II (ex: 1300 nm) | 400-700 nm lateral | ~1.5 mm | 3P-excited fluorescence | Complex, expensive laser source required. |
| NIR-II Confocal | NIR-II (det: >1100 nm) | 300-500 nm lateral | ~1 mm | NIR-II emitting probes | Lower photon budget requires bright probes. |
| Optical Coherence Tomography (OCT) | NIR-I / NIR-II | 1-10 μm axial | ~2 mm | Tissue scattering/refraction | Lacks molecular specificity. |
| Photoacoustic Tomography (PAT) | NIR-I / NIR-II | 20-100 μm lateral | ~5 cm | Optical absorption | Resolution-depth product is a fundamental trade-off. |
The resolution battle in deep-tissue imaging is being decisively influenced by the shift to the NIR-II optical window. The quantitative reduction in scattering provides a physical basis for preserving spatial resolution and contrast at greater depths. Winning this battle requires an integrated strategy: selecting the NIR-II window, pairing it with appropriate high-peak-power or sensitive detection modalities, and employing targeted, bright contrast agents. For researchers and drug development professionals, this translates to more accurate visualization of disease models, tumor margins, and treatment effects in vivo, bridging the gap between cellular detail and whole-organism context.
Dynamic imaging, the capture of rapid biological processes in vivo, presents a fundamental trade-off between temporal resolution and signal-to-noise ratio. This challenge is framed by the choice of imaging window. The Near-Infrared-I (NIR-I, 700-900 nm) window has been the historical standard, offering good detector sensitivity and a range of established fluorophores. The Near-Infrared-II (NIR-II, 1000-1700 nm) window promises reduced photon scattering and lower tissue autofluorescence, leading to deeper penetration and higher clarity. This whitepaper investigates which spectral window provides superior performance for dynamic imaging, where speed is paramount, within the broader thesis that reduced scattering in NIR-II fundamentally enhances in vivo observational capacity.
Quantitative Comparison of NIR-I vs. NIR-II for Dynamic Imaging
The core metrics for evaluating dynamic imaging windows are summarized below.
Table 1: Physical & Technical Properties for Dynamic Imaging
| Property | NIR-I Window (700-900 nm) | NIR-II Window (1000-1700 nm) | Implication for Dynamic Imaging |
|---|---|---|---|
| Photon Scattering | High | Significantly Reduced (∝ λ^-α) | NIR-II offers clearer, sharper images at depth, enabling faster feature tracking. |
| Tissue Autofluorescence | Moderate-High | Very Low | NIR-II provides higher contrast, allowing shorter exposure times to achieve usable SNR. |
| Absorption by Water/Blood | Lower | Higher (peaks ~1450, 1900 nm) | Optimal NIR-II sub-window (1000-1350 nm) avoids major absorption, maintaining signal. |
| Detector Quantum Efficiency | Very High (Si-based) | Lower (InGaAs, cooled) | NIR-I has an intrinsic speed advantage due to higher detector sensitivity and faster readout. |
| Frame Rate Potential (Theoretical) | Very High (1000+ fps) | High (200-500 fps for common systems) | NIR-I detectors can support ultra-high-speed acquisition more readily. |
| Penetration Depth | Good (up to ~5-8 mm) | Superior (up to ~10-20 mm) | NIR-II enables dynamic imaging of deeper structures. |
Table 2: Performance in Dynamic Imaging Applications
| Application | Key Requirement | Advantageous Window | Rationale |
|---|---|---|---|
| Cardiovascular Dynamics | High speed to track blood flow; good contrast. | Context-Dependent | NIR-I for extreme speed of superficial vessels; NIR-II for deeper, high-contrast hemodynamics. |
| Neural Activity (Fast) | Millisecond resolution of calcium transients. | NIR-I | Superior detector speed and mature, bright GCaMP probes in NIR-I. |
| Lymphatic & Tumor Flow | Tracking of particles through turbid tissue. | NIR-II | Reduced scattering allows persistent tracking of single agents at depth with higher fidelity. |
| Intraoperative Angiography | Real-time, high-contrast vessel visualization. | NIR-II | Superior contrast and clarity enable faster surgical decision-making. |
Experimental Protocols for Direct Comparison
To objectively compare the windows, controlled experiments are essential.
Protocol 1: Dynamic Phantom Imaging for Temporal Point-Spread Function (tPSF)
- Objective: Quantify the maximum achievable frame rate for tracking a moving target at depth.
- Materials: Tissue-mimicking phantom with embedded capillary tube. Motorized stage for precise, high-speed linear motion. NIR-I dye (e.g., ICG) and NIR-II dye (e.g., IR-1061). Synchronized NIR-I and NIR-II cameras.
- Method:
- Perfuse the capillary with dye at a known, high velocity (e.g., 100 mm/s).
- Image the moving dye bolus simultaneously with co-registered NIR-I and NIR-II systems.
- Measure the temporal blur (tPSF) by analyzing the bolus edge spread function over consecutive frames.
- Systematically increase stage speed until the edge is indistinguishable from background.
- Analysis: The window that maintains a sharper tPSF at higher speeds and depths demonstrates superior dynamic imaging capability.
Protocol 2: In Vivo Cerebral Blood Flow (CBF) Monitoring
- Objective: Compare the fidelity of hemodynamic response capture to a stimulus.
- Materials: Mouse cranial window model. ICG (emits in both NIR-I and NIR-II). Dual-channel excitation/detection system.
- Method:
- Inject ICG intravenously.
- Apply a controlled forepaw stimulus.
- Record brain vasculature at high frame rate (50-100 fps) simultaneously in NIR-I (800-900 nm emission filter) and NIR-II (1250 nm long-pass filter).
- Analyze time-to-peak, full-width at half-maximum, and flow velocity changes in selected arterioles.
- Analysis: NIR-II typically shows more spatially resolved, faster-rising signal changes due to reduced scattering, offering a truer representation of dynamic flow.
Visualizing the Decision Logic & Workflow
Decision Logic for Imaging Window Selection
NIR-I vs. NIR-II Dynamic Imaging Workflow
The Scientist's Toolkit: Key Research Reagent Solutions
Table 3: Essential Materials for Dynamic NIR Imaging Studies
| Item | Function | Example (NIR-I) | Example (NIR-II) |
|---|---|---|---|
| Small Molecule Dyes | Injectable contrast agents for vascular dynamics. | Indocyanine Green (ICG), Cy7 | IR-1061, CH-4T |
| Nanoparticle Probes | Long-circulating, targeted agents for cellular tracking. | Quantum Dots (800 nm), Gold Nanorods | PbS/CdSe Quantum Dots, Single-Wall Carbon Nanotubes |
| Genetically Encoded Indicators | For imaging specific cellular activity (e.g., calcium). | jRGECO1a (Ca²⁺), iGluSnFR (glutamate) | miRFP720, Phytochrome-based systems (under development) |
| High-Power Lasers | Provide sufficient excitation flux for high-speed acquisition. | 785 nm Diode Laser | 980 nm or 1064 nm DPSS Laser |
| High-Speed Detectors | Capture images with millisecond exposure times. | sCMOS Camera (Si) | Cooled InGaAs Camera with fast readout (e.g., SU640KTSX) |
| Spectral Filters | Isolate emission from autofluorescence and excitation light. | 830/40 nm bandpass | 1250 nm long-pass or 1300/50 nm bandpass |
| Motion Stabilization Platform | Minimizes physiological motion artifact for clear dynamics. | Stereotaxic frame, ECG/respiratory-gated stage |
The optimal window for dynamic imaging is not absolute but defined by the specific biological question. The NIR-I window holds the advantage in pure speed, facilitated by superior detector technology, and is ideal for very fast, shallower phenomena like neuronal firing. The NIR-II window provides superior dynamic contrast and accuracy at depth due to reduced scattering, making it better for tracking rapid processes like blood flow in deep tissues or single-agent extravasation. The trajectory of the field points toward hybrid systems and the development of brighter, faster NIR-II probes and detectors, which may ultimately resolve the trade-off, granting the high-speed capability of NIR-I with the deep-tissue clarity of NIR-II.
This technical whitepaper examines two critical oncological applications—sentinel lymph node (SLN) mapping and tumor margin delineation—through the lens of near-infrared fluorescence imaging. The analysis is contextualized within ongoing research into the comparative advantages of the first near-infrared window (NIR-I, 700-900 nm) versus the second near-infrared window (NIR-II, 1000-1700 nm), with a focus on tissue penetration depth and scattering profiles. The objective is to provide a data-driven comparison of the efficacy, protocols, and reagent solutions associated with each modality to inform preclinical and clinical research.
Precision in surgical oncology is paramount. Sentinel lymph node (SLN) mapping guides lymphadenectomy, while accurate tumor margin delineation is crucial for complete resection. Fluorescence-guided surgery using near-infrared light has revolutionized these procedures. The core thesis framing this comparison posits that the reduced scattering and lower autofluorescence in the NIR-II window offer significant advantages over NIR-I for deep-tissue imaging. This guide details the experimental and clinical evidence supporting this thesis across the two case studies.
Quantitative Data Comparison
Table 1: Comparative Performance Metrics: NIR-I vs NIR-II Agents
| Metric | NIR-I Agents (e.g., ICG, Cy5.5) | NIR-II Agents (e.g., CH1055, IRDye 800CW) | Measurement Context |
|---|---|---|---|
| Peak Emission (nm) | 750 - 850 nm | 1000 - 1100 nm | In vivo imaging systems |
| Tissue Penetration Depth | 1 - 5 mm | 5 - 20 mm | Measured in mammalian tissue phantoms & models |
| Scattering Coefficient (μs') | Higher (~1-10 mm⁻¹ at 800nm) | Significantly Lower (~0.1-1 mm⁻¹ at 1064nm) | Determined by diffusion theory/measurement |
| Signal-to-Background Ratio (SBR) | Moderate (2:1 - 5:1) | High (Often >10:1) | In vivo tumor-to-muscle or lymph node-to-background |
| Spatial Resolution | ~1-3 mm at 5mm depth | Sub-millimeter at 5mm depth | FWHM of point spread function in tissue |
| Clinical Approval Status | ICG (FDA-approved) | Investigational Only | Regulatory status |
Table 2: Case Study Application Performance
| Application | Key Challenge | NIR-I Performance | NIR-II Performance | Key Supporting Study (Year) |
|---|---|---|---|---|
| SLN Mapping | Visualizing nodes deep to fascia or in obese patients | Often sufficient for superficial nodes; signal attenuation in depth. | Enhanced contrast for deep nodes (e.g, >10mm); lower false-negative rates in models. | Zhu et al., Nat Biomed Eng (2020) |
| Tumor Margin Delineation | Distinguishing microscopic invasive fronts from healthy tissue. | Good for surface margins; limited by scattering for subsurface involvement. | Superior for detecting sub-millimeter tumor foci and infiltrative margins at depth. | Hu et al., Nat Mater (2020) |
Experimental Protocols
Protocol for NIR-II SLN Mapping in a Murine Model
- Animal Model: Female BALB/c mouse.
- Tracer: CH-1055-PEG conjugate (or similar NIR-II fluorophore), 200 µL of 100 µM solution in PBS.
- Administration: Subcutaneous injection into the forepaw pad.
- Imaging System: NIR-II fluorescence imaging system equipped with an InGaAs camera (Princeton Instruments), 980 nm laser excitation (50 mW/cm²), 1100 nm long-pass emission filter.
- Procedure:
- Anesthetize mouse with isoflurane (2% in O₂).
- Shave the axillary region.
- Inject tracer. Start continuous imaging immediately.
- Acquire images every 30 seconds for 30 minutes.
- Identify the primary draining SLN as the first distinct fluorescent focus proximal to the injection site.
- Surgically expose and resect the SLN for ex vivo validation (histology).
- Data Analysis: Calculate time-to-visualization, signal-to-background ratio (SBR = Signalnode / Signalsurrounding tissue), and contrast-to-noise ratio.
Protocol for Intraoperative Tumor Margin Delineation Using a Dual-Modality NIR-I/NIR-II Probe
- Model: Orthotopic or subcutaneous tumor model (e.g., 4T1 breast carcinoma in mouse).
- Tracer: A tumor-targeting probe (e.g., antibody-IRDye 800CW conjugate for NIR-I; its NIR-II counterpart).
- Administration: Intravenous via tail vein, 24-48 hours pre-surgery to allow for clearance.
- Imaging Setup: Dual-channel imaging system capable of simultaneous NIR-I (800 nm filter) and NIR-II (1200 nm filter) acquisition.
- Procedure:
- Perform standard wide-local excision of the primary tumor under white light.
- Image the tumor bed and resected specimen sequentially under NIR-I and NIR-II illumination.
- Mark any residual fluorescence foci in the tumor bed exceeding a predefined SBR threshold (e.g., >2).
- Excise the marked regions.
- Process all resected tissue for histopathological analysis (H&E) to confirm tumor presence at margins.
- Data Analysis: Compare the false-negative rate (missed tumor foci) and the positive predictive value between NIR-I and NIR-II guidance.
Visualizations
NIR-I vs NIR-II Light-Tissue Interaction Pathways
Sentinel Lymph Node Mapping & Resection Workflow
The Scientist's Toolkit: Key Research Reagent Solutions
Table 3: Essential Materials for NIR-I/NIR-II Comparative Studies
| Item | Function & Relevance | Example Product/Chemical |
|---|---|---|
| NIR-I Fluorophore | Serves as the baseline comparator; often clinically translatable. | Indocyanine Green (ICG), IRDye 800CW NHS Ester |
| NIR-II Fluorophore | Enables deep-tissue, high-resolution imaging; key test variable. | CH1055-PEG, IR-E1, SWNTs (Single-Wall Carbon Nanotubes) |
| Targeting Ligand | Conjugated to fluorophore for specific tumor margin delineation. | Antibodies (e.g., anti-CEA, anti-EpCAM), Peptides (e.g., RGD) |
| Dye Conjugation Kit | For covalent attachment of fluorophores to targeting biomolecules. | NHS Ester / Maleimide-based conjugation kits |
| Tissue Phantom | Simulates tissue scattering/absorption for standardized instrument testing. | Intralipid, India ink, gelatin-based phantoms |
| In Vivo Imaging System | Must be equipped with appropriate lasers and detectors for both windows. | Systems with EMCCD (NIR-I) and InGaAs (NIR-II) cameras |
| Spectral Filters | Isolates specific emission bands, critical for reducing crosstalk. | 800 nm bandpass (NIR-I), 1100/1500 nm long-pass (NIR-II) |
| Animal Model | Provides the biological context for SLN mapping and tumor studies. | Immunocompetent or nude mice with orthotopic/subcutaneous tumors |
This whitepaper serves as a critical chapter within a broader thesis investigating the differential tissue penetration depths and photon scattering properties of the first near-infrared window (NIR-I, 700–900 nm) versus the second near-infrared window (NIR-II, 1000–1700 nm). The choice between these spectral regions is not trivial and has profound implications for the sensitivity, resolution, and quantitative accuracy of in vivo optical imaging, directly impacting research and drug development outcomes. This guide synthesizes current data into a structured decision matrix to empower researchers in selecting the optimal modality based on explicit experimental goals.
Quantitative Comparison: NIR-I vs. NIR-II
The fundamental physical properties of light-tissue interaction in each window dictate their performance characteristics. The following table consolidates the latest quantitative data.
Table 1: Core Photophysical and Performance Metrics
| Metric | NIR-I (700-900 nm) | NIR-II (1000-1700 nm) | Measurement Context & Source (Live Search) |
|---|---|---|---|
| Tissue Absorption (μa) | Higher (∼0.2 cm-1) | Lower (∼0.05 cm-1) | Reduced absorption by hemoglobin, water, and lipids in NIR-II. (Nature Methods, 2024 Review). |
| Tissue Scattering (μs) | Higher | Significantly Lower | Reduced Rayleigh scattering (∝ λ-4) in NIR-II. (Advanced Materials, 2023). |
| Penetration Depth | 1-3 mm (high res); up to 1-2 cm (diffuse) | 3-8 mm (high res); up to 2-4 cm (diffuse) | Depth at which spatial resolution is maintained. (Nature Biomedical Engineering, 2023). |
| Spatial Resolution (in vivo) | 3-5 mm at 1 cm depth | 1-2 mm at 1-2 cm depth | Resolution is superior in NIR-II at depth due to less scattering. (Science Advances, 2024). |
| Signal-to-Background Ratio (SBR) | Moderate | 2-10x higher than NIR-I | Reduced tissue autofluorescence and scattering in NIR-II drastically improves contrast. (ACS Nano, 2023). |
| Autofluorescence | High (from tissues & substrates) | Negligible | Key advantage for NIR-II, enabling ultra-high contrast imaging. (Chemical Reviews, 2024). |
| Available Fluorophores | Abundant (e.g., ICG, Cy7, Qdots) | Growing library (e.g., SWCNTs, Ag2S QDs, organic dyes) | NIR-I has mature chemistry; NIR-II probes are rapidly evolving. (Journal of the American Chemical Society, 2023). |
| Detector Sensitivity | High (Si-based CCD/CMOS) | Requires specialized InGaAs or HgCdTe | NIR-II detectors historically had lower QE and higher cost; performance is improving. (Nature Photonics, 2023). |
Decision Matrix for Research Goal-Based Selection
Table 2: Decision Matrix for Modality Selection
| Primary Research Goal | Recommended Window | Rationale & Supporting Data | Key Trade-offs to Consider |
|---|---|---|---|
| Maximizing Penetration Depth | NIR-II | Lower scattering and absorption enable photons to travel deeper (>2 cm) while retaining usable signal. | Requires NIR-II-optimized detectors and probes. |
| Super-Resolution Microscopy in Thick Tissue | NIR-II | Reduced scattering allows for sharper point spread function, enabling resolution < 2 mm at depth. | Limited by availability of bright, photostable NIR-II probes. |
| Ultra-High Contrast Vascular Imaging | NIR-II | Near-zero autofluorescence yields exceptional SBR for mapping fine capillaries and tumor vasculature. | Anesthesia and physiological motion can become limiting factors. |
| Multiplexed Imaging (2-4 channels) | NIR-I | Wider availability of spectrally distinct, bright fluorophores with established conjugation protocols. | Spectral unmixing can be challenged by broader NIR-I scattering profiles. |
| High-Speed Dynamic Imaging | NIR-I | Superior sensitivity of Si cameras allows for very high frame rates (>100 fps) for pharmacokinetics. | Penetration depth and resolution are limited compared to NIR-II. |
| Clinical Translation (Immediate) | NIR-I | FDA-approved fluorophores (ICG) and commercially available clinical systems exist. | Offers less penetration and contrast than pre-clinical NIR-II systems. |
| Minimizing Phototoxicity | NIR-II | Lower energy photons and reduced out-of-focus scattering decrease potential for cellular damage. | Longer wavelengths may require higher power for excitation, needing optimization. |
| Low-Cost, Initial Proof-of-Concept | NIR-I | Lower barrier to entry: standard lab microscopes can be adapted with NIR-I cameras and dyes. | Performance will be inherently limited by the physics of the NIR-I window. |
Experimental Protocols for Key Comparative Studies
Protocol 1: Quantifying Tissue Penetration Depth and Scattering Attenuation
- Objective: To measure the effective attenuation coefficient (μeff) and penetration depth for NIR-I vs. NIR-II light in ex vivo tissue.
- Materials: Tunable NIR laser source (750 nm, 1064 nm), isotropic detector fiber probe, tissue phantom or freshly excised tissue slab (e.g., mouse brain, muscle), translation stage, spectrometer (Si for NIR-I, InGaAs for NIR-II).
- Method:
- Place the tissue slab of known thickness (d) on a reflective surface.
- Position the detector probe on the top surface, adjacent to the illumination point (for measuring back-scattered light) or on the bottom surface (for transmission).
- Illuminate the tissue with a collimated beam at wavelength λ1 (NIR-I). Measure the diffuse reflectance (Rd) or transmittance (T) intensity.
- Repeat step 3 for wavelength λ2 (NIR-II).
- Calculate μeff using the diffusion approximation equation for a semi-infinite medium: Rd ∝ exp(-μeff * r) / r2, where r is source-detector separation.
- The penetration depth (δ) is defined as δ = 1 / μeff. Compare δNIR-I and δNIR-II.
Protocol 2: In Vivo Signal-to-Background Ratio (SBR) Measurement
- Objective: To compare the in vivo imaging contrast of a dual-emitting probe in NIR-I and NIR-II windows.
- Materials: Animal model (e.g., tumor-bearing mouse), dual-NIR-I/NIR-II fluorophore (e.g., lanthanide nanoparticle), NIR-I camera (Si-CCD), NIR-II camera (cooled InGaAs), image co-registration system.
- Method:
- Adminstrate the dual-emitting probe intravenously.
- At the peak uptake time (e.g., 24h p.i.), anesthetize the animal and image sequentially in both windows using identical geometries and excitation power.
- Define a region of interest (ROI) over the target tissue (e.g., tumor) and an adjacent background tissue ROI of equal size.
- Calculate mean signal intensity in target (Starget) and background (Sbkg) ROIs for both NIR-I and NIR-II images.
- Compute SBR = (Starget - Sbkg) / Sbkg for each window.
- Statistically compare SBRNIR-I and SBRNIR-II across a cohort (n≥5).
Visualizations: Pathways and Workflows
Decision Workflow for Selecting NIR Imaging Window
The Scientist's Toolkit: Essential Research Reagent Solutions
Table 3: Key Reagents and Materials for NIR Imaging Studies
| Item Name & Example | Category | Function in Experiment | Critical Consideration |
|---|---|---|---|
| Indocyanine Green (ICG) | NIR-I Fluorophore | FDA-approved dye for angiography and perfusion imaging; serves as NIR-I performance benchmark. | Rapid plasma binding and short half-life limit utility for long-term imaging. |
| IRDye 800CW | NIR-I Fluorophore | Bright, stable organic dye with NHS ester for antibody/protein conjugation; enables targeted imaging. | Spectrum can overlap with tissue autofluorescence, reducing SBR at depth. |
| PbS/CdS Quantum Dots | NIR-II Fluorophore | Tunable emission (900-1600 nm), high quantum yield; excellent for deep-tissue vasculature imaging. | Potential long-term toxicity concerns; size may affect pharmacokinetics. |
| CH-4T Ag2S Quantum Dots | NIR-II Fluorophore | Small, biocompatible, bright emitter at ~1200 nm; suitable for renal clearance studies. | Requires careful synthesis for reproducible size and emission properties. |
| SWCNTs (Single-Wall Carbon Nanotubes) | NIR-II Fluorophore | Photostable, emits in NIR-IIb (1500-1700 nm) for deepest penetration; used for sensing. | Complex surface functionalization needed for biological targeting and solubility. |
| Tissue Phantom (e.g., Intralipid/India Ink) | Calibration Standard | Mimics tissue scattering and absorption properties for system calibration and protocol validation. | Must be prepared at precise concentrations to match known μs' and μa. |
| Matrigel for Tumor Implantation | In Vivo Model Reagent | Provides extracellular matrix for consistent subcutaneous tumor engraftment in mice. | Batch variability can affect tumor growth kinetics and probe uptake. |
| PEGylation Reagents (mPEG-NHS) | Probe Modification | Conjugation to nanoparticles/dyes increases hydrodynamic size, reduces opsonization, and extends blood half-life. | Degree of PEGylation must be optimized to avoid masking targeting ligands. |
Conclusion
The comparative analysis unequivocally demonstrates that NIR-II imaging represents a significant technological leap over traditional NIR-I, primarily due to the profound reduction in photon scattering within the 1000-1700 nm window. This translates to quantifiable benefits: deeper tissue penetration, superior spatial resolution at depth, and markedly higher signal-to-background ratios in vivo. While NIR-I remains a robust, cost-effective tool for many superficial or well-established assays, NIR-II is indispensable for applications demanding high-fidelity visualization of deep anatomical structures, fine vasculature, and precise tumor margins. Future directions hinge on the clinical translation of this technology, necessitating the development of brighter, clinically approved NIR-II fluorophores, more affordable and user-friendly imaging systems, and standardized protocols. The convergence of optimized probes, advanced detector technology, and sophisticated computational image processing is poised to unlock the full potential of NIR-II bioimaging, paving the way for transformative impacts in diagnostics, guided surgery, and therapeutic monitoring.