Beyond the Visible: Overcoming NIR-II Imaging Challenges for Clinical Translation and Drug Development
This article provides a comprehensive roadmap for translating second near-infrared (NIR-II) window imaging from a powerful preclinical research tool into a robust clinical and drug development technology.
Beyond the Visible: Overcoming NIR-II Imaging Challenges for Clinical Translation and Drug Development
Abstract
This article provides a comprehensive roadmap for translating second near-infrared (NIR-II) window imaging from a powerful preclinical research tool into a robust clinical and drug development technology. We explore the fundamental principles and unique advantages of NIR-II imaging, including superior tissue penetration and reduced autofluorescence. The core of the discussion focuses on identifying and analyzing the primary translational challenges: material biocompatibility, long-term safety, scalable and reproducible contrast agent synthesis, and the development of cost-effective, user-friendly imaging systems. Methodological solutions, from novel probe design to instrument optimization and standardized imaging protocols, are examined. We detail troubleshooting strategies for common in vivo artifacts and performance limitations. Finally, the article critically assesses validation frameworks and benchmarks NIR-II against established clinical imaging modalities (e.g., MRI, CT, NIR-I). Targeted at researchers, scientists, and drug development professionals, this work synthesizes current strategies and future directions to accelerate the clinical adoption of NIR-II bioimaging.
Demystifying NIR-II Imaging: Principles, Promises, and the Path to the Clinic
Technical Support Center: NIR-II Imaging Troubleshooting
Thesis Context: This support center is designed to assist researchers in overcoming technical hurdles in NIR-II imaging, directly supporting thesis research focused on translating this technology into reliable clinical solutions.
Troubleshooting Guides & FAQs
Q1: My NIR-II image appears excessively noisy and lacks contrast. What are the primary causes and solutions? A: High noise often stems from insufficient signal-to-background ratio (SBR). Key troubleshooting steps:
- Check Probe Concentration: Ensure your contrast agent (e.g., single-walled carbon nanotubes, quantum dots, organic dyes) is administered at an optimal concentration. Too low yields weak signal; too high can cause quenching or aggregation.
- Verify Excitation Power: Use a power meter to confirm laser output. Insufficient excitation power reduces signal. Ensure you stay within safe exposure limits for biological samples.
- Assess Detector Cooling: For InGaAs cameras, ensure the sensor is cooled to the specified temperature (typically -80°C to -60°C). High detector temperature dramatically increases dark noise.
- Filter Integrity: Inspect long-pass emission filters for damage or degradation. Use a spectrometer to confirm their cutoff profile. Light leakage from excitation or NIR-I emission drastically reduces contrast.
Q2: I observe inconsistent tissue penetration depth and signal fidelity across different mouse models or anatomical sites. How can I standardize this? A: Variability is common due to differences in tissue scattering and absorption properties. Implement this protocol:
- Characterize Tissue Optics: For your specific tissue type (e.g., brain vs. tumor vs. muscle), review published values for scattering coefficient (μs') and absorption coefficient (μa) in the NIR-II window.
- Use a Phantom for Calibration: Before in vivo experiments, calibrate your system using tissue-simulating phantoms with known optical properties. This establishes a baseline penetration profile.
- Control Physiological Variables: Anesthetize and monitor animal temperature consistently. Hypothermia alters blood flow and can affect probe distribution and background signal.
Q3: My NIR-II fluorescent probe shows unexpected biodistribution or rapid signal loss in vivo. What should I investigate? A: This points to potential probe instability or biofouling.
- Perform Serum Stability Test: Incubate the probe with mouse serum at 37°C and measure fluorescence intensity over time (e.g., 0, 1, 2, 4, 6, 24 hours) using a NIR-II spectrometer.
- Check Surface Functionalization: If using nanoparticles, confirm the stability and completeness of the PEG coating or other functionalization meant to prevent opsonization and rapid clearance.
- Control Injection Quality: Ensure the probe is filtered (0.22 μm) before injection to remove aggregates that cause nonspecific accumulation and are cleared by the reticuloendothelial system.
Table 1: Optical Properties of Biological Tissues in NIR-I vs. NIR-II Windows
| Tissue Type | Wavelength | Scattering Coefficient (μs') [cm⁻¹] | Absorption Coefficient (μa) [cm⁻¹] | Estimated Penetration Depth (mm) |
|---|---|---|---|---|
| Brain (Gray Matter) | 800 nm (NIR-I) | ~15 | ~0.2 | 3-4 |
| Brain (Gray Matter) | 1300 nm (NIR-II) | ~8 | ~0.4 | 5-7 |
| Skin & Muscle | 800 nm (NIR-I) | ~12 | ~0.3 | 4-5 |
| Skin & Muscle | 1300 nm (NIR-II) | ~6 | ~0.2 | 7-9 |
| Breast Tissue | 1064 nm (NIR-IIa) | ~7 | ~0.1 | 8-12 |
Table 2: Common NIR-II Fluorophores and Key Parameters
| Fluorophore Type | Peak Emission (nm) | Quantum Yield (%) | Extinction Coefficient (M⁻¹cm⁻¹) | Typical Coating/Modification |
|---|---|---|---|---|
| PbS Quantum Dots | 1200-1600 | 10-15 | ~1e5 - 1e6 | PEG, silica shell |
| Single-Walled Carbon Nanotubes | 1000-1400 | 1-3 | ~1e7 (per cm) | DNA, PEG-phospholipid |
| Organic Dye (IR-26) | ~1200 | <0.1 | ~1e4 | Encapsulation in micelles |
| Lanthanide Nanoparticles | 1525 | ~0.1 | N/A | Core-shell, PEG |
Experimental Protocols
Protocol: System Characterization for SBR Optimization
- Objective: Quantify the Signal-to-Background Ratio (SBR) of your NIR-II imaging system.
- Materials: NIR-II imaging system, capillary tubes, PBS, NIR-II fluorophore solution, black background plate.
- Method:
- Prepare capillary tubes with serial dilutions of your NIR-II fluorophore in PBS and a PBS-only control.
- Place capillaries on a non-reflective black plate in the imaging chamber.
- Acquire images using your standard in vivo acquisition settings (laser power, exposure time, filters).
- Use image analysis software (e.g., ImageJ) to draw regions of interest (ROIs) on each capillary and on the adjacent background.
- Calculate mean signal intensity for each fluorophore concentration (Signal) and for the background (Background). SBR = (Signal - Background) / Background.
- Plot SBR vs. concentration to determine the optimal dose for in vivo studies.
Protocol: Ex Vivo Validation of In Vivo Targeting
- Objective: Confirm the specific accumulation of a targeted NIR-II probe.
- Materials: Dissected organs/tissues, NIR-II imaging system, scale, 4% PFA.
- Method:
- After terminal in vivo imaging, perfuse the animal with PBS followed by 4% PFA.
- Dissect out target tissues (e.g., tumor, liver, spleen, kidney, muscle) and rinse in PBS.
- Weigh each tissue and place them on the imaging stage.
- Acquire ex vivo NIR-II images using the same settings as in vivo.
- Quantify fluorescence intensity per mg of tissue for each organ.
- Compare intensity in target vs. off-target organs to calculate a targeting ratio (e.g., Tumor-to-Muscle Ratio).
Visualization Diagrams
Title: NIR-II Imaging Experimental Workflow for Clinical Translation
Title: Physics of NIR-II Window: Pathways to Superior Imaging
The Scientist's Toolkit: Key Research Reagent Solutions
Table 3: Essential Materials for NIR-II Imaging Experiments
| Item | Function & Rationale |
|---|---|
| Indium Gallium Arsenide (InGaAs) Camera | The standard detector for NIR-II light (900-1700 nm). Requires thermoelectric cooling to -80°C to minimize dark current noise. |
| 1064 nm or 808 nm Diode Laser | Common excitation sources. 1064 nm offers deeper penetration and lower tissue scattering/absorption than 808 nm. |
| Long-pass Emission Filters (>1200 nm, >1300 nm, >1500 nm) | Critically blocks excitation laser light and shorter-wavelength fluorescence (including NIR-I), isolating the true NIR-II signal. |
| Dichroic Beamsplitter | Separates excitation and emission light paths in an epi-illumination microscope setup. Must match laser and emission filter wavelengths. |
| Tissue-Simulating Phantoms | Liquid or solid phantoms with calibrated scattering and absorption properties for system validation and standardization across labs. |
| PEG-phospholipid (DSPE-PEG) | Standard coating agent for nanoparticles to confer water solubility, improve biocompatibility, and prolong blood circulation time. |
| ICG (Indocyanine Green) | FDA-approved NIR-I dye (∼800 nm emission). Useful as a benchmark and for dual NIR-I/NIR-II comparative studies. |
| Matrigel | Used for subcutaneous tumor cell implantation in mice to promote uniform tumor growth, relevant for oncology imaging studies. |
| Isoflurane/Oxygen Mix | Standard inhalant anesthetic for maintaining stable physiology during longitudinal in vivo imaging sessions. |
Technical Support & Troubleshooting Center
Frequently Asked Questions (FAQs)
Q1: In our in vivo tumor model, why is my NIR-II signal still weak despite using a high-dose probe? A: Weak signal often stems from excessive scattering and autofluorescence from superficial tissues. Ensure you are using a probe with an emission peak >1000 nm (e.g., >1300 nm for optimal performance). Check your imaging system's long-pass filter alignment; a filter with a sharp cut-on at 1500 nm (e.g., SWIR 1500) will dramatically reduce NIR-I autofluorescence. Confirm that your laser excitation is appropriately matched to the probe's absorption peak.
Q2: We observe high background in our NIR-IIb (1500-1700 nm) imaging, compromising vessel contrast. What could be the cause? A: High background in the NIR-IIb window is frequently due to insufficient blocking of shorter NIR wavelengths or water absorption artifacts. First, verify the integrity and specification of your optical filters—they must have an optical density (OD) >5 for out-of-band light. Second, ensure proper animal preparation; dehydration can alter tissue water content and scattering properties, increasing background noise. Applying a warm saline solution to keep the tissue hydrated can improve image quality.
Q3: How can we quantitatively validate the claim of "reduced scattering" in NIR-II imaging for our specific tissue sample? A: You can perform a direct comparison experiment. Image a fluorescent capillary tube embedded in a tissue phantom (e.g., intralipid solution or chicken breast tissue) at both NIR-I (e.g., 800 nm) and NIR-II (e.g., 1300 nm) wavelengths. Measure the full width at half maximum (FWHM) of the line profile across the tube. The reduction in FWHM at NIR-II wavelengths quantitatively demonstrates decreased scattering.
Q4: Our cell culture experiments show persistent autofluorescence in the NIR-II channel. Is this possible? A: While significantly reduced, some autofluorescence can persist, often from culture media components (e.g., phenol red, fetal bovine serum) or plasticware. Switch to phenol-red free media and image cells in specialized glass-bottom dishes validated for NIR-II imaging. Always include a control group without the NIR-II probe to identify and subtract any residual background.
Q5: What are the key hardware checks to maximize the benefits of NIR-II imaging? A: Regularly calibrate your InGaAs or other SWIR detector. Check for detector saturation, which is common due to the high sensitivity required. Ensure all optical components (lenses, filters) are specified for the SWIR range, as standard glass can absorb some NIR-II wavelengths. Maintain a cold environment for the detector to minimize thermal noise (dark current).
Troubleshooting Guides
Issue: Poor Spatial Resolution in Deep Tissue Imaging
- Step 1: Verify Emission Wavelength. Confirm your probe emits in the true NIR-II (>1000 nm) or NIR-IIb (>1500 nm) region. Shorter emissions (<1100 nm) experience more scattering.
- Step 2: Optimize Filters. Use a long-pass filter with a cut-on wavelength as close as possible to your probe's emission peak to block all shorter-wavelength noise.
- Step 3: System Calibration. Use a resolution target to measure the point spread function (PSF) of your system at different depths in a tissue phantom to characterize performance.
Issue: Inconsistent Signal-to-Background Ratio (SBR) Between Experiments
- Step 1: Standardize Animal Preparation. Control for anesthesia depth, body temperature (use a heating pad), and tissue hydration status, as all affect hemodynamics and scattering.
- Step 2: Normalize Imaging Parameters. Use a consistent laser power, integration time, and detector gain. Record these parameters meticulously.
- Step 3: Implement Background Subtraction. Always acquire an image prior to probe injection (baseline) and subtract it from post-injection images using the same imaging parameters.
Quantitative Data Comparison: NIR-II vs. NIR-I/Visible
Table 1: Comparison of Optical Properties Across Imaging Windows
| Property | Visible (400-700 nm) | NIR-I (700-900 nm) | NIR-II (1000-1700 nm) | NIR-IIb (1500-1700 nm) |
|---|---|---|---|---|
| Tissue Scattering | Very High | High | Reduced (~λ^-0.2 to λ^-1.4) | Minimal |
| Autofluorescence | Very High | Moderate | Low | Negligible |
| Photon Penetration Depth | Low (<1 mm) | Moderate (1-3 mm) | High (3-8 mm) | Very High |
| Spatial Resolution | Low (in tissue) | Moderate | High (Sub-10 μm possible) | Very High |
| Typical SBR | Low (<5) | Moderate (5-15) | High (10-100) | Very High (>100) |
Table 2: Example Performance Metrics for Vessel Imaging
| Metric | NIR-I (800 nm) | NIR-II (1300 nm) | Improvement Factor |
|---|---|---|---|
| FWHM of Imaged Capillary | ~120 μm | ~35 μm | ~3.4x Sharper |
| Signal-to-Background Ratio | ~5.2 | ~42.7 | ~8.2x Higher |
| Achievable Frame Rate | 30 fps | 20 fps | Trade-off for depth/SBR |
Experimental Protocols
Protocol 1: Direct Comparison of Scattering and Autofluorescence Objective: To quantitatively demonstrate reduced scattering and autofluorescence in the NIR-II window.
- Sample Preparation: Create a tissue phantom using 1% intralipid in a cuvette. Prepare a fluorescent solution (e.g., IR-1061 for NIR-II, ICG for NIR-I).
- Imaging Setup: Use a NIR-II imaging system equipped with a 1064 nm laser and an InGaAs camera. Configure a separate NIR-I system (785 nm laser, Si camera).
- Data Acquisition:
- Autofluorescence: Image the plain intralipid phantom with both systems using identical laser power and integration time.
- Scattering: Embed a capillary tube (inner diameter ~100 μm) filled with fluorescent solution into the phantom. Image with both systems.
- Analysis: Plot intensity profiles across the capillary tube. Calculate and compare the FWHM. Compare the mean background intensity from the autofluorescence images.
Protocol 2: In Vivo High-Resolution Vascular Imaging Objective: To achieve high-contrast, deep-tissue imaging of vasculature.
- Animal Model: Anesthetize a mouse (e.g., BALB/c) and place on a heating plate.
- Probe Administration: Intravenously inject 200 μL of a NIR-II fluorophore (e.g., CH-1055, 100 μM) via the tail vein.
- Imaging Parameters: Set excitation laser (e.g., 808 nm for CH-1055) to a safe power density (<100 mW/cm²). Use a 1500 nm long-pass filter to collect NIR-IIb signal. Set camera integration time to 50-100 ms.
- Image Capture: Acquire a pre-injection background image. Begin dynamic imaging immediately post-injection for 10 minutes. Capture high-resolution static images at 5-10 min post-injection.
- Processing: Subtract the pre-injection background. Apply a Gaussian blur (σ=1) for noise reduction if needed. Use line profile tools to measure vessel width.
The Scientist's Toolkit: Research Reagent Solutions
Table 3: Essential Materials for NIR-II Imaging Experiments
| Item | Function & Rationale |
|---|---|
| NIR-IIb Fluorophores (e.g., Ag2S QDs, Lanthanide-doped NPs, CH-1055) | Emit light >1500 nm, minimizing scattering and autofluorescence for maximum penetration and contrast. |
| 1500 nm Long-Pass Filter | Critically blocks all light below 1500 nm, enabling pure NIR-IIb signal collection and is key to reducing autofluorescence. |
| InGaAs Camera (Cooled) | Detects photons in the 900-1700 nm range. Cooling reduces dark current noise, essential for capturing weak NIR-II signals. |
| 1064 nm or 808 nm Laser | Common excitation sources that penetrate tissue well and match the absorption of many NIR-II probes. |
| Phenol Red-Free Media | Eliminates culture media-derived autofluorescence in cell-based or ex vivo imaging studies. |
| SWIR-Optimized Objectives/Lenses | Standard glass absorbs light >1400 nm; specialized optics (e.g., calcium fluoride) ensure high light throughput in the NIR-IIb window. |
Visualization Diagrams
Title: Photon-Tissue Interaction Across Spectral Windows
Title: NIR-II In Vivo Imaging Experimental Workflow
Technical Support Center: NIR-II Imaging for Clinical Translation Research
Frequently Asked Questions (FAQs) & Troubleshooting
Q1: Why is my acquired NIR-II image excessively noisy, even with prolonged acquisition time? A: This is commonly caused by insufficient probe concentration at the target site or suboptimal camera cooling. First, verify the in vivo pharmacokinetics of your contrast agent. For a 25g mouse, a typical indocyanine green (ICG) dose is 0.1-0.3 mg/kg intravenously. Ensure your NIR-II camera (e.g., InGaAs detector) is cooled to at least -80°C to minimize dark current noise. Check that all room lights and instrument status LEDs are covered, as even minor light leaks contribute to noise.
Q2: My NIR-II fluorescent probe shows excellent in vitro performance but fails to provide clear in vivo tumor contrast. What could be wrong? A: This often stems from poor biodistribution or off-target accumulation. Ensure your targeting moiety (e.g., antibody, peptide) has not been denatured during probe conjugation. Validate the expression level of your target antigen in the specific animal model being used via immunohistochemistry. Consider using a passive targeting approach (e.g., via the Enhanced Permeability and Retention - EPR - effect) with a probe size of 10-100 nm. Administer the probe via tail vein and image at the optimal time point (typically 6-48 hours post-injection, depending on probe clearance).
Q3: How do I quantify fluorescence intensity accurately for longitudinal therapeutic monitoring? A: Inconsistent quantification usually arises from a lack of calibration and standardization. Always include an internal or external reference standard (e.g., a capillary tube with a known concentration of dye) in the field of view. Use radiometric imaging if your probe allows. Maintain identical imaging parameters (laser power, exposure time, field of view, focus) across all sessions. Draw regions of interest (ROIs) consistently using anatomical landmarks. Express data as Target-to-Background Ratio (TBR) rather than raw intensity.
Q4: What are the common causes of high background autofluorescence in the NIR-II window, and how can it be reduced? A: While NIR-II (1000-1700 nm) has inherently lower tissue autofluorescence than visible or NIR-I regions, background can arise from poor probe design or food interference. Ensure your animal is on a low-fluorescence diet for at least 48 hours prior to imaging to reduce chlorophyll-derived autofluorescence. Use probes with large Stokes shifts (>150 nm) to minimize excitation light scattering into the detection channel. Implement spectral unmixing if using a multispectral system to separate signal from background.
Q5: During image-guided surgery simulation, my NIR-II signal bleaches rapidly. How can I improve photostability? A: Rapid photobleaching indicates insufficient probe stability. For organic dyes, consider encapsulating them in nanoparticles or albumin to shield them from the aqueous environment. For inorganic probes (e.g., quantum dots, carbon nanotubes), ensure they have a robust polymer or silica coating. Optimize your imaging setup: reduce laser power to the minimum required for a good signal-to-noise ratio and use pulsed excitation with gated detection if your system allows.
Experimental Protocols for Key NIR-II Experiments
Protocol 1: Standardized In Vivo Tumor Imaging and Quantification Objective: To acquire and quantify NIR-II fluorescence signal from a subcutaneous tumor model.
- Animal Preparation: Anesthetize mouse (e.g., 1.5% isoflurane in O₂). Shave the region of interest. Place mouse on a heated stage (37°C) in the imaging system.
- Probe Administration: Inject NIR-II contrast agent via tail vein. Recommended starting dose: 100 µL of 100 µM solution for small molecule dyes.
- Imaging: At predetermined time points (e.g., 0, 1, 6, 24, 48h), position animal. Use 808 nm or 980 nm laser for excitation (power density: 10-100 mW/cm²). Acquire image with InGaAs camera (exposure: 50-500 ms, binning: 2x2).
- Analysis: Using analysis software (e.g., ImageJ, Living Image), draw ROI over tumor (T) and contralateral background tissue (B). Calculate TBR = Mean Fluorescence Intensity (T) / Mean Fluorescence Intensity (B).
Protocol 2: Ex Vivo Biodistribution Validation Objective: To validate in vivo imaging results and quantify probe accumulation in organs.
- Perfusion: At terminal time point, deeply anesthetize animal. Perform transcardial perfusion with 20-30 mL of 1X PBS to clear blood from organs.
- Organ Harvest: Excise tissues of interest (tumor, liver, spleen, kidneys, heart, lungs, muscle). Weigh each organ.
- Ex Vivo Imaging: Place organs on a black plate in the NIR-II imaging system. Acquire image using identical settings as for in vivo imaging.
- Quantification: Draw ROI around each whole organ. Calculate fluorescence signal per gram of tissue: (Total Flux in ROI) / (Organ Weight).
Data Presentation: Key NIR-II Agent Performance Metrics
Table 1: Comparison of Representative NIR-II Imaging Contrast Agents
| Agent Class | Example Material | Excitation (nm) | Emission Peak (nm) | Quantum Yield (%) | Hydrodynamic Size (nm) | Primary Clinical Application Target |
|---|---|---|---|---|---|---|
| Organic Dye | IRDye 800CW | 774 | 789 (NIR-I) | 13 | ~1 | Lymphatic mapping |
| Organic Dye | CH1055-PEG | 755 | 1055 | 0.3 | ~8 | Tumor delineation |
| Inorganic | PbS Quantum Dots | 808 | 1300 | 15 | 10-15 | Vascular imaging |
| Carbon-based | Single-Wall Carbon Nanotubes | 785 | 1000-1400 | 1-3 | 200-1000 (length) | Tumor targeting |
| Lanthanide | Er³⁺-doped Nanoparticles | 980 | 1525 | <0.1 | 20-50 | Bone imaging |
Table 2: Typical Performance Targets for Clinical Translation of NIR-II Probes
| Parameter | Minimum Target for Preclinical Use | Ideal Target for Clinical Translation |
|---|---|---|
| Target-to-Background Ratio (TBR) | >2.0 | >3.5 |
| Photostability (Signal loss after 5 min irradiation) | < 30% | < 10% |
| Brightness (ε × Φ)⁰ | > 10³ M⁻¹cm⁻¹ | > 10⁵ M⁻¹cm⁻¹ |
| Toxicity (Maximum Tolerated Dose) | > 10 mg/kg (mouse) | > 2 mg/kg (human equivalent) |
| Clearance Half-life (from blood) | < 24 hours | < 4 hours (for renal clearance) |
| ε: molar extinction coefficient, Φ: quantum yield |
Visualizations
Diagram 1: NIR-II Imaging Workflow for Tumor Surgery Guidance
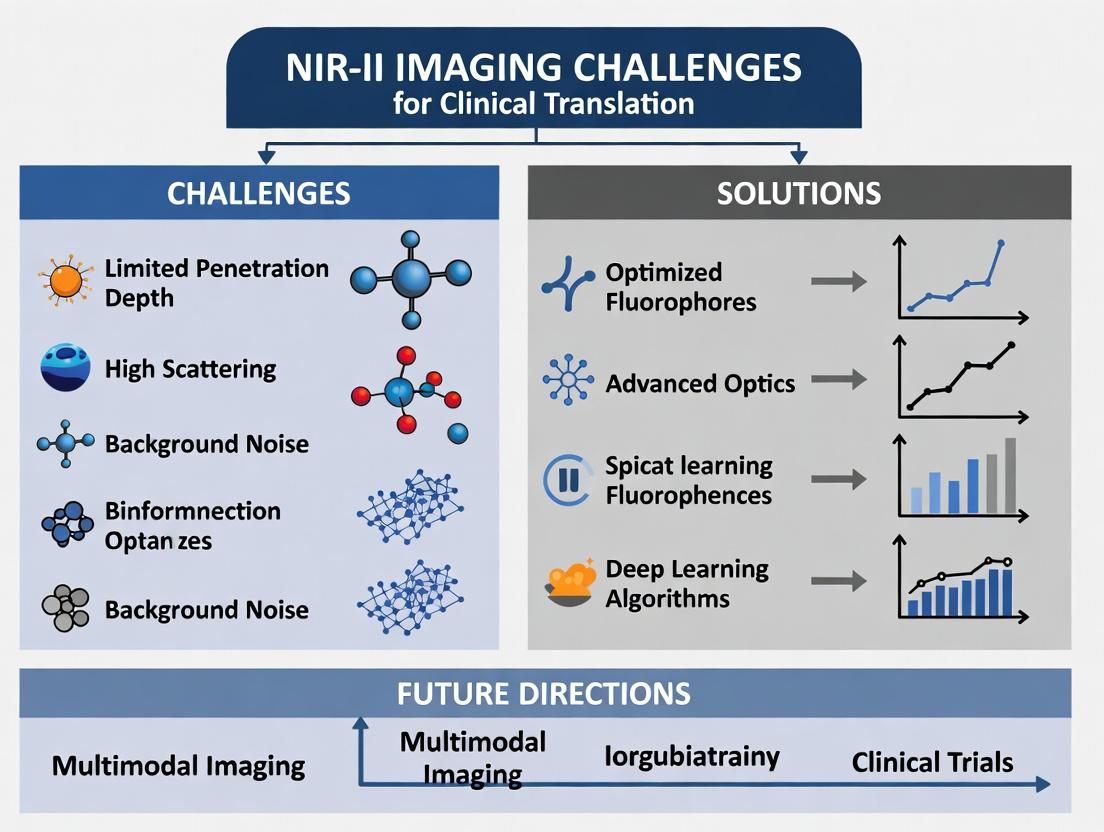
Diagram 2: Key Challenges in NIR-II Clinical Translation
The Scientist's Toolkit: Essential Research Reagents & Materials
Table 3: Key Reagent Solutions for NIR-II Imaging Experiments
| Item | Function & Role in NIR-II Imaging | Example Product/Note |
|---|---|---|
| NIR-II Fluorescent Probe | Provides contrast by emitting light in the 1000-1700 nm window upon excitation. | CH1055-PEG, IR-1061, PbS Quantum Dots. Selection depends on target, brightness, and clearance needed. |
| Targeting Ligand | Directs the probe to specific molecular targets (e.g., EGFR, PSMA) for active imaging. | Antibodies, peptides, aptamers. Must be conjugated to probe without quenching fluorescence. |
| Animal Model | Provides a biologically relevant system for testing imaging and therapy. | Immunocompetent or nude mice with subcutaneous/orthotopic tumors. Must express target of interest. |
| Low-Fluorescence Diet | Reduces chlorophyll-derived autofluorescence in the NIR region, improving signal-to-background. | AIN-93G-based purified diet. Feed animals for >48 hrs prior to imaging. |
| Anesthetic System | Ensures animal immobility and physiological stability during longitudinal imaging. | Isoflurane vaporizer with nose cone. Preferred over injectables for control of depth. |
| Laser Source | Excites the NIR-II probe. Wavelength must match probe absorption peak. | 808 nm or 980 nm diode lasers are common. Must have stable power output and appropriate safety housing. |
| InGaAs Camera | Detects NIR-II photons. Cooling is critical to reduce thermal noise. | Cameras with 320x256 or 640x512 pixel arrays, cooled to -80°C or below. |
| Image Analysis Software | Enables quantification of fluorescence intensity, ROI analysis, and 3D reconstruction. | Commercial (IVIS SpectrumCT, Bruker) or open-source (ImageJ, FIJI) with NIR-II plugin capabilities. |
This technical support center addresses common experimental challenges encountered in the development and application of NIR-II (1000-1700 nm) imaging agents and systems, a field poised at the critical juncture between preclinical validation and first-in-human trials. The following guides and FAQs are framed within the core thesis that overcoming technical reproducibility and biological specificity hurdles is paramount for successful clinical translation.
Frequently Asked Questions & Troubleshooting
Q1: Our newly synthesized NIR-II dye exhibits excellent fluorescence in buffer but severe quenching and non-specific binding in serum. What are the primary causes and solutions?
A: This is a classic formulation challenge. Quenching in serum is often due to protein adsorption causing aggregation-caused quenching (ACQ). Non-specific binding stems from insufficient surface passivation.
- Troubleshooting Steps:
- Characterize Aggregation: Run size-exclusion chromatography (SEC) or dynamic light scattering (DLS) in PBS vs. 50% serum. A significant hydrodynamic size increase confirms aggregation.
- Modify Surface Chemistry: If using an inorganic nanoparticle (e.g., Ag2S, carbon nanotube), increase PEG density. Use heterobifunctional PEG (e.g., DSPE-PEG-COOH) and confirm grafting density via NMR or a colorimetric assay.
- For Organic Dyes: Consider embedding the dye in a protective matrix like a polymer (PLGA) or albumin to shield it from the serum environment.
- Protocol: DLS Measurement in Biological Media:
- Dilute your NIR-II probe in 1x PBS to a concentration of 0.1 mg/mL.
- Create a 50% (v/v) mixture of fetal bovine serum (FBS) and the probe solution from step 1.
- Incubate at 37°C for 30 minutes.
- Transfer to a low-volume quartz cuvette. Measure the hydrodynamic diameter via DLS at 25°C, performing at least 12 runs per sample.
- Compare the Z-average diameter and polydispersity index (PdI) between the PBS and FBS samples. A shift >20 nm and/or PdI >0.3 indicates problematic aggregation.
Q2: During in vivo NIR-II imaging, we observe high background signal in the liver and spleen, obscuring signal from our target tumor. Is this a pharmacokinetics or targeting issue?
A: This is typically a pharmacokinetic issue related to the innate immune clearance of nanoparticles, known as the mononuclear phagocyte system (MPS) uptake. High liver/spleen background is a major barrier to imaging deeper lesions or metastases in these areas.
- Solutions:
- "Don't Eat Me" Signaling: Co-administer a CD47 mimetic peptide or engineer the nanoparticle surface with "self" peptides (e.g., CD47-derived) to suppress macrophage phagocytosis.
- PEG Optimization: Re-evaluate PEG chain length (switch from PEG2k to PEG5k) and conformation (brush vs. mushroom). Use a cleavable PEG linkage that sheds upon reaching the slightly acidic tumor microenvironment to reveal the targeting ligand.
- Cell Membrane Coating: Camouflage nanoparticles with red blood cell or leukocyte membranes to evade immune recognition, drastically reducing liver sequestration.
Q3: Our targeted NIR-II probe shows good tumor accumulation in murine models, but the signal-to-background ratio (SBR) peaks at 4 hours and rapidly declines, making the imaging window impractical for clinical use. How can we improve pharmacokinetics?
A: A short imaging window suggests rapid clearance or unstable dye integrity. The goal is to balance circulation time with eventual clearance to minimize long-term toxicity.
- Troubleshooting Table:
| Potential Cause | Diagnostic Experiment | Possible Solution |
|---|---|---|
| Rapid Renal Clearance (Small molecules/dots <6 nm) | Collect urine at 1h & 4h p.i.; measure fluorescence. | Increase molecular weight via polymerization or protein conjugation. |
| Unstable Dye Integrity | Image the same animal at 4h and 24h. If signal dissipates uniformly, it's clearance. If it fragments, it's instability. | Improve chemical stability of the dye core (e.g., use more robust cyanine or chalcogenide structures). |
| Fast Off-Target Clearance | Conduct biodistribution study at peak (4h) and late (24h) time points. Quantify %ID/g in organs. | Implement the surface modification strategies from Q2 to reduce MPS uptake. |
Experimental Protocol: Standardized In Vivo NIR-II Imaging for Pharmacokinetics
Title: Quantitative Biodistribution and Pharmacokinetics of a NIR-II Imaging Probe.
Objective: To quantitatively evaluate the blood circulation half-life, tumor accumulation, and biodistribution profile of a novel NIR-II probe.
Materials:
- Nude mice bearing subcutaneous xenograft tumors (~150 mm³).
- NIR-II probe (100 µL, 1 mg/mL in saline).
- NIR-II imaging system (e.g., InGaAs camera with 1064 nm excitation).
- Isoflurane anesthesia setup.
- Calibrated digital scale, dissection tools.
- EDTA-coated microtainers for blood collection.
Methodology:
- Pre-imaging: Anesthetize mouse and place on heated stage. Acquire a baseline pre-injection image (100 ms exposure, appropriate laser power).
- Injection & Imaging: Administer probe via tail vein. Acquire sequential images at 1, 5, 15, 30 min, then 1, 2, 4, 8, 12, and 24 hours post-injection (p.i.). Maintain consistent imaging parameters.
- Blood Circulation: Collect ~20 µL blood from the retro-orbital plexus at each time point (up to 1h). Measure fluorescence intensity of diluted plasma against a standard curve.
- Biodistribution: At terminal time points (e.g., 4h and 24h), euthanize mice (n=3/group). Harvest tumors and major organs (heart, liver, spleen, lung, kidneys). Rinse in PBS, weigh, and image ex vivo.
- Data Analysis: Draw regions of interest (ROIs) over tumors and background tissue. Calculate SBR as (Mean Tumor Intensity) / (Mean Background Intensity). Calculate % injected dose per gram (%ID/g) for organs using the standard curve.
Visualizations
Title: NIR-II Probe Translation Path & Key Hurdle
Title: NIR-II Probe Development & Troubleshooting Workflow
The Scientist's Toolkit: Key Research Reagent Solutions
| Reagent/Material | Function in NIR-II Research | Key Consideration for Translation |
|---|---|---|
| Heterobifunctional PEG (e.g., SH-PEG-COOH, NHS-PEG-Mal) | Creates a hydrophilic, biocompatible shell on nanoparticles; provides chemical handles for conjugating targeting ligands (antibodies, peptides). | PEG chain length (2k vs. 5k Da) and density critically impact circulation half-life and immune evasion. |
| CD47 Mimetic Peptide | Binds to SIRPα on macrophages, delivering a "don't eat me" signal to reduce phagocytic clearance of intravenously injected probes. | Optimal dosing and co-injection strategy must be determined to avoid systemic immunomodulatory effects. |
| Matrix-Embedding Polymers (PLGA, PLA) | Biodegradable, FDA-approved polymers that encapsulate organic NIR-II dyes, protecting them from quenching and allowing controlled release. | The degradation rate must match the intended diagnostic window; byproducts must be non-toxic. |
| IRDye 12-4C (Commercial Standard) | A well-characterized, small molecule NIR-II dye used as a reference standard for comparing quantum yield, brightness, and performance in vivo. | Essential for benchmarking new agents but may be subject to licensing for commercial development. |
| Tumor-Targeting Ligands (e.g., cRGD, Anti-EGFR scFv, Folic Acid) | Directs the NIR-II probe to specific molecular markers overexpressed on target cells (e.g., cancer, inflamed endothelium). | Affinity, specificity, and ligand density must be optimized to avoid the "binding site barrier" effect. |
Technical Support Center
Troubleshooting Guide: NIR-II Imaging for Clinical Translation
Issue 1: Poor Signal-to-Noise Ratio (SNR) in Deep Tissue
- Q: Why is my NIR-II fluorescence signal weak and noisy when imaging through >5 mm of tissue, despite using a high-power laser?
- A: This is often due to a combination of photon scattering, autofluorescence from the tissue, and suboptimal probe performance. Ensure you are using a probe with a high quantum yield specifically engineered for the NIR-IIb window (1500-1700 nm). Check your optical setup: use long-pass filters with a sharp cut-on edge (>1500 nm) to block shorter-wavelength noise and ensure your detector (e.g., InGaAs camera) is cooled to reduce dark current.
Issue 2: Inconsistent Probe Bioconjugation & Targeting
- Q: My targeted NIR-II probe shows high non-specific background and inconsistent tumor uptake between animal models. What could be wrong?
- A: This points to conjugation instability or linker cleavage. First, verify the probe-to-antibody/ligand ratio (DAR) using mass spectrometry or UV-Vis-NIR absorption. A high DAR can cause aggregation and non-specific uptake. Use a stable, minimally immunogenic linker (e.g., a maleimide-thiol bond for cysteine residues). Always include a non-targeted control probe (same fluorophore, isotype antibody) to differentiate specific vs. passive accumulation.
Issue 3: Quantification Inaccuracy During Longitudinal Studies
- Q: My quantified fluorescence intensity from the same lesion decreases over time, but histology shows the tumor is growing. What is the cause?
- A: This is likely due to a change in the tissue optical environment (e.g., increased necrosis, hemorrhage, or fibrosis) altering light attenuation, not just probe concentration. Implement a ratiometric imaging approach using a reference channel or a probe with a built-in internal standard. Calibrate your system frequently with phantom standards of known fluorophore concentration in intralipid solution to maintain quantification accuracy.
Issue 4: Rapid Signal Photobleaching During Surgery
- Q: The NIR-II signal bleaches quickly during real-time image-guided surgery, hindering procedure guidance.
- A: This indicates insufficient photostability of the organic dye or nanoparticle. For dyes, consider incorporating protective groups or using rigid structures (e.g., heptamethine cyanines with cyclized chains). For inorganic probes (e.g., rare-earth-doped nanoparticles), ensure they have an inert, protective coating. Also, optimize imaging parameters: reduce laser power and increase camera integration time to find the balance between brightness and photostability.
Frequently Asked Questions (FAQs)
Q1: What are the most critical specifications for an InGaAs camera for preclinical NIR-II imaging? A: Key specifications are: 1) Spectral Range: Ensure it covers at least 900-1700 nm. Cameras with extended InGaAs to 2200 nm are better for the NIR-IIb window. 2) Cooling: Thermoelectric cooling to -80°C or lower is essential to minimize dark noise for long exposures. 3) Quantum Efficiency: >80% in the 1000-1400 nm range is desirable. 4) Pixel Size & Resolution: A balance between field of view and sensitivity; larger pixels (e.g., 20 µm) often have better light gathering.
Q2: How do I choose between organic dyes and inorganic nanoparticles for my application? A: The choice involves trade-offs:
- Organic Dyes (e.g., CH-4T, IR-1061): Faster renal clearance, easier bioconjugation, but generally lower brightness and photostability. Best for rapid imaging and pharmacokinetic studies where clearance is a priority.
- Inorganic Nanoparticles (e.g., Ag2S, Rare-Earth-Doped): Much higher brightness and photostability, but larger size leads to longer circulation and potential hepatic accumulation. Ideal for long-term tracking, deep-tissue angiography, or when extreme SNR is required.
Q3: What are the primary regulatory hurdles for translating an NIR-II imaging agent to first-in-human trials? A: Major hurdles include: 1) Comprehensive Toxicity Profile: Beyond standard acute toxicity, require long-term biodistribution and degradation/clearance pathways of all components. 2) GMP-compliant Manufacturing: Reproducible, scalable synthesis with stringent quality control for batch-to-batch consistency of optical properties. 3) Clinical Device Compatibility: The probe must be compatible with clinical imaging systems, requiring co-development of approved illumination and detection devices.
Summarized Quantitative Data
Table 1: Comparison of Common NIR-II Fluorophores
| Fluorophore Type | Example | Emission Peak (nm) | Quantum Yield (%) | Hydrodynamic Size (nm) | Primary Clearance Route |
|---|---|---|---|---|---|
| Organic Dye | CH-4T | ~1050 | 0.3-0.5 | <5 | Renal |
| Organic Dye | IR-FE | ~1550 | 0.2 | <5 | Renal/Hepatic |
| Semiconductor NP | Ag2S | 1050-1300 | 5-15 | 10-30 | Renal/Hepatic |
| Rare-Earth NP | NaYF4:Yb,Er@CaF2 | ~1550 | 5-20 | 20-50 | Hepatic (RES) |
| Single-Walled Carbon Nanotube | (6,5)-SWCNT | ~990 | 1-3 | 100-500 (length) | Hepatic (RES) |
Table 2: Tissue Penetration Depth vs. Wavelength
| Wavelength Window | Biological Window Name | Approx. Max. Penetration Depth in Brain Tissue* | Key Attenuation Factor |
|---|---|---|---|
| 650-950 nm | NIR-I | 2-3 mm | Hemoglobin, Water, Lipids, Scattering |
| 1000-1350 nm | NIR-IIa | 5-8 mm | Scattering, Water (rising) |
| 1500-1700 nm | NIR-IIb | >10 mm | Scattering (minimized), Water (peak) |
*Depth where detected signal drops to 10% of surface signal; varies by tissue type.
Experimental Protocols
Protocol 1: In Vivo NIR-II Imaging for Tumor Targeting Validation Objective: To quantitatively assess the biodistribution and targeting efficiency of a novel NIR-II probe. Materials: NIR-II probe, control probe, tumor-bearing mouse model, NIR-II imaging system (laser, filters, InGaAs camera), anesthesia setup, heating pad. Method:
- Preparation: Anesthetize mouse with isoflurane (2% induction, 1-1.5% maintenance). Place on heated stage in imaging chamber.
- Baseline Scan: Acquire a pre-injection image set (autofluorescence background).
- Probe Administration: Intravenously inject 100-200 µL of probe solution (100 µM in PBS) via tail vein.
- Time-Course Imaging: Acquire images at defined time points (e.g., 1 min, 5 min, 30 min, 1h, 2h, 4h, 24h). Maintain consistent laser power, filter settings, and camera exposure time.
- Image Analysis: Use ROI tools to quantify signal intensity in tumor and key organs (liver, kidney, muscle). Subtract background. Calculate Tumor-to-Background Ratio (TBR) = (Mean IntensityTumor) / (Mean IntensityMuscle).
- Ex Vivo Validation: Euthanize animal at terminal time point. Image and weigh excised organs for biodistribution quantification.
Protocol 2: Measuring Quantum Yield of NIR-II Probes Objective: To determine the fluorescence quantum yield (QY) of a novel NIR-II fluorophore relative to a standard. Materials: Fluorophore sample, reference standard (e.g., IR-26 in DCE, QY = 0.05%), spectrophotometer, NIR spectrometer with integrating sphere, matched solvents. Method:
- Absorbance Measurement: Prepare dilute solutions of sample and reference with absorbance < 0.1 at the excitation wavelength (e.g., 808 nm). Measure exact absorbance (A) using a UV-Vis-NIR spectrophotometer.
- Integrating Sphere Setup: Place a cuvette with pure solvent in the integrating sphere attached to the NIR spectrometer. Excite with the laser and record the emission spectrum. This is the blank.
- Sample Measurement: Replace solvent with the sample solution. Record the emission spectrum under identical conditions.
- Reference Measurement: Replace with the reference solution of known QY. Record its emission spectrum.
- Calculation: Calculate QY using the formula: QYsample = QYref * (Gradsample / Gradref) * (ηsample^2 / ηref^2), where Grad is the integrated emission intensity vs. absorbance plot, and η is the refractive index of the solvent.
Visualizations
Diagram 1: NIR-II Probe Development Workflow
Diagram 2: Light-Tissue Interaction & Attenuation
The Scientist's Toolkit: Research Reagent Solutions
Table 3: Essential Reagents for NIR-II Imaging Research
| Item | Function & Rationale | Example/Note |
|---|---|---|
| NIR-II Fluorophore Library | Provides a range of emission wavelengths and brightness for method development and multiplexing. | Include dyes from NIR-IIa (1000-1350 nm) and NIR-IIb (1500-1700 nm) windows. |
| PEGylation Reagents (e.g., mPEG-NHS) | Conjugates polyethylene glycol to probes to increase hydrophilicity, circulation time, and reduce immune clearance. | Crucial for tuning pharmacokinetics of nanoparticles and hydrophobic dyes. |
| Heterobifunctional Linkers (e.g., DBCO-NHS, Maleimide-PEG-NHS) | Enables controlled, site-specific bioconjugation of targeting ligands (antibodies, peptides) to fluorophores. | DBCO reacts with azides via strain-promoted click chemistry; Maleimide reacts with thiols. |
| Intralipid 20% Pharmaceutical Fat Emulsion | Used to create tissue-mimicking phantoms for system calibration and quantifying light attenuation. | Scattering properties mimic biological tissue; allows SNR and penetration depth testing in vitro. |
| Matrigel or Other ECM Mimics | Used for 3D cell culture and creating more realistic in vitro models to test probe penetration and binding before animal studies. | Provides a physical diffusion barrier similar to tumor stroma. |
| Reference Standard Dyes (e.g., IR-26) | Essential for quantifying and reporting the Quantum Yield (QY) of new fluorophores, enabling direct comparison between labs. | IR-26 in dichloroethane has a defined QY of 0.05% at 1064 nm excitation. |
Building Clinical-Grade NIR-II Systems: From Probe Design to Protocol Standardization
Technical Support Center
Troubleshooting Guide & FAQs
Q1: During in vivo imaging with organic NIR-II dyes (e.g., CH1055 derivatives), we observe a rapid signal decay within the first hour. What are the potential causes and solutions?
A: Rapid signal decay is often linked to dye aggregation, protein adsorption, or insufficient chemical stability.
- Cause: Aggregation-caused quenching (ACQ) in aqueous biological media.
- Solution: Implement pegylation protocols. Dissolve 5 mg of dye in 1 mL of anhydrous DMF. Add a 10-fold molar excess of mPEG-NHS (5 kDa) and 10 µL of triethylamine. React under argon at room temperature for 6 hours. Purify via size-exclusion chromatography (Sephadex LH-20, methanol as eluent). Analyze pegylation success with MALDI-TOF.
- Protocol: Pegylation of NIR-II Dyes for Improved Solubility.
- Prepare dye solution in anhydrous DMF under inert atmosphere.
- Add mPEG-NHS (5-10 kDa) at 10:1 molar ratio (PEG:dye).
- Add catalytic triethylamine (1% v/v).
- React for 6-12 hours at 25°C with stirring.
- Terminate reaction by adding 100 µL of 1M glycine buffer (pH 8.0).
- Purify via prep-HPLC or size-exclusion chromatography.
- Lyophilize and store at -20°C.
Q2: Our quantum dot (QD) NIR-II probes (e.g., Ag2S, PbS/CdS) show excellent brightness but significant hepatotoxicity in murine models. How can we improve biocompatibility?
A: Hepatotoxicity commonly stems from cadmium leakage, unstable shelling, or RES clearance leading to liver accumulation.
- Cause: Degradation of the inorganic shell in the acidic lysosomal environment post-phagocytosis.
- Solution: Apply an additional silica or lipid-polymer hybrid coating. For silica coating: suspend purified QDs in 10 mL of isopropanol. Add 200 µL of ammonia (28%) and 50 µL of tetraethyl orthosilicate (TEOS). Sonicate for 30 minutes, then stir for 24 hours. Centrifuge at 15,000g for 20 min to collect silica-coated QDs.
- Critical Parameter: Ensure core-shell lattice mismatch is <3% to prevent defect-induced degradation. Monitor cytotoxicity with an LDH assay (ISO 10993-5).
Q3: Single-walled carbon nanotube (SWCNT) probes exhibit batch-to-batch variability in chirality and NIR-II emission wavelength. How can we standardize preparations for consistent imaging data?
A: Variability originates from raw material sources and dispersion/functionalization efficiency.
- Solution: Implement density gradient ultracentrifugation (DGU) for chirality sorting.
- Protocol: DGU for SWCNT Chirality Separation.
- Disperse 2 mg of raw SWCNTs in 10 mL of 2% w/v sodium cholate in PBS using tip sonication (500 J/mL energy input).
- Prepare a iodixanol gradient in ultracentrifuge tubes: 40%, 35%, 30%, 25% (w/v) layers in PBS.
- Layer the SWCNT dispersion on top.
- Ultracentrifuge at 250,000g for 12 hours at 15°C.
- Fractionate layers and characterize each fraction via absorbance (UV-Vis-NIR) and photoluminescence excitation (PLE) mapping.
- Select fractions with (n,m) indices corresponding to desired emission (e.g., (9,4) for ~1100 nm).
- Standardization: Use PLE map peak intensity ratios as a quality control metric. Require a coefficient of variation <15% between batches.
Q4: What are the key parameters to validate for any NIR-II probe before moving to a longitudinal in vivo tumor imaging study?
A: A pre-clinical validation checklist is mandatory.
| Validation Parameter | Target Metric | Test Method |
|---|---|---|
| Quantum Yield (QY) | >1% for dyes, >5% for QDs in serum | Integrating sphere with IR26 reference (1% in DCE) |
| Brightness (ϵ × QY) | >10⁴ M⁻¹cm⁻¹ for dyes | Absorbance & QY measurement |
| Hydrodynamic Diameter | <10 nm for renal clearance, <100 nm for EPR | Dynamic Light Scattering (DLS) |
| Serum Stability | <10% fluorescence loss after 24h @37°C | Incubation in 50% FBS, periodic measurement |
| Non-specific Binding | <5% of injected dose per gram in muscle | Ex vivo biodistribution at 24h post-injection |
| Acute Toxicity (LD50) | >100 mg/kg (IV, mouse) | OECD Guideline 423 |
Research Reagent Solutions Toolkit
| Item | Function | Example Product/Catalog # |
|---|---|---|
| NIR-II Organic Dye (CH-1055-PEG) | Small molecule imaging agent; high renal clearance. | Lumiprobe #Dye-NIR2-1 |
| Ag2S Quantum Dots (PL ~1200 nm) | Inorganic probe; high brightness and photostability. | Nanocs #AQD-1200 |
| Functionalized (COOH) SWCNTs | Nanotube scaffold for drug delivery & deep-tissue imaging. | Sigma-Aldrich #773735 |
| Density Gradient Medium (Iodixanol) | For chirality sorting of SWCNTs via ultracentrifugation. | Sigma-Aldrich #D1556 |
| mPEG-NHS (5 kDa) | For pegylation to improve solubility and circulation half-life. | JenKem Technology #A2001 |
| NIR-II Reference Dye (IR-26) | Standard for quantum yield measurements in NIR-II. | Sigma-Aldrich #01679 |
| Matrigel Matrix | For simulating tumor microenvironment in in vitro assays. | Corning #356231 |
| IVIS Spectrum CT (or equivalent) | In vivo imaging system with NIR-II detection capability. | PerkinElmer #CLS136336 |
Experimental Protocol: Conjugating a Targeting Ligand to NIR-II Probes
Title: Antibody Conjugation to NIR-II QDs for Targeted Imaging
Materials: Ag2S QDs-COOH, Anti-EGFR Antibody, EDC, Sulfo-NHS, PBS (pH 7.4), Zeba Spin Desalting Column (7K MWCO).
Method:
- Activation: In 200 µL PBS, mix 1 nmol of QDs-COOH with 100-fold molar excess of EDC and 200-fold excess of Sulfo-NHS. React for 15 minutes at 25°C.
- Purification: Pass the mixture through a Zeba column pre-equilibrated with PBS to remove excess crosslinkers.
- Conjugation: Immediately add 3-5 equivalents of anti-EGFR antibody to the activated QDs. React for 2 hours at 4°C on a rotator.
- Quenching & Final Purification: Add 10 µL of 1M glycine to quench unreacted sites. Incubate for 15 minutes. Purify conjugate via size-exclusion chromatography (Sephacryl S-300 HR) using PBS as eluent. Collect the first fluorescent fraction.
- Validation: Characterize using SDS-PAGE (Coomassie and NIR-II fluorescence scan) and dynamic light scattering to confirm conjugation and monodispersity.
Workflow & Relationship Diagrams
Title: NIR-II Probe Development and Validation Workflow
Title: Clinical Translation Challenges and Technical Solutions
Title: Cellular Uptake and Fate of Targeted NIR-II Probes
Technical Support Center
FAQs & Troubleshooting Guide
Q1: During NIR-II dye-antibody conjugation, my fluorescent signal is quenched post-purification. What went wrong? A: This is a common issue in NIR-II probe synthesis. Potential causes and solutions are detailed below.
| Potential Cause | Diagnostic Test | Solution |
|---|---|---|
| Aggregation-Caused Quenching (ACQ) | Measure absorbance spectrum. New, broad peaks at longer wavelengths indicate H-aggregates. | 1. Introduce bulky PEG spacers (e.g., MW 2000-5000) between dye and antibody. 2. Reduce dye-to-antibody ratio (DAR) to <4. 3. Use a dye with twisted molecular structure to resist stacking. |
| Dye-Protein Interaction | Perform SDS-PAGE with in-gel fluorescence imaging. If signal is in lane, interaction remains. | Optimize conjugation site. Use site-specific conjugation kits (e.g., thiol-maleimide, click chemistry) to direct dye away from hydrophobic pockets. |
| Incomplete Purification | Measure absorbance at 280 nm and dye's λmax. Calculate DAR; if inconsistent, free dye remains. | Use a size-exclusion chromatography (SEC) column with a smaller pore size (e.g., <10 kDa cutoff) to rigorously remove unreacted dye. |
Experimental Protocol: Site-Specific Antibody Conjugation with a NIR-II Dye Objective: Conjugate a maleimide-functionalized NIR-II dye (e.g., CH-1055 derivative) to a reduced interchain disulfide of an IgG antibody.
- Antibody Reduction: Dilute IgG to 1 mg/mL in PBS (pH 7.4). Add 100-fold molar excess of TCEP (tris(2-carboxyethyl)phosphine). Incubate at 37°C for 30 min.
- Purification: Desalt the reduced antibody using a Zeba Spin Desalting Column (7K MWCO) pre-equilibrated with PBS (pH 7.0, EDTA-free). Collect the eluent.
- Conjugation: Immediately add a 3-fold molar excess of maleimide-NIR-II dye in DMSO (final DMSO <5%). React in the dark at 4°C for 2 hours.
- Quenching & Final Purification: Quench the reaction with 100-fold molar excess of L-cysteine for 15 min. Purify the conjugate using SEC (e.g., PD-10 column) in PBS. Filter sterilize (0.22 µm), aliquot, and store at 4°C in the dark.
Q2: My NIR-II small-molecule probe shows excellent in vitro binding but high non-specific liver/spleen uptake in vivo. How can I improve target-to-background ratio? A: High reticuloendothelial system (RES) uptake often stems from poor hydrophilicity and opsonization.
| Parameter to Optimize | Target Range | Effect on Pharmacokinetics |
|---|---|---|
| Hydrophilicity-Lipophilicity Balance (LogD at pH 7.4) | -2 to 0 | Reduces plasma protein binding and minimizes RES sequestration. |
| Overall Molecular Charge | Slight negative (~ -5 mV) | Repels negatively charged cell membranes, reducing non-specific adhesion. |
| PEGylation (PEG Chain Length) | 2 - 5 kDa | Creates a hydration shell, sterically shielding from opsonins, prolonging circulation. |
Experimental Protocol: Modulating Probe Hydrophilicity via PEG Linker Insertion Objective: Synthesize a peptide-targeted NIR-II probe with a tunable PEG spacer.
- Solid-Phase Peptide Synthesis (SPPS): Synthesize your targeting peptide (e.g., cRGD) on Rink Amide resin.
- PEG Coupling: On-resin, couple Fmoc-NH-PEGn-COOH (n=4, 8, 24) using HBTU/DIPEA activation for 2 hours. Follow with Fmoc depiperidination.
- Dye Conjugation: Couple a NIR-II dye (e.g., IR-12N3) bearing an azide group via copper-free click chemistry by reacting with DBCO-OSu on the peptide N-terminus.
- Cleavage & Purification: Cleave from resin with TFA cocktail, precipitate in cold ether, and purify via reversed-phase HPLC. Lyophilize and characterize by MS and absorbance.
Q3: The conjugation yield for my nanoparticle (e.g., quantum dot, polymer dot) targeting ligand is low. How can I optimize it? A: Low yield is often due to inaccessible or insufficient reactive groups on the nanoparticle surface.
| Strategy | Mechanism | Recommended Protocol Adjustment |
|---|---|---|
| Pre-Activation | Activates nanoparticles prior to ligand addition for efficient coupling. | Use sulfo-NHS/EDC to pre-activate carboxylated QDs for 10 min at RT before adding amine-functionalized ligand. |
| Mixed PEG Passivation | Co-conjugation of heterobifunctional PEG reduces crowding. | Use a mixture of NHS-PEG-Maleimide (for ligand) and NHS-PEG-OCH3 (for passivation) at a 1:20 molar ratio during surface coating. |
| Click Chemistry | High specificity and yield under mild conditions. | Incorporate DBCO groups onto nanoparticle surface. React with azide-modified targeting ligand (1.5x molar excess) at 25°C for 6 hrs. |
The Scientist's Toolkit: Research Reagent Solutions for NIR-II Probe Conjugation
| Item | Function & Rationale |
|---|---|
| Heterobifunctional PEG Linkers (e.g., NHS-PEG-Maleimide) | Spacer that reduces quenching and provides specific, controlled conjugation chemistry. |
| Site-Specific Conjugation Kits (e.g., Thiol/Maleimide, Enzymatic) | Ensures uniform DAR and preserves biologic activity of antibodies/proteins. |
| Desalting Spin Columns (Zeba, 7K-40K MWCO) | Rapid buffer exchange to remove reducing agents or free dye, critical for conjugation efficiency. |
| Size-Exclusion Chromatography (SEC) Columns (e.g., Sephadex G-25, FPLC Superdex) | Essential for purifying conjugates from unreacted components based on hydrodynamic size. |
| Copper-Free Click Chemistry Reagents (e.g., DBCO, Tetrazine) | Enables bioorthogonal, fast, and high-yielding conjugation for sensitive biomolecules or in vivo pre-targeting. |
| Absorbance & Fluorescence Quantum Yield Standards | Accurate quantification of dye concentration and brightness, which is critical for probe standardization. |
Visualization: NIR-II Probe Conjugation Strategy Decision Pathway
Title: Probe Conjugation Strategy Decision Tree
Visualization: Key Factors Affecting In Vivo Performance of NIR-II Conjugates
Title: Conjugate Properties Dictate In Vivo Fate
Troubleshooting & FAQs
Q1: Our portable NIR-II camera exhibits significantly higher dark noise than the specification sheet claims, especially when operating in a warm clinical environment. What could be the cause and how can we mitigate it? A: Elevated dark noise in InGaAs or new quantum dot/semiconductor-based sensors is highly temperature-dependent. For every 5-8°C increase in sensor temperature, dark current can approximately double. First, verify active cooling (e.g., thermoelectric cooler, TEC) is engaged and functioning. Ensure the camera housing has adequate passive heat sinks and consider using a small, low-noise fan for ambient airflow. For experiments, if possible, acclimate the camera in the clinical environment for 30 minutes before use and perform a fresh dark frame acquisition at the operating temperature to subtract from subsequent images.
Q2: During in vivo imaging of dye clearance in mice, the image contrast degrades over time. We suspect laser drift. How can we diagnose and correct this issue? A: Laser output power and wavelength stability are critical for quantitative longitudinal studies. First, diagnose using a power meter at the sample plane to check for intensity drop. Wavelength drift can be checked with a portable spectrometer. To correct:
- Implement a reference channel: Use a fiber splitter to direct a small percentage (<5%) of the laser to a calibrated photodiode or a reference material (e.g., a stable NIR-II reflecting tile) within the camera's field of view for real-time intensity normalization.
- Laser driver stability: Ensure the laser driver is not overheating and is powered by a stable, low-noise source.
- Protocol step: Always allow the laser to warm up for 15-20 minutes before beginning experiments.
Q3: We are trying to image a targeted NIR-II probe in a human tissue phantom, but the background autofluorescence/scatter is overwhelming the signal. What optimization steps can we take? A: High background is a common challenge in transitioning from clear mouse imaging to turbid human tissue phantoms or clinical samples.
- Spectral filtering: Use long-pass filters with a steeper cutoff (OD >6) closer to your probe's emission peak to block shorter-wavelength scatter and autofluorescence.
- Excitation modulation: Employ a pulsed laser and time-gated detection. Most tissue autofluorescence has a short lifetime (<10 ns), while many NIR-II probes (e.g., rare-earth doped nanoparticles) have longer lifetimes. Gating detection after the initial pulse can dramatically improve SNR.
- Increase imaging depth: For deeper targets, shift to longer wavelengths within the NIR-II window (e.g., 1500-1700 nm) where tissue scattering is reduced. This may require changing your detector (e.g., to an extended InGaAs array).
Q4: The spatial resolution of our low-cost, lens-based system is worse than expected based on the sensor pixel size. What are the main optical culprits and solutions? A: In NIR-II, optical aberrations and diffraction effects are different from visible light.
- Chromatic aberration: Standard visible-light corrected lenses perform poorly in NIR-II. Use NIR-II achromatic doublets or reflective objectives (mirror-based) which are aberration-free across a wide wavelength range.
- Diffraction limit: Resolution is fundamentally limited by (\lambda)/NA. To approach pixel-limited resolution:
- Use lenses with the highest possible Numerical Aperture (NA) for your working distance.
- Ensure precise focus; NIR-II focal plane is often offset from the visible. Use an iris or a co-aligned visible guide laser for focusing.
- Vignetting: This reduces effective NA at the sensor edges. Use apertures stop down or lenses designed for the sensor's full array.
Q5: How do we calibrate our system for quantitative radiometric measurement of fluorophore concentration in tissue? A: Absolute quantification is essential for clinical translation. Follow this protocol:
- Create a calibration phantom: Use a tissue-mimicking phantom (e.g., Intralipid solution, epoxy resins with scatterers) embedded with capillary tubes containing serial dilutions of your NIR-II fluorophore.
- Image the phantom: Under identical settings (laser power, integration time, filter, f-stop) as your live experiment.
- Generate a calibration curve: Plot known fluorophore concentration against measured camera counts (in Region of Interest, ROI). Correct for background (phantom alone).
- Account for tissue effects: For a specific tissue type (e.g., human skin), use a lookup table or algorithm based on Monte Carlo simulations of light transport to convert surface signal to subsurface concentration. This step requires knowing tissue optical properties (µa, µs').
Research Reagent & Materials Toolkit
| Item | Function in NIR-II Imaging |
|---|---|
| NIR-II Fluorophores (e.g., IRDye 800CW, CH-4T, Ag2S QDs, Rare-earth nanoparticles) | Molecular agents that emit light in the 1000-1700 nm window for labeling and contrast. |
| Tissue-Mimicking Phantoms (e.g., Intralipid 20%, TiO2 or Al2O3 powder in PDMS) | Calibration standards that simulate tissue scattering (µs') and absorption (µa) properties. |
| NIR-II Calibration Targets (e.g., Certified diffuse reflectors, Spectralon) | Provides stable, known reflectance for flat-field correction and system response calibration. |
| Long-pass & Band-pass Filters (e.g., 1000 nm LP, 1100/40 nm BP, OD>6) | Isolates NIR-II emission from excitation light and shorter wavelength noise. |
| NIR-II Achromatic Lenses / Objectives | Corrects for chromatic aberration specific to the NIR-II wavelength range, improving resolution. |
| InGaAs Camera (Standard or Extended Range) | The core sensor for detecting NIR-II photons; cooled models reduce dark noise. |
| Stable NIR-II Laser Sources (e.g., 808 nm, 980 nm, 1064 nm diodes) | Provides excitation light; wavelength stability and low noise are critical. |
| Time-Gated Electronics (Pulse generator, Delay generator) | Enables time-gated detection to separate long-lifetime probe signal from short-lifetime background. |
Experimental Protocol: System Sensitivity & Resolution Characterization
Objective: To quantitatively measure the sensitivity (Minimum Detectable Fluorescence) and spatial resolution of a portable NIR-II camera system.
Materials:
- Portable NIR-II imaging system (laser, filters, camera, lens).
- NIR-II fluorophore solution (e.g., IR-26 dye in DMSO) of known concentration.
- Serial dilutions of the fluorophore in capillary tubes or well plates.
- USAF 1951 resolution test chart (reflective, NIR-compatible version).
- Calibrated power meter.
- Ruler and optical stage.
Methodology:
- Laser Power Calibration: Measure power at the sample plane with the power meter. Adjust laser current to achieve desired, stable output (e.g., 10 mW/cm²).
- Sensitivity Measurement: a. Prepare serial dilutions of the fluorophore (e.g., from 1 µM to 1 pM). b. Image each dilution in a dark environment with a fixed set of parameters (integration time, lens f/#, filter). c. For each image, subtract a dark frame (cap on lens). d. Plot measured mean signal (in camera counts) in the ROI against known fluorophore concentration. The Minimum Detectable Concentration is where the signal crosses 3× the standard deviation of the background ROI.
- Resolution Measurement: a. Uniformly illuminate the NIR-compatible USAF chart with the laser. b. Image the chart with the NIR-II camera. c. Analyze the image to identify the smallest group and element where the line patterns are clearly distinguishable (modulation > 26.5%). Convert this element number to line pairs per mm (lp/mm).
Table 1: Typical Performance Metrics for Affordable Portable NIR-II Cameras
| Parameter | Low-Cost InGaAs (Cooled) | Emerging Sensor (e.g., QD/Organic) | Benchmark: High-End Lab System |
|---|---|---|---|
| Spectral Range | 900-1700 nm | 900-1400 nm | 900-2200 nm |
| Sensor Temp. (Cooled) | -10°C to -20°C | +20°C to +40°C (uncooled) | -80°C to -120°C |
| Dark Noise (e-/pix/s) | 50-200 | 500-2000 | < 10 |
| Frame Rate (Full Frame) | 10-30 Hz | 1-10 Hz | Up to 100 Hz |
| Typical Resolution (lp/mm) | 5-10 | 2-5 | 15-30 |
| Estimated Cost (USD) | $15,000 - $40,000 | $5,000 - $15,000 | $80,000 - $200,000+ |
| Key Limitation for Clinic | Size/weight of cooler | Sensitivity/Speed | Cost, Portability |
Table 2: NIR-II Fluorophore Properties for Clinical Use
| Fluorophore Type | Peak Emission (nm) | Quantum Yield | Advantage for Portable Systems | Challenge for Translation |
|---|---|---|---|---|
| Organic Dyes | 800-1100 | 0.5-5% | Small size, renal clearance | Moderate brightness, photobleaching |
| Quantum Dots | 1000-1600 | 5-15% | Bright, tunable emission | Potential long-term toxicity |
| Single-Wall Carbon Nanotubes | 1000-1600 | 1-3% | Photostable, multiplexing | Complex functionalization |
| Rare-Earth NPs | 980, 1064, 1530 | <1% | Long lifetime for gating, sharp peaks | Lower brightness, size |
System Integration & Signal Pathway
Diagram 1: Portable NIR-II Camera Optical Path
Troubleshooting Decision Workflow
Diagram 2: NIR-II Image Quality Troubleshooting Guide
Developing Standardized Imaging Protocols for Reproducible Data Acquisition
Technical Support Center: Troubleshooting NIR-II Imaging for Clinical Translation
FAQs and Troubleshooting Guides
Q1: Our acquired NIR-II images show inconsistent signal-to-noise ratios (SNR) across repeated scans of the same sample. What are the primary variables to stabilize? A: Inconsistent SNR is often due to unstable laser excitation or inconsistent ambient light management. Standardize these key parameters:
- Laser Power & Stability: Use a calibrated power meter before each session. Fluctuations >5% require source recalibration.
- Room Illumination: Perform acquisitions in complete darkness. Near-infrared light from equipment LEDs can contaminate signals.
- Detector Cooling: Ensure the InGaAs or other NIR-II detector is cooled to its stable operational temperature (typically -80°C) and has been stabilized for the manufacturer's specified time (e.g., 30+ minutes).
Q2: We observe spatial resolution degradation and halo artifacts in deep-tissue imaging. Is this a probe issue or an instrument setup problem? A: This is frequently an instrument calibration issue, specifically with the collection optics and filters.
- Primary Check: Re-calibrate the focus for deep tissue. Use a fluorescent reference slide at a depth-mimicking phantom.
- Filter Integrity: Check the condition of long-pass emission filters. Degradation or internal reflection can cause halos. Replace if any visible damage is present.
- Protocol Step: Implement a daily "System Suitability Test" using a stable reference standard (e.g., IR-26 dye in a capillary tube) to quantify Point Spread Function (PSF) and ensure resolution is maintained.
Q3: How do we quantitatively correct for variable tissue absorption and scattering between different animal models? A: You must implement a protocol for diffuse optical tomography correction. Do not rely on raw fluorescence intensity.
- Method: Inject a reference "control" NIR-I dye (e.g., Indocyanine Green, ICG) with known pharmacokinetics prior to your NIR-II probe experiment.
- Data Processing: Use the attenuation profile of the NIR-I signal to create a wavelength-dependent correction matrix for the tissue bed. Apply this matrix to your NIR-II data to calculate corrected fluorescence efficiency.
Q4: What is the recommended method for validating co-localization of NIR-II signal with a histological finding? A: This requires a precise ex vivo correlation protocol.
- At terminal imaging, inject a vascular casting agent (e.g., DyLight 549 Lycopersicon Esculentum Lectin) via cardiac perfusion.
- Excise the organ and perform high-resolution ex vivo NIR-II scanning in a custom 3D-printed mold that preserves orientation.
- Section the tissue using a cryostat or vibratome. The vascular cast provides the fiduciary markers.
- Digitally overlay the histological (H&E, IHC) image with the ex vivo NIR-II scan using the vascular markers as alignment points (software: e.g., AMIRA, 3D Slicer).
Quantitative Data Summary for Protocol Development
Table 1: Impact of Key Acquisition Parameters on NIR-II Image Metrics
| Parameter | Typical Optimal Range | Effect on SNR | Effect on Resolution | Clinical Translation Relevance |
|---|---|---|---|---|
| Laser Power Density | 10-100 mW/cm² | Directly proportional up to photobleaching limit | Higher power can improve SNR, not inherent resolution. | Must stay below ANSI safety limits for skin. |
| Exposure Time | 50-500 ms | Proportional to square root of time | Longer exposure can increase motion blur. | Limits viable imaging in living subjects. |
| Spectral Bin Width | 10-50 nm | Wider bin = higher signal, lower spectral info | Minimal direct effect. | Determines ability to multiplex probes. |
| Detector Temp | -70°C to -90°C | Colder = lower dark noise = higher SNR | Preserves resolution by maintaining low noise. | Not applicable for cooled systems in clinic. |
Table 2: Common NIR-II Probe Classes and Their Handling Protocols
| Probe Class | Example | Key Storage Buffer | Light Sensitivity | Recommended Pre-imaging Preparation |
|---|---|---|---|---|
| Single-Wall Carbon Nanotubes | PEGylated SWCNT | PBS, 4°C | High | Centrifuge at 100,000g for 60 min to re-suspend aggregates. |
| Quantum Dots | Ag₂S QDs | Tris-HCl, 4°C | Moderate | Filter through 0.22 μm syringe filter to remove large aggregates. |
| Organic Dyes | CH-4T, IR-FEP | DMSO stock, -80°C | High | Thaw, dilute in saline, use immediately; protect from light. |
| Rare-Earth Nanoparticles | NaYF₄:Nd³⁺ | Cyclohexane, RT | Low | Ligand exchange into water, then dialyze for 48h against PBS. |
Experimental Protocol: Daily System Suitability Test for Reproducibility
Objective: To ensure day-to-day reproducibility of NIR-II imaging system performance. Materials:
- Standardized fluorescent phantom (e.g., IR-26 dye sealed in a glass capillary of 1mm diameter, embedded in 1% intralipid solution).
- Power meter with NIR sensor head.
- System calibration log sheet.
Methodology:
- Turn on laser and cooling detector. Allow 30 minutes for system stabilization.
- Place the phantom at the center of the field of view, at a defined distance from the lens (e.g., 20 cm).
- Measure laser power at the sample plane. Adjust to the defined standard power (e.g., 50 mW/cm²). Record actual value.
- Acquire an image with fixed parameters: Exposure time = 100 ms, Gain = 1, Spectral bin = 1500-1600 nm.
- Analysis:
- Draw a circular Region of Interest (ROI) around the capillary signal.
- Draw an identical ROI on a background area.
- Calculate SNR: (Mean Signal Intensity - Mean Background Intensity) / Standard Deviation of Background.
- Calculate Full Width at Half Maximum (FWHM) of the capillary line profile to assess resolution.
- Acceptance Criteria: SNR must be within ±15% of the baseline value established at protocol inception. FWHM must not vary by >10%. Log all data. If criteria are not met, initiate laser and detector diagnostic procedures.
Diagram: NIR-II System Calibration and Validation Workflow
Diagram: Tissue Optics Correction Strategy for Quantitative Imaging
The Scientist's Toolkit: Key Research Reagent Solutions
Table 3: Essential Materials for Robust NIR-II Imaging Experiments
| Item | Function in Protocol | Example/Brand | Critical Note |
|---|---|---|---|
| NIR-II Fluorescent Phantom | Provides daily system performance validation. | IR-26 dye in capillary tube, home-made. | Must be chemically stable and sealed from atmosphere. |
| Intralipid Solution (20%) | Mimics tissue scattering for phantom preparation and calibration. | Fresenius Kabi. | Dilute to 1-2% for appropriate scattering coefficient. |
| Power Meter with NIR Sensor | Ensures reproducible excitation energy delivery. | Thorlabs PM100D with S425C sensor. | Calibrate sensor annually. |
| Spectral Calibration Source | Verifies accuracy of imaging wavelength bins. | Tungsten halogen lamp with known spectrum. | Use NIST-traceable source if possible. |
| Anatomical Mold (3D-Printed) | Enables precise ex vivo to in vivo image registration. | Designed in-house (e.g., PLA material). | Must include fiduciary marker slots for alignment. |
| Vascular Casting Agent | Provides histological correlation landmarks. | DyLight 549-Tomato Lectin (Vector Labs). | Perfuse at precise pressure (e.g., 120 mmHg) for consistency. |
| Anti-fading Mounting Medium | Preserves NIR-II signal in tissue sections for validation. | ProLong Diamond Antifade Mountant. | Some NIR-II probes are still prone to fading; image sections quickly. |
Integrating NIR-II with Multimodal Imaging and Therapy (Theranostics)
Technical Support Center
Troubleshooting Guide & FAQs
Q1: Why is my NIR-II fluorescent signal unexpectedly weak or absent during in vivo imaging? A: This is commonly due to suboptimal probe concentration, quenching, or instrument settings.
- Troubleshooting Steps:
- Verify Probe Integrity: Check the probe's shelf life and storage conditions. Perform a control in vitro imaging test in a cuvette at a known concentration to confirm emission.
- Confirm Administration & Dose: Ensure the probe was injected correctly (e.g., tail vein, no extravasation) and that the dose (typically 2-10 mg/kg for nanoparticles) is appropriate for your target.
- Check Imaging Parameters: Increase laser power (ensuring animal safety limits) and adjust exposure time (100-500 ms). Confirm that the emission filter (e.g., 1200nm LP, 1500nm BP) is correctly aligned.
- Assess Quenching: If using a activatable probe, confirm the specific target enzyme or microenvironment (e.g., pH) is present. Aggregation can also cause quenching.
Q2: How do I differentiate between specific NIR-II probe uptake and non-specific background accumulation in tumors? A: Use multimodal blocking studies and kinetic analysis.
- Experimental Protocol: Multimodal Blocking Study:
- Pre-blocking Group: Inject a large dose of the targeting ligand (e.g., cRGD for αvβ3 integrin) 30 minutes prior to administering the NIR-II probe.
- Control Group: Inject only the NIR-II probe.
- Imaging: Acquire longitudinal NIR-II images at 1, 4, 12, and 24h post-injection (p.i.).
- Analysis: Use region-of-interest (ROI) analysis to quantify tumor-to-background ratio (TBR). A significantly lower TBR in the pre-blocked group confirms specific uptake. Correlate with a co-injected PET/CT tracer (e.g., ⁶⁸Ga-labeled version of the ligand) for quantitative validation.
Q3: What are common causes of high background noise in NIR-II bioimaging, and how can it be reduced? A: Background stems from tissue autofluorescence, scattering, and probe biodistribution.
- Solutions & Protocol for Background Reduction:
- Spectral Unmixing: If using a probe with a distinct emission peak (e.g., 1060nm vs 1300nm), acquire images at multiple spectral bands and use software (e.g., Aivia, ImageJ) to unmix the probe signal from autofluorescence.
- Time-Gated Imaging: For probes with long lifetimes (e.g., lanthanide-doped nanoparticles), use a pulsed laser and time-gated detection to filter out short-lived autofluorescence.
- Optimal Imaging Window: Image at later time points (e.g., 24-48h p.i.) when blood pool clearance reduces vascular background, improving TBR.
Q4: When integrating NIR-II imaging with photothermal therapy (PTT), how do I calibrate the laser dose to ensure efficacy without causing collateral damage? A: This requires careful in vitro and in vivo dosimetry.
- Calibration Protocol:
- In Vitro Calibration: Irradiate probe solutions or probe-loaded cells with the NIR-II laser (e.g., 1064nm) at varying power densities (0.3-1.0 W/cm²) for 5-10 minutes. Measure temperature rise (∆T) with an IR camera. Determine the power required to reach 50-55°C (therapeutic range).
- In Vivo Safety Margin: In a mouse model, use the power density derived in vitro. Monitor the tumor and surrounding tissue temperature in real-time via MR thermometry or an inserted thermocouple. The goal is to maintain the tumor above 50°C for 3-5 minutes while keeping surrounding tissue below 43°C. Always include a sham-treated control group (laser only, no probe).
Table 1: Comparison of Common NIR-II Fluorophores for Theranostics
| Fluorophore Type | Example Material | Peak Emission (nm) | Quantum Yield (%) | Key Therapeutic Function | Primary Challenge for Translation |
|---|---|---|---|---|---|
| Single-Walled Carbon Nanotubes | PEGylated SWCNTs | 1000-1400 | 0.1-1.0 | Photothermal Therapy (PTT) | Batch variability, long-term biodistribution |
| Lanthanide Nanoparticles | NaYF₄:Yb,Er,Ce @NaYF₄ | ~1550 | 2-5 | Drug Delivery, PTT | Complex synthesis, potential metal ion release |
| Organic Dye-Polymer | CH1055-PEG | ~1055 | 0.1-0.5 | Photodynamic Therapy (PDT) | Moderate brightness, photobleaching |
| Quantum Dots | Ag₂S QDs | 1200-1350 | 5-15 | PTT, Ion Release | Heavy metal toxicity concerns |
Table 2: Typical Performance Metrics in a Multimodal (NIR-II/MRI/PA) Imaging Study
| Imaging Modality | Probe Used | Target | Injection Dose | Optimal Imaging Time (p.i.) | Achieved Tumor-to-Background Ratio (TBR) | Spatial Resolution |
|---|---|---|---|---|---|---|
| NIR-II Fluorescence | cRGD-Ag₂S QDs | αvβ3 Integrin | 5 mg/kg | 24 h | 8.5 ± 1.2 | ~40 μm |
| T2-Weighted MRI | cRGD-SPIO Nanoparticles | αvβ3 Integrin | 2 mg Fe/kg | 4 h | Signal Drop ~60% | 100 μm |
| Photoacoustic | cRGD-Au Nanorods | αvβ3 Integrin | 10 pM/kg | 6 h | 5.2 ± 0.8 | ~150 μm |
Experimental Protocols
Protocol 1: Synthesis and Characterization of a Basic NIR-II Theranostic Nanoparticle (e.g., PEGylated Ag₂S QDs for Imaging & PTT)
- Synthesis: In a Schlenk flask, dissolve silver diethyldithiocarbamate and oleylamine. Heat to 120°C under argon. Separately, dissolve sulfur in oleylamine. Rapidly inject the sulfur solution into the flask. React at 180°C for 1 hour. Cool to room temperature.
- Phase Transfer/Ligand Exchange: Precipitate QDs with ethanol/hexane. Centrifuge and redisperse in chloroform. Add a methoxy-PEG-thiol ligand solution. Stir for 24h. Remove chloroform and precipitate with ether. Resuspend final PEGylated Ag₂S QDs in PBS or saline. Sterilize via 0.22 μm filtration.
- Characterization:
- UV-Vis-NIR Spectrometer: Confirm absorption onset in NIR-II.
- NIR Spectrofluorometer: Measure photoluminescence emission spectrum (excite at 808nm).
- Transmission Electron Microscopy (TEM): Determine size and morphology.
- Dynamic Light Scattering (DLS): Measure hydrodynamic diameter and zeta potential in PBS.
Protocol 2: Longitudinal Multimodal (NIR-II/PA/US) Imaging of Tumor Targeting
- Animal Model: Establish subcutaneous xenograft tumors (e.g., U87MG) in nude mice. Proceed when tumors reach 100-200 mm³.
- Probe Administration: Intravenously inject PEGylated-targeted Ag₂S QDs via tail vein (dose: 5 mg/kg in 100 μL saline).
- Imaging Schedule:
- Time Points: Pre-injection, 1h, 4h, 12h, 24h, 48h post-injection.
- NIR-II Imaging: Anesthetize mouse, place in imaging chamber. Acquire images using a 1064nm laser excitation and an InGaAs camera with a 1300nm long-pass filter. Use consistent laser power and exposure time.
- Photoacoustic/Ultrasound (PA/US) Imaging: Immediately after NIR-II, transfer mouse to PA/US system. Acquire coregistered B-mode US and PA images at the excitation wavelength matching the QD's absorption peak (e.g., 1064nm).
- Data Analysis: Coregister images using software. Draw ROIs over tumor and contralateral muscle. Calculate TBR for both NIR-II intensity and PA amplitude. Plot pharmacokinetic curves.
Visualizations
Title: Workflow of NIR-II Theranostic Probe from Injection to Therapy
Title: NIR-II Laser-Induced Diagnostic & Therapeutic Signaling Pathways
The Scientist's Toolkit: Research Reagent Solutions
Table 3: Essential Materials for NIR-II Theranostics Experiments
| Item | Function & Rationale | Example Product/Catalog |
|---|---|---|
| NIR-II Fluorophore | Core imaging agent. High quantum yield in 1000-1700nm range is critical for deep tissue signal. | Organic Dye: CH1055 (Sigma, LZQ-1005); Inorganic: PEGylated Ag₂S QDs (NN-Labs, SG-1300) |
| Biotargeting Ligand | Enables active targeting to overexpressed biomarkers (e.g., integrins, PSMA) on cancer cells. | cRGDfk peptide (MedChemExpress, HY-P1365); Anti-HER2 Affibody (Creative Biolabs) |
| PEGylation Reagent | Confers "stealth" properties, prolongs circulation time, reduces immune clearance (opsonization). | mPEG-Thiol (MW 5000) (Nanocs, PG1-TH-5k) |
| Matrigel | Extracellular matrix for reconstituting tumor microenvironment in subcutaneous xenograft models. | Corning Matrigel (356237) |
| NIR-II Imaging System | In vivo imaging with sensitive InGaAs detectors for capturing weak NIR-II photons. | Commercial: In-Vivo Master (NIR-II) (Gamma Medica); Custom-built: 1064nm laser + 2D InGaAs camera. |
| Multimodal Phantom | Calibration tool for co-registering signals from different imaging modalities (NIR-II, PA, MRI). | Multiwavelength Photoacoustic Phantom (EchoLabs, PA-1000) |
| IVIS Imaging Software | Standard platform for ROI analysis, quantification, and spectral unmixing of fluorescence data. | PerkinElmer Living Image Software |
| Anaesthetic System | For safe and prolonged animal anesthesia during longitudinal imaging sessions (isoflurane recommended). | VetFlo or equivalent precision vaporizer. |
Solving Real-World NIR-II Imaging Problems: Artifacts, Safety, and Performance Limits
Technical Support Center: NIR-II Imaging Troubleshooting
Troubleshooting Guides
Guide 1: Motion Artifact Reduction
- Issue: Blurred or double-contour images in dynamic NIR-II imaging.
- Root Cause: Respiratory, cardiac, or peristaltic motion during acquisition.
- Solution Steps:
- Physical Restraint: Use a stereotactic frame or custom animal bed.
- Gating: Synchronize acquisition with physiological monitors (e.g., respiratory gating).
- Software Correction: Apply post-processing image registration algorithms (e.g., TurboReg, StackReg).
- Fast Imaging: Reduce exposure time using high-sensitivity InGaAs cameras or pulsed laser systems.
Guide 2: Correcting for Tissue Heterogeneity
- Issue: Uneven signal intensity or quantification errors across different organs.
- Root Cause: Variations in tissue scattering, absorption, and fluorophore biodistribution.
- Solution Steps:
- Pre-characterize Optical Properties: Use diffuse optical tomography to map scattering (μs') and absorption (μa) coefficients at NIR-II wavelengths.
- Use Internal Reference: Co-inject a reference agent with known, stable emission in the NIR-II window.
- Apply Monte Carlo Simulation: Model light propagation in complex tissues for signal correction.
Guide 3: Suppressing Background Autofluorescence
- Issue: High background noise reducing target-to-background ratio (TBR).
- Root Cause: Endogenous fluorophores (e.g., collagen, elastin, flavins) excited by shorter wavelengths.
- Solution Steps:
- Shift to Longer Wavelengths: Use excitation >940 nm and emission >1000 nm to minimize tissue excitation.
- Time-Gated Imaging: Exploit the longer lifetime of synthetic NIR-II probes (ns-μs) versus autofluorescence (ps-ns).
- Spectral Unmixing: Acquire a full emission spectrum and computationally separate probe signal from background.
Frequently Asked Questions (FAQs)
Q1: What is the single most effective method to reduce motion artifacts in longitudinal mouse studies? A1: Respiratory-gated acquisition is considered highly effective. It involves using a pressure pad to monitor breath cycles and triggering image capture at the same respiratory phase (e.g., end-expiration), significantly improving image alignment over time.
Q2: How does tissue heterogeneity affect quantification of tumor targeting probes? A2: Heterogeneity leads to depth-dependent and location-dependent signal attenuation. A probe in a highly scattering tumor may appear dimmer than an equal amount of probe in a shallow, clear lymph node, leading to inaccurate pharmacokinetic or biodistribution data without correction.
Q3: Are there specific NIR-II fluorophore classes that inherently minimize background? A3: Yes. Lanthanide-doped nanoparticles (e.g., Er³⁺-doped) and some cyanine dyes excitable beyond 1000 nm show minimal off-target excitation, drastically reducing autofluorescence compared to traditional NIR-I dyes like ICG.
Q4: What hardware specification is most critical for improving signal-to-noise ratio (SNR) in deep tissue? A4: The detector quantum efficiency (QE) in the 1000-1700 nm range is paramount. Modern, cooled 2D InGaAs arrays with >80% QE in this region provide significantly higher SNR than older generation detectors.
Table 1: Impact of Artifact Mitigation Strategies on Key Imaging Metrics
| Mitigation Strategy | Target Artifact | Reported Improvement in TBR | Effect on Temporal Resolution | Key Reference Compound |
|---|---|---|---|---|
| Long-Wavelength Excitation (>1000 nm) | Background Autofluorescence | 3- to 10-fold increase | Minimal impact | CH1055 dye, Lanthanide Nanoparticles |
| Time-Gated Imaging | Background Autofluorescence & Scatter | 2- to 5-fold increase | Reduced (requires pulsed laser) | PbS Quantum Dots, Rare-Earth Probes |
| Respiratory Gating | Motion Blur | Improves co-registration accuracy by ~60% | Increases total scan time | Any longitudinal probe |
| Spectral Unmixing | Tissue Heterogeneity & Background | Enables precise quantification in complex media | Moderate (requires spectral scan) | Multiplexed NIR-II probes |
Table 2: Optical Properties of Common Tissues in the NIR-II Window
| Tissue Type | Approximate Reduced Scattering Coefficient μs' (cm⁻¹) @ 1064 nm | Approximate Absorption Coefficient μa (cm⁻¹) @ 1064 nm | Effective Penetration Depth (mm) |
|---|---|---|---|
| Skin | 12 - 18 | 0.3 - 0.5 | 2 - 3 |
| Brain (Grey Matter) | 8 - 12 | 0.2 - 0.3 | 3 - 5 |
| Liver | 10 - 15 | 0.4 - 0.7 | 2 - 4 |
| Muscle | 9 - 14 | 0.3 - 0.4 | 3 - 4 |
| Fat | 5 - 10 | 0.1 - 0.2 | 5 - 8 |
Experimental Protocols
Protocol 1: Respiratory-Gated NIR-II Imaging in Mice
- Objective: To acquire motion-artifact-free images of thoracic or abdominal regions.
- Materials: NIR-II imaging system, anestheticized mouse, physiological monitoring unit with respiration pad, stereotactic bed.
- Method:
- Anesthetize mouse and place on heated bed with respiration pad under torso.
- Secure mouse in a custom 3D-printed holder to limit voluntary movement.
- Connect respiration pad output to the imaging system's external trigger port.
- Set trigger to acquire a frame at the "trough" of the respiration waveform (end-expiration).
- Administer NIR-II probe intravenously.
- Initiate gated acquisition sequence. The system will collect one frame per respiratory cycle.
- Reconstruct gated frames into a time-series video.
Protocol 2: Ex Vivo Tissue Phantom Calibration for Heterogeneity Correction
- Objective: To create a calibration curve for correcting depth-dependent signal attenuation.
- Materials: Homogeneous NIR-II phantom (e.g., Intralipid solution), capillary tubes, NIR-II probe at known concentrations, imaging system.
- Method:
- Prepare a series of dilutions of the NIR-II probe in PBS.
- Fill thin glass capillary tubes with each dilution.
- Embed the capillaries at known depths (e.g., 1, 2, 3, 4 mm) within the tissue-mimicking phantom.
- Image the phantom under standardized settings.
- Measure the mean signal intensity for each capillary.
- Plot signal intensity vs. known concentration for each depth to generate depth-attenuation curves.
- Use this model to correct signal from in vivo images based on estimated depth from co-registered 3D imaging (e.g., MRI, CT).
Visualizations
Diagram Title: NIR-II Artifact Troubleshooting Decision Workflow
Diagram Title: Origin and Mitigation Pathways of Key NIR-II Artifacts
The Scientist's Toolkit: Research Reagent Solutions
Table 3: Essential Materials for Advanced NIR-II Imaging Studies
| Item Name | Category | Primary Function | Example/Notes |
|---|---|---|---|
| CH-1055 PEGylated Dye | NIR-II Fluorophore | A small-molecule dye excitable at 808 nm for deep-tissue, high-contrast imaging. | Offers brighter emission >1000 nm than early NIR-I dyes. |
| Er³⁺-Doped Nanoparticles | NIR-II Fluorophore | Inorganic probe for >1500 nm emission; minimal autofluorescence via long-wavelength excitation. | Excellent for high TBR imaging but with potential biocompatibility considerations. |
| Intralipid 20% | Tissue Phantom | A standardized lipid emulsion used to create tissue-mimicking phantoms for system calibration. | Mimics tissue scattering (μs') in the NIR-II window. |
| India Ink | Tissue Phantom | Used in phantoms to precisely tune the absorption coefficient (μa) to match specific tissues. | Provides broad-spectrum absorption. |
| Fiducial Markers (NIR-absorbing) | Registration Aid | Small, inert markers placed on the subject to facilitate multi-modal image co-registration. | Critical for correlating NIR-II with CT/MRI data. |
| Respiratory Gating System | Hardware Add-on | A pressure-sensing pad and trigger module to synchronize image acquisition with the animal's breath cycle. | Essential for motion-free thoracic/abdominal imaging. |
| Spectral Unmixing Software | Analysis Tool | Computational package to decompose mixed spectral signals into individual components. | Enables use of multiplexed probes and autofluorescence subtraction. |
Optimizing Signal-to-Noise Ratio (SNR) and Contrast-to-Noise Ratio (CNR) in Deep Tissue
Technical Support Center & Troubleshooting Guide
FAQ & Common Issues
Q1: Why is my overall NIR-II image intensity too low, leading to poor SNR? A: This is often caused by insufficient excitation laser power or suboptimal probe concentration. First, verify your laser power at the sample plane with a calibrated power meter. Ensure it is within the safe but effective range (typically 100-300 mW/cm² for in vivo studies). Second, check your probe's absorption at the excitation wavelength via spectrophotometry. You may need to increase injected dose, but remain within toxicity limits. Third, confirm that all optical filters (especially long-pass emission filters) are clean and correctly seated.
Q2: How can I reduce high background noise, which is degrading my CNR? A: High background usually stems from autofluorescence, imperfect filter blocking, or light leaks. Implement a strict spectral unmixing protocol: acquire a control image from a non-injected subject under identical settings and subtract. Use a series of stacked long-pass or band-pass filters (e.g., 1300nm LP + 1500nm LP) to minimize excitation light bleed-through. Ensure complete darkness in the imaging chamber; check all seals and gaskets.
Q3: My target-to-background ratio (TBR) is lower than expected in deep tissue (>5mm). What should I check? A: Deep tissue CNR loss is frequently due to photon scattering and absorption. Switch to longer NIR-II wavelengths (e.g., 1500-1700 nm) where tissue scattering is reduced. Optimize your acquisition geometry for epi- or trans-illumination based on target depth. Validate that your probe's emission peak is within a low tissue absorption window (see Table 1). Consider using time-gated or frequency-domain techniques to separate signal from superficial noise.
Q4: What are the best practices for camera settings to maximize SNR in dynamic studies? A: For InGaAs or superconducting cameras: 1) Bin pixels (2x2 or 4x4) to reduce read noise at the cost of resolution. 2) Increase integration time as much as motion artifacts allow. 3) Use cooling to its maximum stable level to minimize dark current. 4) For fluorescence imaging, avoid saturation; operate in the linear range of the camera's dynamic range. Capture a dark frame and a flat-field reference for correction.
Q5: How do I quantitatively validate improvements in SNR/CNR after protocol optimization? A: Follow a standardized measurement protocol:
- SNR Calculation:
SNR = (Mean Signal in ROI - Mean Background) / Standard Deviation of Background. - CNR Calculation:
CNR = |Mean Signal_ROI - Mean Background| / Standard Deviation of Background. Acquire images of a stable phantom (e.g., capillary tube with IR-1061 dye in intralipid) under identical conditions before and after changes. Report results as in Table 2.
Quantitative Data Reference Tables
Table 1: Tissue Optical Properties in the NIR-II Windows
| Wavelength Range (nm) | Typical Scattering Coefficient (μs') [cm⁻¹] * | Typical Absorption Coefficient (μa) [cm⁻¹] * | Primary Absorber | Recommended Use Case |
|---|---|---|---|---|
| 1000-1300 | 5-10 | 0.3-0.5 | Water, Lipids | High-resolution vascular imaging (shallow) |
| 1300-1400 | 4-8 | 0.8-1.2 | Water | Limited depth due to water absorption peak |
| 1500-1700 | 3-6 | 0.4-0.7 | Water | Optimal for deep tissue (>5mm) imaging |
*Values are approximate and tissue-dependent. Source: Recent review articles on NIR-IIb imaging.
Table 2: Example SNR/CNR Metrics from Optimization Steps
| Experimental Condition | Mean Target Signal (a.u.) | Mean Background (a.u.) | SD Background (a.u.) | Calculated SNR | Calculated CNR |
|---|---|---|---|---|---|
| Baseline (1250nm LP) | 5500 | 1200 | 180 | 23.9 | 23.9 |
| + 1500nm LP Filter | 4800 | 350 | 65 | 68.5 | 68.5 |
| + Pixel Binning (4x4) | 4750 | 340 | 45 | 98.0 | 98.0 |
| + Spectral Unmixing | 4600 | 150 | 40 | 111.3 | 111.3 |
Detailed Experimental Protocols
Protocol 1: System Calibration for Quantitative SNR/CNR Measurement Objective: To establish a reproducible baseline for system performance. Materials: NIR-II calibration phantom (e.g., 1 mM IR-1061 in DMSO sealed in glass capillary, embedded in 1% intralipid), power meter, ruler. Steps:
- Turn on laser and camera, allowing 30 min for stabilization.
- Place phantom at the focal plane. Measure laser power density at the sample.
- Acquire image with parameters: 100 ms integration, no binning, appropriate filter.
- Capture a "dark" image with the same settings while blocking the laser path.
- Define three consistent ROIs: a) High signal (capillary), b) Background (intralipid region), c) Dark region.
- Calculate mean and standard deviation for each ROI over 10 consecutive images.
- Compute SNR and CNR using formulas above. Record values in a system log.
Protocol 2: In Vivo Deep-Tissue CNR Optimization Objective: To image a deep-seated tumor model with maximal CNR. Materials: Mouse with subcutaneous or orthotopic tumor, NIR-II molecular probe (e.g., targeted Ag2S QDs), anesthesia setup, heating pad, 1500nm long-pass filter stack. Steps:
- Inject probe via tail vein at optimal dose (e.g., 200 µL of 100 µM).
- Allow 24-48 hours for clearance and target accumulation.
- Anesthetize animal and position for imaging. Maintain body temperature.
- Initial Scan: Image at 1100-1700nm window (broad) with 300 ms integration.
- Optimized Scan: Switch to 1500nm LP filter set. Increase integration time to 500 ms if motion allows. Apply 2x2 pixel binning.
- Acquire post-mortem image for autofluorescence reference.
- Process images: Subtract autofluorescence reference, apply uniform flat-field correction.
- Draw ROIs on tumor (T) and contralateral muscle (M). Calculate CNR = (MeanT - MeanM) / SD_M.
Visualizations
Title: Troubleshooting Workflow for Low SNR/CNR in NIR-II Imaging
Title: Key Factors Affecting NIR-II Photon Journey to Detector
The Scientist's Toolkit: Research Reagent Solutions
| Item | Function & Rationale |
|---|---|
| NIR-II Fluorophores (e.g., Ag2S QDs, IR-1061, Lanthanide-doped NPs) | Emit light in the 1000-1700 nm range. Choice depends on target brightness, emission peak (prefer >1500 nm for depth), and biocompatibility. |
| Targeting Ligands (e.g., Antibodies, Peptides, Aptamers) | Conjugated to fluorophores to achieve specific accumulation at the disease site, essential for high CNR in molecular imaging. |
| Tissue-Simulating Phantoms (e.g., Intralipid, India Ink, Agarose) | Mimic tissue scattering and absorption properties for system calibration and quantitative protocol validation. |
| Long-Pass & Band-Pass Filter Sets (e.g., 1300nm, 1500nm LP) | Critically block excitation light and short-wavelength noise, directly improving SNR and CNR. Stacking filters increases optical density. |
| Reference Dyes (e.g., IR-26, IR-1061 in DMSO) | Stable, bright standards for measuring system response, normalizing signals between experiments, and checking filter performance. |
| Immersion Fluids (e.g., Glycerol, Ultrasound Gel) | Index-matching fluids placed between tissue and detector to reduce surface scattering and improve photon collection efficiency. |
Addressing Probe Pharmacokinetics, Clearance, and Potential Long-Term Toxicity
Troubleshooting Guide & FAQs
Q1: Our NIR-II probe shows rapid blood clearance in murine models, leading to insufficient target accumulation. What are the primary factors influencing pharmacokinetics (PK)? A1: Rapid clearance is often due to small hydrodynamic diameter (<6 nm) leading to renal filtration, or inadequate surface PEGylation leading to opsonization and reticuloendothelial system (RES) uptake. Adjust PK by:
- Increase Size: Formulate probes in the 10-20 nm range to avoid immediate renal clearance.
- Optimize Coating: Implement dense PEG layers (using ≥ 5k Da PEG chains) to confer "stealth" properties and reduce protein corona formation.
- Modify Surface Charge: Aim for a slightly negative to neutral zeta potential (-10 to +10 mV) to minimize nonspecific interactions.
Q2: We observe high non-specific liver/spleen uptake (RES sequestration) with our probe. How can we improve biodistribution? A2: High RES uptake indicates suboptimal surface engineering. Troubleshoot using the following data:
| Mitigation Strategy | Typical Target Parameter | Effect on Liver Uptake (%ID/g)* | Effect on Circulation Half-life (t1/2β)* |
|---|---|---|---|
| Dense PEG Coating | >1 PEG chain per nm² | Decrease by 40-60% | Increase from minutes to hours |
| Optimized PEG MW | PEG 2k-5k Da | Decrease by 30-50% | Significant increase |
| Zwitterionic Ligands | N/A | Decrease by 50-70% | Major increase (>12 h possible) |
| %ID/g: Percentage of Injected Dose per gram of tissue. Example ranges from recent literature. |
Experimental Protocol: Assessing RES Uptake
- Probe Administration: Inject probe intravenously (IV) via tail vein in mice (n=5 per group).
- Tissue Harvest: Euthanize animals at multiple time points (e.g., 1, 4, 24, 48 h). Harvest liver, spleen, kidneys, and tumor (if applicable).
- Quantification: Weigh tissues. For fluorescent probes, homogenize tissues and measure NIR-II fluorescence intensity using a calibrated imaging system. Compare to a standard curve of the probe to calculate %ID/g.
- Imaging: Perform ex vivo NIR-II imaging of intact organs for spatial distribution.
Q3: What are the key concerns regarding long-term toxicity of inorganic NIR-II probes (e.g., quantum dots, rare-earth-doped nanoparticles), and how can they be assessed? A3: Primary concerns are heavy metal ion leaching (e.g., Cd²⁺, Pb²⁺, Ag⁺), persistent accumulation leading to granuloma formation, and immune system activation. Assessment protocol:
- In Vitro Leaching Test: Incubate probes in simulated body fluids (pH 4.5 and 7.4) at 37°C. Use inductively coupled plasma mass spectrometry (ICP-MS) at intervals (1, 7, 30 days) to quantify released ions.
- Long-Term Biodistribution Study: Track probe signal via NIR-II imaging over months (e.g., 1, 3, 6 months). Perform histopathological analysis (H&E staining, Prussian blue for iron, special stains for fibrosis) on major organs post-mortem.
- Chronic Toxicity Study: Monitor animal weight, behavior, and standard blood biomarkers (e.g., liver enzymes, creatinine, CBC) over 3-6 months following a single diagnostic dose.
Q4: How do we accurately measure the clearance pathways (renal vs. hepatobiliary) of an NIR-II probe? A4: A dual-modality approach is recommended.
- Real-Time NIR-II Imaging: Image the abdominal region to visualize probe transit through kidneys/ureters/bladder or liver/intestines.
- Excreta Collection & Quantification: House animals in metabolic cages. Collect urine and feces at defined intervals (0-4h, 4-24h, 24-48h). Digest samples and use ICP-MS (for elemental composition) or fluorescence correlation spectroscopy to quantify excreted probe mass.
- Data Analysis: Calculate cumulative excretion percentage for each route. Renal-dominant probes show >70% of dose in urine within 24h. Hepatobiliary probes appear in feces after a lag time.
The Scientist's Toolkit: Key Research Reagent Solutions
| Item | Function in PK/Clearance/Toxicity Studies |
|---|---|
| PEG-SH (Thiol-PEG) | Conjugates to gold or quantum dot surfaces to impart stealth properties, modifying PK. |
| DOTA-NHS Ester | Chelator for radiolabeling probes with isotopes like ⁶⁴Cu for precise, quantitative PK tracking via PET. |
| ICP-MS Standard Solutions | Calibration standards for quantifying elemental composition and metal ion leaching. |
| Simulated Body Fluids (SBF) | Buffered solutions mimicking physiological or lysosomal conditions for accelerated leaching studies. |
| Metabolic Cages | Specialized housing for the separate, quantitative collection of urine and feces from rodents. |
| Near-Infrared-II Fluorescence Imaging System | In vivo imager with >1000 nm detection for non-invasive, real-time biodistribution tracking. |
Experimental Workflow & Pathway Diagrams
Probe Development and Evaluation Workflow
Key Factors Determining Probe Fate In Vivo
Calibration and Maintenance of Clinical-Grade NIR-II Imaging Hardware
Technical Support Center
Troubleshooting Guides & FAQs
Q1: The acquired NIR-II image appears excessively noisy with poor signal-to-noise ratio (SNR). What are the primary causes and solutions?
A: High noise typically stems from detector temperature, ambient light, or laser instability. First, ensure the InGaAs or HgCdTe detector is cooled to its specified operating temperature (e.g., -80°C). Confirm the imaging chamber is fully light-tight. Check the stability of the excitation laser power output using a power meter; fluctuations should be <2%. Increase the acquisition frame averaging (e.g., from 5 to 15 frames) and optimize the integration time. Regularly calibrate using a uniform phantom to establish a baseline noise floor.
Q2: Spatial resolution in our images has degraded over time. How should we diagnose and correct this?
A: This indicates a potential misalignment of the optical path or component wear. Perform a weekly modulation transfer function (MTF) calibration using a USAF 1951 resolution target or a sharp edge phantom. Calculate the MTF from the edge spread function. If the resolution (e.g., line pairs/mm) has dropped by >15% from baseline, a full optical realignment is required. Follow the laser beam path using an IR viewer card and check all lenses and filters for dust or damage. Re-align by iteratively adjusting the first and second steering mirrors while maximizing signal from a point source.
Q3: How do we quantify and correct for temporal drift in signal intensity during longitudinal studies?
A: Temporal drift can originate from laser diode decay, detector sensitivity change, or reagent photobleaching. Implement a rigorous daily calibration protocol using stable reference standards (e.g., IR-26 dye in sealed capillary tubes or solid epoxy phantoms with embedded NIR fluorophores). Acquire images of the reference at fixed parameters. Normalize all subsequent experimental data using the reference intensity. Track the reference intensity over time; a drop >10% per 100 hours of laser operation may indicate the need for laser source replacement.
Q4: We observe non-uniform illumination (vignetting) across the field of view (FOV). How is flat-field correction performed?
A: Flat-field correction is essential for quantitative analysis. Use a uniform reflectance standard (e.g., Spectralon disc) or a uniformly scattering fluorescent phantom.
- Acquire a raw image of the uniform source,
I_raw(x,y). - Acquire a dark image with the laser off,
I_dark(x,y). - Calculate the correction matrix:
Flat_field(x,y) = (I_raw(x,y) - I_dark(x,y)) / mean(I_raw - I_dark). - Apply to all future images:
I_corrected(x,y) = (I_sample(x,y) - I_dark(x,y)) / Flat_field(x,y). Repeat this calibration for each objective lens and wavelength setting.
Q5: What is the standard protocol for validating system sensitivity (Minimum Detectable Fluorochrome Concentration) after maintenance?
A: Prepare a serial dilution of a known NIR-II fluorophore (e.g., IRDye 800CW, CH-4T) in PBS or intralipid solution (1% v/v) to mimic tissue scattering. Use concentrations from 100 nM down to 1 pM. Image using your standard in vivo protocol (laser power, exposure time). The Minimum Detectable Concentration (MDC) is the lowest concentration where the mean signal is statistically greater (p<0.01, t-test) than the background (blank solution) plus three standard deviations. Document the MDC in a system log.
Table 1: Recommended Calibration Schedule & Specifications
| Component | Calibration Activity | Frequency | Acceptance Criteria | Typical Value Range |
|---|---|---|---|---|
| Laser Source | Power Stability Check | Daily | Fluctuation < ±2% | Output as per setting (e.g., 50 mW) |
| Wavelength Accuracy | Quarterly | Deviation < ±3 nm | 808 nm, 980 nm, etc. | |
| Detector (Cooled) | Temperature Stability | Per Session | Setpoint ±0.5°C | -80°C for InGaAs |
| Dark Current Noise | Weekly | Counts < 500 (16-bit) | Region of Interest (ROI) mean | |
| Spatial Performance | MTF / Resolution Check | Weekly | >15% drop triggers action | 20-40 µm (in vivo) |
| Intensity Calibration | Reference Standard Imaging | Daily | Intensity drop <10% from baseline | Normalized Counts |
| Flat-Field | Uniform Phantom Imaging | Monthly or per lens change | Non-uniformity < 5% across central 80% FOV | Correction matrix generated |
Table 2: Common NIR-II Fluorophores for System Validation
| Reagent Name | Peak Emission (nm) | Primary Use Case | Recommended Storage |
|---|---|---|---|
| IR-26 Dye | ~1300 nm | System sensitivity benchmark | Sealed, dark, ambient |
| IRDye 800CW | ~800 nm (NIR-I) / tail into NIR-II | Resolution phantom, antibody conjugation | -20°C, desiccated |
| CH-4T (or similar) | ~1000-1100 nm | In vivo sensitivity calibration | Under argon, -80°C |
| PbS/CdS Quantum Dots | ~1200-1600 nm | Brightness reference, multiplexing | 4°C in buffer |
| Single-Walled Carbon Nanotubes | ~1000-1700 nm | Deep tissue penetration reference | In solution, 4°C |
Experimental Protocols
Protocol 1: Daily System Performance Validation
- Power On: Switch on chiller, allow detector to reach operating temperature (30 min).
- Laser Check: Measure laser output power with calibrated meter. Record.
- Dark Image: Cap the detector, acquire 10-frame average with standard exposure. Save as
Dark_Ref. - Reference Imaging: Place IR-26 capillary or solid phantom in FOV. Acquire image at standard settings (e.g., 100 ms, 980 nm excitation). Save as
Daily_Ref. - Analysis: Calculate mean signal in a fixed ROI on
Daily_Ref, subtract meanDark_Refsignal. Plot on a control chart against historical data. - Resolution Check (Weekly): Image USAF target. Determine the smallest distinguishable element group.
Protocol 2: Comprehensive Monthly Alignment & MTF Calibration
- Safety: Wear appropriate laser safety goggles.
- Beam Path Visualization: Using an IR card, verify the laser beam is centered through the first aperture.
- Mirror Alignment: Place a removable alignment target at the sample plane. Iteratively adjust steering mirrors M1 and M2 to center the beam.
- Focus Alignment: Use a sharp edge phantom. Adjust the tube lens or camera position to achieve minimal edge blur in the live image.
- MTF Measurement: a. Image a sharp edge or high-contrast bar pattern. b. Extract the Edge Spread Function (ESF). c. Differentiate ESF to get the Line Spread Function (LSF). d. Apply Fourier Transform to LSF to generate the MTF curve. e. Record the spatial frequency where MTF = 0.1 (10% contrast).
The Scientist's Toolkit: Research Reagent Solutions
| Item | Function & Role in Calibration/Maintenance |
|---|---|
| NIR-II Resolution Phantom | Micropatterned target (e.g., USAF, lines) for quantifying spatial resolution and MTF. |
| Uniform Fluorescent Phantom | Epoxy or intralipid-based block with homogenous fluorophore for flat-field correction. |
| Stable Reference Dye (IR-26) | Provides a consistent NIR-II signal for tracking system sensitivity drift over time. |
| Spectralon Disc | >99% reflective diffuse standard for flat-fielding and system responsivity checks. |
| Laser Power Meter | Validates excitation source output stability, critical for reproducible quantitation. |
| IR Viewing Card | Safe visualization of near-infrared beams for optical path alignment. |
| Intralipid 20% Solution | Scattering medium to create tissue-mimicking phantoms for protocol development. |
Visualization Diagrams
Daily NIR-II System Validation Workflow
Flat-Field Correction Process Flow
Troubleshooting Guides & FAQs
Q1: During NIR-II image reconstruction, why do I observe severe motion artifacts and blurring in my in vivo data? A: Motion artifacts are a primary challenge for clinical translation. This is often due to physiological motion (respiration, cardiac cycle) during long acquisition times required for high-resolution spectral unmixing. Implement a retrospective gating algorithm. Acquire images with a high frame rate (>30 fps) while recording a synchronous physiological signal (e.g., respiratory pressure pad). In post-processing, use the signal to bin and align frames into specific motion phases before reconstruction. Ensure your algorithm compensates for non-rigid deformations.
Q2: My quantified NIR-II fluorescence signal intensity varies significantly between imaging sessions, even with the same dose. How can I normalize this? A: Inter-session variability stems from inconsistent laser power, detector sensitivity drift, and tissue optical property changes. Implement a two-step normalization protocol:
- Hardware Normalization: Before each session, image a stable reference phantom with embedded NIR-II dye (e.g., IR-26 in epoxy resin). Use its signal to correct for system throughput.
- In vivo Internal Reference: Co-inject a spectrally distinct, non-targeted reference agent. Ratio the targeted signal to the reference channel's signal in a background tissue region to account for animal-specific pharmacokinetic differences.
Q3: What causes high background noise and low signal-to-noise ratio (SNR) in deep-tissue NIR-II quantification? A: This is typically due to incomplete suppression of autofluorescence and scattering. First, verify that your spectral unmixing algorithm uses a representative in vivo autofluorescence signature, not one from ex vivo tissue. Second, for deep-tissue imaging, shift to longer wavelengths within the NIR-II window (e.g., 1500-1700 nm) where scattering reduces. Employ a denoising algorithm like a block-matching 3D (BM3D) filter during reconstruction, not after, to preserve quantification accuracy.
Q4: When performing multiplexed imaging (>3 probes), my unmixing results show high crosstalk and negative values. How do I resolve this? A: This indicates ill-conditioning of your spectral library matrix. The acquisition spectra of your probes are likely too similar. Solutions:
- Experimentally: Develop or procure probes with more distinct emission peaks.
- Algorithmically: Apply non-negativity constraints and sparse reconstruction techniques (e.g., Lasso regression) to the linear unmixing model. Incorporate spatial information via regularization terms that promote smoothness within organ regions.
- Protocol: Always validate unmixing results by imaging each probe individually under identical conditions to build your library matrix.
Q5: How do I accurately quantify biodistribution from my NIR-II images when the signal is non-linearly related to probe concentration? A: The non-linearity is due to tissue attenuation (absorption, scattering). You must establish an in situ calibration curve. Create a tissue-simulating phantom series with known probe concentrations. Image the phantoms at varying depths. Fit the data to derive a depth- and intensity-dependent correction function. Apply this function pixel-wise using a depth map estimated from a co-registered 3D imaging modality (e.g., ultrasound, MRI) or using the probe's own excitation light attenuation profile.
Experimental Protocol: Validating a Novel NIR-II Image Reconstruction Algorithm
Objective: To compare the accuracy and speed of a novel Deep Learning (DL)-based reconstruction algorithm against traditional Compressed Sensing (CS) for recovering sub-sampled NIR-II data.
Materials: See "Research Reagent Solutions" table.
Method:
- Data Acquisition:
- Image 6 nude mice injected with a targeted NIR-II probe (e.g., 5 nmol, via tail vein) using a full-sampling protocol (256x256 pixels, 100 frames) at the peak uptake time (e.g., 24h post-injection). This is the Ground Truth (GT) dataset.
- Artificially sub-sample the GT data in k-space at rates of 25%, 10%, and 5% using random Cartesian under-sampling masks.
Algorithm Application:
- CS Group: Reconstruct each sub-sampled dataset using a standard CS algorithm (e.g., Total Variation minimization with Nesterov acceleration). Optimize the regularization parameter (λ) via grid search for each sampling rate.
- DL Group: Input the same sub-sampled data into a pre-trained U-Net model. The model was trained on a separate dataset of 20 mice, using sub-sampled images as input and fully-sampled images as labels.
Quantification & Analysis:
- Calculate Peak Signal-to-Noise Ratio (PSNR) and Structural Similarity Index (SSIM) between each reconstructed image and the GT.
- In GT images, define 3 Regions of Interest (ROIs): target organ, background tissue, and a major vessel. Measure the mean signal intensity in each ROI. Repeat for reconstructed images and calculate the Percent Error for each algorithm.
- Record the Computational Time for each reconstruction on a standard workstation (CPU: Intel i9, GPU: NVIDIA RTX 4090).
Table 1: Quantitative Comparison of Reconstruction Algorithms (Mean ± SD, n=6)
| Sampling Rate | Algorithm | PSNR (dB) | SSIM (0-1) | % Error (Target Organ) | % Error (Background) | Comp. Time (s) |
|---|---|---|---|---|---|---|
| 25% | CS | 32.5 ± 1.2 | 0.92 ± 0.03 | 8.7 ± 3.1 | 15.2 ± 5.6 | 45.2 ± 2.8 |
| 25% | DL (U-Net) | 38.1 ± 0.8 | 0.98 ± 0.01 | 2.1 ± 1.0 | 4.3 ± 2.1 | 0.05 ± 0.01 |
| 10% | CS | 28.1 ± 1.5 | 0.81 ± 0.05 | 22.5 ± 6.7 | 41.8 ± 9.4 | 32.1 ± 1.5 |
| 10% | DL (U-Net) | 34.8 ± 1.0 | 0.94 ± 0.02 | 5.8 ± 2.5 | 11.3 ± 4.0 | 0.05 ± 0.01 |
| 5% | CS | 24.3 ± 2.1 | 0.65 ± 0.08 | 45.3 ± 10.2 | 78.9 ± 12.5 | 28.5 ± 1.1 |
| 5% | DL (U-Net) | 31.0 ± 1.3 | 0.87 ± 0.04 | 12.4 ± 4.3 | 23.6 ± 6.8 | 0.05 ± 0.01 |
Visualizations
NIR-II Image Processing & Analysis Workflow
Algorithm Selection Logic for NIR-II Data
The Scientist's Toolkit: Research Reagent Solutions
Table 2: Essential Materials for NIR-II Imaging Experiments
| Item | Function & Rationale | Example/Note |
|---|---|---|
| NIR-II Fluorophores | Generate signal within the biological transparency window (1000-1700 nm) for deep tissue penetration. | Organic dyes (CH-4T), quantum dots (Ag2S), single-wall carbon nanotubes (SWCNTs). |
| Targeting Ligands | Confer molecular specificity to the probe for imaging biomarkers of interest. | Antibodies, peptides, aptamers conjugated to the fluorophore. |
| Reference Phantom | Provides a stable signal source for inter-session hardware normalization and system calibration. | IR-26 dye embedded in solid epoxy resin or agarose. |
| Tissue-Simulating Phantom | Mimics tissue scattering/absorption for developing and validating quantification algorithms. | Lipoidal emulsion (Intralipid) & Indian ink in agarose at varying concentrations. |
| Spectral Library | A set of pure probe spectra essential for accurate linear unmixing in multiplex studies. | Must be acquired in vivo or in a tissue phantom, not in buffer. |
| Image Analysis Software | Enables application of reconstruction algorithms, ROI analysis, and pharmacokinetic modeling. | MATLAB with custom scripts, Python (SciKit-image, TensorFlow), or commercial solutions (Living Image, Aivia). |
Benchmarking NIR-II: Validation Frameworks and Head-to-Head Comparisons with Clinical Modalities
Establishing Regulatory and Validation Pathways for NIR-II Contrast Agents and Devices
Technical Support Center: Troubleshooting Guides and FAQs
Q1: Our NIR-II contrast agent shows excellent quantum yield in vitro, but the in vivo signal is unexpectedly weak and rapidly declines. What are the potential causes? A: This is a common translational challenge often related to biomolecular corona formation and rapid clearance. Upon intravenous administration, proteins (e.g., albumin, immunoglobulins) rapidly adsorb to the nanoparticle surface, forming a "corona." This can cause aggregation, increasing hydrodynamic size and leading to nonspecific sequestration by the mononuclear phagocyte system (MPS), primarily in the liver and spleen. This results in shortened blood circulation half-life and reduced target accumulation.
Troubleshooting Protocol:
- Characterize Plasma Protein Binding:
- Method: Incubate your agent (at a typical injection concentration) with mouse or human plasma (1:1 v/v) at 37°C for 1 hour.
- Analysis: Use dynamic light scattering (DLS) to measure size increase (Z-average) and polydispersity index (PDI) shift. Confirm via sodium dodecyl sulfate-polyacrylamide gel electrophoresis (SDS-PAGE) of centrifuged pellets to identify bound proteins.
- Quantify Pharmacokinetics and Biodistribution:
- Method: Administer agent to healthy mice (n=3-5 per time point) via tail vein. Collect blood retro-orbitally at defined intervals (e.g., 2 min, 15 min, 1h, 4h, 24h). At terminal time points, harvest major organs (liver, spleen, kidneys, lungs, heart, brain, muscle).
- Analysis: Measure NIR-II fluorescence intensity in blood and homogenized organs using a calibrated imaging system. Calculate key PK parameters: clearance half-life (t1/2) and area under the curve (AUC).
Q2: We observe high background signal in the liver/spleen region, obscuring potential detection of abdominal tumors. How can we improve target-to-background ratio (TBR)? A: High background is typically due to nonspecific MPS uptake. Strategies focus on "stealth" engineering and active targeting.
Experimental Workflow to Optimize TBR:
Q3: What are the critical physicochemical characterization tests required for an Investigational New Drug (IND) application for an NIR-II agent? A: Regulatory bodies (FDA, EMA) require comprehensive characterization to establish identity, strength, quality, purity, and potency (CQAs). Key data must be tabulated.
Table 1: Critical Quality Attributes (CQAs) for an NIR-II Contrast Agent
| Attribute Category | Specific Test | Target Specification | Analytical Method |
|---|---|---|---|
| Identity & Structure | Chemical Structure / Core Composition | Conforms to reference standard | NMR, Mass Spectrometry, XRD |
| Organic Coating / Ligand Identity | >95% conjugation efficiency | FTIR, NMR, HPLC | |
| Purity & Impurities | Heavy Metal Content (Pb, Cd, Hg, As) | < ppm level per ICH Q3D | ICP-MS |
| Free Unbound Ligand | < 5% | Size-Exclusion HPLC | |
| Endotoxin & Sterility | < 0.25 EU/mL, Sterile | LAL Test, USP <71> | |
| Physicochemical Properties | Hydrodynamic Diameter & PDI | Mean ± SD, PDI < 0.2 | Dynamic Light Scattering (DLS) |
| Zeta Potential | Consistent batch-to-batch | Electrophoretic Light Scattering | |
| Absorbance & Emission Maxima | λmax ± 5 nm | UV-Vis-NIR Spectroscopy | |
| Quantum Yield (vs. Reference) | Report relative value | Calibrated NIR Spectrofluorometer | |
| Stability | Shelf-Life Stability (at 2-8°C) | No aggregation/degradation over 24 months | DLS, Fluorescence over time |
| In Vitro Serum Stability (in PBS/Serum) | Size change < 10% over 24h | DLS after incubation |
The Scientist's Toolkit: Research Reagent Solutions
- ICG (Indocyanine Green): FDA-approved NIR-I dye. Used as a benchmark for pharmacokinetic studies and to validate imaging system sensitivity.
- PEG-SH (Polyethylene Glycol Thiol): A common surface ligand for gold nanorods or quantum dots to confer "stealth" properties and improve biocompatibility.
- DSPE-PEG(2000)-Maleninde: A phospholipid-PEG conjugate used for constructing targeted liposomal or micellar NIR-II agents, enabling stable insertion into lipid bilayers.
- IRDye 800CW: A commercial NIR-I dye. Often used in dual-mode imaging experiments to correlate NIR-II findings with a more established fluorophore.
- SWIR (Short-Wave Infrared) Calibration Kit: A set of stable, fluorescent reference materials with known intensity to calibrate imaging devices and ensure quantitative accuracy across experiments.
- Matrigel: Used for establishing subcutaneous xenograft tumor models and for creating orthotopic tumor models by mixing with tumor cells.
Q4: When validating an NIR-II imaging device for preclinical research, what performance parameters must be quantified, and how? A: Device validation ensures data reproducibility and reliability for GLP-compliant studies.
Detailed Validation Protocol:
- Spatial Resolution:
- Method: Image a USAF 1951 resolution test chart or a sharp-edged phantom. Use a line profile across an edge to calculate the Edge Response Function (ERF). Derive the Line Spread Function (LSF) and compute the Full Width at Half Maximum (FWHM) as resolution.
- Detection Sensitivity & Limit of Detection (LoD):
- Method: Prepare serial dilutions of a reference fluorophore (e.g., IR-12N) in tissue-mimicking phantoms (Intralipid or India ink). Image with standard parameters (laser power, exposure time). The LoD is the concentration yielding a signal-to-noise ratio (SNR) > 3.
- Quantitative Accuracy:
- Method: Image a multi-well phantom containing varying, known concentrations of fluorophore. Plot measured fluorescence intensity vs. known concentration. Report the linearity (R²) and dynamic range (typically 3-4 logs).
Table 2: NIR-II Imaging Device Performance Specifications
| Parameter | Measurement Method | Target Performance (Preclinical) | Impact on Translation |
|---|---|---|---|
| Spatial Resolution | Edge Spread Function / FWHM | < 50 µm for macro; < 20 µm for micro | Determines ability to resolve fine anatomical or pathological features. |
| Temporal Resolution | Frame rate at full FOV | > 5 fps (fluorescent imaging) | Critical for dynamic studies (e.g., cardiology, angiography). |
| Sensitivity (LoD) | Serial dilution in scattering phantom | nM to pM range for bright agents | Defines the minimum detectable tumor burden or biomarker expression. |
| Field of View (FOV) | Measured dimensions | Scalable (e.g., 2 cm x 2 cm for mice) | Must accommodate the relevant animal model anatomy. |
| Co-Registration Accuracy | Imaging of multi-modal phantom | Error < 1 pixel (e.g., < 50 µm) | Essential for correlating NIR-II data with CT/MRI/PA imaging. |
Technical Support & Troubleshooting Center
Frequently Asked Questions (FAQs)
Q1: During in vivo NIR-II imaging, my spatial resolution appears significantly worse than the specifications of my camera. What could be the cause? A: This is a common issue. The benchmark spatial resolution (often sub-50 µm in phantom studies) degrades in vivo due to scattering. First, verify your system's modulation transfer function (MTF) using a USAF 1951 target in a scattering medium (e.g., 1% intralipid). If the phantom test passes, the loss is likely due to insufficient photon flux at the detector. Ensure your laser power is within safe limits and check that your NIR-II probe concentration is adequate. Use a high-sensitivity InGaAs or superconducting nanowire single-photon detector (SNSPD) array for deep tissue imaging.
Q2: My signal-to-noise ratio (SNR) is low, affecting sensitivity benchmarks. How can I improve it? A: Low SNR compromises sensitivity, preventing detection of low-abundance targets. Follow this checklist:
- Probe Check: Confirm the quantum yield (QY) of your fluorophore. Use bright, stable probes like Ag₂S dots or organic dyes with high QY in NIR-IIb (1500-1700 nm).
- Excitation Power: Maximize laser power within the ANSI safety limit for skin exposure (e.g., ~1 W/cm² for 1064 nm).
- Detector Cooling: Ensure your InGaAs detector is cooled to -80°C or lower to reduce dark current noise.
- Spectral Filtering: Use rigorous long-pass filters (e.g., LP1250, LP1400) to block excitation bleed-through and autofluorescence.
- Averaging: Increase frame averaging, but balance with temporal resolution needs.
Q3: How can I accurately measure and validate penetration depth in a live subject? A: Penetration depth is the depth at which the SNR drops to 2. Use a controlled protocol: Implant a capillary tube filled with a standardized concentration of your NIR-II probe (e.g., 100 µM IR-1061) at varying depths (2, 4, 6, 8, 10 mm) in a tissue-mimicking phantom or in a post-mortem mouse model. Image and plot SNR vs. depth. The depth where SNR=2 is your experimental penetration depth. Ensure consistent laser power and detector gain across measurements.
Q4: I'm observing high background signal, which masks my specific signal. How do I troubleshoot this? A: High background usually stems from three sources: 1) Insufficient spectral filtering (see Q2), 2) Probe non-specific uptake, or 3) Autofluorescence from tissues. For (2), optimize your targeting ligand density and include a blocking group. For (3), switch to a longer emission window (NIR-IIb, >1500 nm) where tissue autofluorescence is negligible. Always include an untargeted probe control group.
Q5: My quantitative intensity measurements are not reproducible between sessions. A: Quantification requires rigorous standardization.
- Daily Calibration: Before each session, image a reference phantom with a known concentration of your fluorophore embedded at a fixed depth.
- System Stability: Allow the laser and detector to warm up/stabilize for 30 minutes.
- Uniform Illumination: Use a beam homogenizer to ensure the field of view is evenly illuminated. Correct for inhomogeneity in post-processing using a flat-field reference image.
Quantitative Benchmarks Table
Table 1: Representative Performance Metrics for Common NIR-II Imaging Modalities.
| Imaging Modality / Probe Type | Spatial Resolution (in vivo) | Sensitivity (Detection Limit) | Penetration Depth | Key Advantage |
|---|---|---|---|---|
| NIR-IIa (1000-1400 nm) Organic Dyes | 50-100 µm | ~10 nM | 3-5 mm | Rapid renal clearance, biocompatibility |
| NIR-IIb (1500-1700 nm) Quantum Dots | 20-40 µm | ~1 nM | 6-10 mm | High brightness, photostability |
| NIR-II Spectral Phasor Imaging | 100-200 µm | ~50 nM | 4-7 mm | Unmixing of multiple probes simultaneously |
| NIR-II Confocal Microscopy | <10 µm (superficial) | ~0.1 nM | <1 mm | Cellular/subcellular resolution |
| NIR-II Time-Gated Imaging | 50-150 µm | ~0.5 nM | 5-8 mm | Suppresses short-lived autofluorescence |
Experimental Protocol: Benchmarking Spatial Resolution & Penetration Depth
Objective: To quantitatively measure the spatial resolution and penetration depth of an NIR-II imaging system using a tissue-simulating phantom.
Materials:
- NIR-II imaging system with 1064 nm laser.
- Cooled InGaAs camera with 1400 nm long-pass filter.
- USAF 1951 resolution test chart.
- NIR-II reference fluorophore (e.g., IR-26 dye in DMSO).
- Intralipid 20% stock solution.
- Agarose powder.
- Capillary tubes (1 mm diameter).
- Black anodized aluminum phantom chamber.
Procedure:
- Phantom Preparation: Create a 1% intralipid-1% agarose scattering gel (µs' ≈ 10 cm⁻¹, simulating muscle tissue). Pour into the chamber.
- Resolution Target Embedding: Before the gel sets, submerge the USAF chart at a depth of 1 mm. Allow to solidify.
- Depth Phantom Preparation: In a separate chamber, create the same scattering gel. Horizontally embed capillary tubes filled with 100 µM IR-26 dye at depths of 2, 4, 6, 8, and 10 mm from the surface.
- Image Acquisition (Resolution): Image the USAF target with system settings typical for in vivo imaging (e.g., 50 mW/cm², 100 ms exposure). Determine the smallest distinguishable element group. Calculate line pairs per mm (lp/mm). Resolution (µm) = 1000 / (2 * lp/mm).
- Image Acquisition (Penetration): Image the depth phantom using identical settings. Draw identical ROIs over each capillary tube and on a background region.
- Data Analysis: Calculate SNR for each capillary: SNR = (Signalmean - Backgroundmean) / Background_std. Plot SNR vs. Depth. Fit an exponential decay curve. The penetration depth is defined as the depth where the fitted SNR equals 2.
The Scientist's Toolkit: Research Reagent Solutions
Table 2: Essential Materials for NIR-II Imaging Experiments.
| Item | Function | Example Product / Note |
|---|---|---|
| High-Quality NIR-II Fluorophores | Provides the emission signal in the NIR-II window. Critical for brightness and specificity. | Organic Dyes: IR-1061, CH-4T. Nanoprobes: Ag₂S quantum dots, rare-earth-doped nanoparticles. |
| Targeting Ligands | Conjugates to fluorophores to enable molecular-specific imaging (e.g., of tumors, vasculature). | Antibodies (e.g., anti-VEGF), peptides (cRGD), aptamers. Requires optimized conjugation chemistry. |
| Tissue-Simulating Phantoms | Calibrates system performance and validates metrics (resolution, depth) in a controlled medium. | Intralipid-agarose gels or commercial solid phantoms with calibrated scattering/absorption properties. |
| Spectral Long-Pass Filters | Blocks excitation light and short-wavelength noise, crucial for sensitivity. | Semrock or Thorlabs filters: LP1250, LP1400, LP1500. Use in a filter wheel for spectral imaging. |
| Reference Standards | Enables quantitative intensity calibration and reproducibility between imaging sessions. | Stable, sealed capillaries or wells containing a known concentration of a reference dye (e.g., IR-26). |
| Anesthesia & Physiological Monitoring System | Maintains animal viability and stable physiology during in vivo imaging, affecting pharmacokinetics. | Isoflurane vaporizer with nose cone, heating pad, and ECG/SpO₂ monitor for longitudinal studies. |
Experimental & Analytical Workflow Diagrams
Title: NIR-II Benchmarking Experimental Workflow
Title: Troubleshooting Low SNR or Resolution in NIR-II Imaging
Within the context of advancing clinical translation solutions for NIR-II imaging, understanding its position relative to established clinical imaging modalities is critical. This technical support center addresses common experimental challenges researchers face when validating NIR-II against or in combination with MRI, CT, Ultrasound, and PET, framing them within the broader thesis of overcoming hurdles to clinical adoption.
Troubleshooting Guides & FAQs
Q1: During a multimodal study co-registering NIR-II fluorescence with MRI, we encounter significant spatial misalignment. What are the primary calibration steps? A: This is often due to differences in field-of-view (FOV) and spatial distortion. Implement a phantom-based co-registration protocol.
- Fabricate a dual-modality phantom: Create an agarose phantom (1-2%) containing a network of capillaries filled with both an MRI contrast agent (e.g., Gd-DOTA) and an NIR-II fluorophore (e.g., IRDye 800CW).
- Sequential imaging: Image the phantom under both modalities using identical positioning.
- Landmark identification: Use software (e.g., 3D Slicer, FIJI with plugins) to identify corresponding fiduciary points (capillary intersections) in both image sets.
- Apply transformation matrix: Calculate and apply a rigid or affine transformation matrix to align the NIR-II data to the MRI coordinate system. Validate with a second, distinct phantom.
Q2: Our in vivo NIR-II signal is unexpectedly quenched when imaging a subject previously administered a CT iodinated contrast agent. What is the mechanism? A: This suggests a chemical interaction or energy transfer. Iodinated contrast agents (e.g., Iohexol) can cause collisional quenching or inner-filter effects if the fluorophore and agent are in close proximity. Protocol to diagnose:
- Perform an in vitro titration experiment. Prepare serial dilutions of your NIR-II probe in PBS.
- Add increasing concentrations of the CT contrast agent to each dilution.
- Measure fluorescence intensity (NIR-II spectrum) and UV-Vis absorption immediately.
- Analysis: A drop in fluorescence without a change in the probe's absorption spectrum indicates dynamic (collisional) quenching. A drop in fluorescence accompanied by a new absorption band suggests static quenching (complex formation).
Q3: When comparing tumor vascular imaging depth between NIR-II and clinical ultrasound, our depth penetration claims for NIR-II are contested. How do we design a fair comparative experiment? A: Depth performance is highly dependent on tissue type and probe parameters.
- Use a tissue-mimicking phantom: Create a layered phantom with skin, fat, and muscle-mimicking layers (using lipid/fat powders and india ink for optical scattering/absorption) of known thickness (e.g., 2mm, 5mm, 10mm).
- Embed targets: Place a micro-vessel mimic (a capillary tube) filled with blood or an absorbing dye at varying depths.
- Standardized imaging:
- NIR-II: Use a standardized laser power (e.g., 100 mW/cm²) and integration time. Measure Signal-to-Background Ratio (SBR) vs. depth.
- Ultrasound: Use a standard clinical high-frequency linear array probe (e.g., 15 MHz). Use the same phantom. Measure contrast-to-noise ratio (CNR) vs. depth.
- Quantitative Table: Present data as below.
Q4: In a theranostics study combining a PET tracer and an NIR-II dye, we observe altered biodistribution for the conjugated agent versus the separate entities. How do we troubleshoot this? A: Conjugation chemistry can drastically alter pharmacokinetics.
- Control Experiment: Synthesize and characterize three agents separately:
- Agent A: PET tracer alone.
- Agent B: NIR-II dye alone.
- Agent C: Conjugated molecule (PET tracer + NIR-II dye + linker).
- Perform longitudinal PK/PD: Administer each agent to separate animal cohorts (n=5). Collect blood at multiple time points (e.g., 5min, 1h, 4h, 24h). Measure radioactivity (PET tracer) and fluorescence (NIR-II) in plasma. Harvest major organs at endpoint for ex vivo gamma counting and fluorescence imaging.
- Analysis: Compare blood clearance curves and organ uptake ratios (tumor-to-muscle, tumor-to-liver) for both signals from Agent C, and against the controls (A & B). A mismatch between the radioactive and fluorescent signals in Agent C indicates in vivo instability or metabolite generation.
Data Presentation: Modality Comparison
Table 1: Quantitative Comparison of Key Imaging Modalities
| Parameter | NIR-II Fluorescence | MRI | CT | Ultrasound | PET |
|---|---|---|---|---|---|
| Spatial Resolution | 20-50 µm | 50-500 µm | 50-200 µm | 50-500 µm | 1-2 mm |
| Imaging Depth | 1-3 cm (in tissue) | No limit | No limit | 5-20 cm | No limit |
| Temporal Resolution | < 1 sec to min | min to hours | < 1 sec | msec to sec | min to hours |
| Primary Contrast Mechanism | Fluorophore targeting, perfusion | Proton density, T1/T2 relaxation | Electron density/X-ray attenuation | Acoustic impedance | Radionuclide (e.g., ¹⁸F) uptake |
| Key Quantitative Metric | Signal-to-Background Ratio (SBR) | Relaxation times (T1, T2) | Hounsfield Units (HU) | Contrast-to-Noise Ratio (CNR) | Standardized Uptake Value (SUV) |
| Ionizing Radiation | No | No | Yes | No | Yes |
| Relative Cost per Scan | Low | High | Medium | Low | Very High |
Table 2: Clinical Niches and Complementary Use Cases
| Clinical Need | Primary Modality | Complementary NIR-II Role | Rationale |
|---|---|---|---|
| Intraoperative Tumor Margin Delineation | MRI (pre-op) | Real-time visual guidance of resection boundaries | High resolution, real-time feedback vs. pre-operative map. |
| Lymph Node Mapping | CT (anatomy) | Sentinel node identification with real-time fluorescence | Functional drainage mapping vs. anatomical sizing. |
| Cardiovascular Perfusion | Ultrasound (Doppler) | Microvascular perfusion and permeability quantification | Higher resolution for capillary-level flow vs. larger vessel dynamics. |
| Oncology Therapy Response | PET (metabolic activity) | Longitudinal monitoring of targeted drug delivery and cell death | Lower cost, higher frequency imaging of specific pathways vs. whole-body metabolism. |
| Inflammatory Bowel Disease | MRI/CT (anatomy, wall thickening) | Molecular imaging of immune cell infiltration (e.g., macrophages) | Specific molecular vs. nonspecific anatomical inflammation. |
Experimental Protocol: Validating NIR-II vs. Ultrasound for Vascular Imaging
Title: Comparative Vasculature Imaging Depth Protocol
Objective: To quantitatively compare the maximum usable imaging depth and resolution of NIR-II fluorescence angiography versus high-frequency ultrasound for microvasculature in a tissue-mimicking environment.
Materials:
- NIR-II Imaging System (e.g., InGaAs camera, 1064 nm laser)
- Clinical Ultrasound System with 15-18 MHz linear probe
- Tissue-mimicking phantom (see Q3)
- Indocyanine Green (ICG) or IR-12 NIR-II fluorophore
- Micro-capillary tubing (100-200 µm diameter)
- Syringe pump
Procedure:
- Phantom Preparation: Construct a phantom with optical and acoustic properties matching human soft tissue. Embed capillary tubes at known depths (2, 4, 6, 8, 10 mm).
- Agent Administration (Simulation): For NIR-II, fill capillaries with 100 µM ICG solution. For ultrasound, flow a dilute blood-mimicking fluid (with scatterers) using the syringe pump at 1 mL/min.
- NIR-II Imaging:
- Set laser to 1064 nm at 100 mW/cm².
- Acquire images with increasing exposure times (50 ms to 1000 ms).
- Acquire a background image (capillary filled with saline).
- Ultrasound Imaging:
- Apply standard ultrasound gel.
- Use B-mode and Color Doppler settings optimized for small vessels.
- Record cine loops.
- Analysis:
- For each depth and modality, calculate the primary metric (SBR for NIR-II, CNR for Ultrasound).
- Define the "detection limit" as the depth where SBR > 2.0 or CNR > 1.5.
- Plot metric vs. depth for both modalities on the same graph.
Diagrams
Diagram 1: Multimodal Co-registration Workflow for NIR-II and MRI
Diagram 2: Mechanism of Contrast Agent Interference with NIR-II Signal
The Scientist's Toolkit: Research Reagent Solutions
| Item | Function in NIR-II/Clinical Modality Studies |
|---|---|
| IRDye 800CW / IR-12 | Common, commercially available NIR-II fluorophores for proof-of-concept targeting and angiography studies. |
| PEGylated Liposomes | Versatile nanoparticle platform for co-loading NIR-II dyes, MRI contrast agents (Gd), and drugs for theranostic studies. |
| Matrigel / Tumor Cell Lines | For creating reproducible subcutaneous tumor xenografts in mice to validate oncology applications. |
| ICG (Indocyanine Green) | FDA-approved NIR-I/II dye used as a benchmark for translational vascular and perfusion imaging. |
| DOTA-NHS Ester | Chelator for stably conjugating lanthanides (e.g., for PET: ⁶⁸Ga, ⁶⁴Cu; for MRI: Gd) to targeting biomolecules. |
| Tissue-Mimicking Phantoms (e.g., Intralipid, India Ink, Agarose) | Essential for standardized calibration, depth testing, and co-registration across imaging modalities. |
| 3D Slicer / FIJI-ImageJ | Open-source software platforms with plugins for advanced image processing, analysis, and multi-modal co-registration. |
| High-Frequency Ultrasound System (e.g., Vevo) | Preclinical benchmark for real-time anatomical and hemodynamic comparison against NIR-II functional data. |
Technical Support Center: Troubleshooting Guides & FAQs
FAQ & Troubleshooting Guide
Q1: In our in vivo imaging experiment, the NIR-I signal appears saturated or bleaches rapidly, while the NIR-II signal is very dim. What could be the issue? A: This is a common equipment mismatch problem. NIR-I systems typically use Silicon (Si) CCD detectors, which are insensitive to light beyond ~950 nm. NIR-II imaging requires Indium Gallium Arsenide (InGaAs) or Cooled InGaAs detectors.
- Troubleshooting Steps:
- Verify Detector: Confirm your imaging system is equipped with an InGaAs detector for NIR-II.
- Check Excitation Filter: Ensure your laser/excitation source is appropriate for your fluorophore (e.g., 808 nm laser for an 808 nm-excitable NIR-II probe).
- Adjust Acquisition Settings: Drastically increase the exposure time (e.g., from 100 ms to 1-5 seconds) for NIR-II as signals are inherently weaker but with lower background.
- Confirm Probe Integrity: Validate that your NIR-II probe has not aggregated or degraded.
Q2: We observe high background autofluorescence in the NIR-I window during tumor imaging, obscuring the target. How does switching to NIR-II mitigate this? A: This is a fundamental optical advantage of NIR-II. Biological tissues (e.g., skin, fat, hemoglobin) have significantly reduced scattering and autofluorescence in the 1000-1700 nm range.
- Troubleshooting/Protocol Enhancement:
- Apply Spectral Unmixing (for NIR-I): If you must use NIR-I, employ a multispectral imaging protocol to separate the probe signal from autofluorescence. This requires a reference autofluorescence spectrum from an untreated animal.
- Switch to NIR-II Probe: Follow the experimental protocol below for a direct comparison.
- Protocol: Direct Comparison of Background:
- Inject the same tumor-bearing mouse model with either an NIR-I dye (e.g., ICG, ~800 nm emission) or an NIR-II dye (e.g., IRDye 800CW, ~1000 nm emission peak).
- Image Acquisition: Under identical anesthesia and positioning, acquire images first in the NIR-I channel (800-900 nm filter), then in the NIR-II channel (1000-1400 nm LP filter) using an InGaAs camera.
- Analysis: Calculate the Tumor-to-Background Ratio (TBR) for both images. The NIR-II image will consistently show a 2-5x higher TBR due to suppressed background.
- Protocol: Direct Comparison of Background:
Q3: Our NIR-II image resolution seems poorer than expected. What factors affect resolution in vivo? A: While NIR-II offers superior theoretical resolution due to reduced scattering, practical issues can degrade it.
- Troubleshooting Checklist:
- Focus Plane: The focal plane for NIR-II is deeper than for NIR-I. Use software-assisted auto-focus or manually refine focus at the target depth.
- Probe Brightness: Low quantum yield probes produce noisy images. Increase dose or exposure time cautiously, or switch to a brighter probe (e.g., quantum dots, single-walled carbon nanotubes).
- Wavelength Selection: Image in the longer, "NIR-IIb" sub-window (1500-1700 nm) for even less scattering. Use a corresponding long-pass filter (e.g., 1500 nm LP).
- Motion Artifact: Ensure stable, deep anesthesia to prevent breathing artifacts during longer exposures.
Q4: What are the key safety and regulatory concerns for translating NIR-II probes compared to NIR-I? A: This is a core thesis challenge. While NIR-I dyes like ICG have FDA approval, most NIR-II probes are inorganic or organic polymers with unknown long-term biodistribution and toxicity.
- Troubleshooting for Translational Research:
- Material Choice: Prioritize developing or using biodegradable organic NIR-II dyes over heavy-metal quantum dots or non-degradable carbon nanotubes.
- Comprehensive Toxicology Protocol:
- Conduct full biodistribution studies (quantify % injected dose/g in organs over 1-90 days).
- Perform hematology and serum biochemistry panels at multiple time points.
- Histopathological analysis of major organs after extended periods.
- Sterilization & Formulation: Ensure probe stability and sterility after autoclaving or gamma irradiation, which is required for clinical use.
Data Presentation: Quantitative Comparison
Table 1: Direct Performance Comparison of NIR-I vs. NIR-II Windows
| Parameter | NIR-I (700-900 nm) | NIR-II (1000-1700 nm) | Implication for Imaging |
|---|---|---|---|
| Tissue Scattering | High | 3-10x Lower | NIR-II enables higher spatial resolution at depth. |
| Autofluorescence | Significant (from tissues) | Negligible (>1000 nm) | NIR-II provides superior Tumor-to-Background Ratio (TBR). |
| Absorption by Water | Low | Moderate, peaks ~1450 nm | Imaging in NIR-IIa (1000-1400 nm) avoids water absorption. |
| Typical Penetration Depth | 1-3 mm | 5-10 mm | NIR-II allows imaging of deeper anatomical structures. |
| Detector Requirement | Silicon CCD | InGaAs (Cooled/Uncooled) | NIR-II requires specialized, often more expensive, hardware. |
| FDA-Approved Dyes | ICG, Methylene Blue | None (as of 2023) | Major hurdle for clinical translation of NIR-II. |
Table 2: Example Probe Comparison in a Murine Tumor Model
| Probe | Emission Peak (nm) | Imaging Window | Measured TBR* | Optimal Dose (nmol) | Key Advantage | Key Disadvantage |
|---|---|---|---|---|---|---|
| ICG | ~820 nm | NIR-I | 2.1 ± 0.3 | 5.0 | FDA-approved, rapid clearance | Low brightness, bleaches fast |
| IRDye 800CW | ~800 nm | NIR-I | 2.8 ± 0.4 | 0.5 | Bright, commercial antibodies | High background autofluorescence |
| CH1055-PEG | ~1055 nm | NIR-II | 5.7 ± 0.9 | 0.1 | High TBR, organic polymer | Complex synthesis, batch variance |
| Ag2S QD | ~1200 nm | NIR-II | 8.2 ± 1.2 | 0.05 | Very bright, photostable | Potential long-term toxicity (heavy metal) |
*Tumor-to-Background Ratio at 24h post-injection. Data compiled from recent literature.
Experimental Protocols
Protocol 1: Direct Side-by-Side In Vivo Comparison of NIR-I and NIR-II Imaging Objective: To quantitatively compare penetration depth and signal-to-background ratio.
- Animal Model: Prepare a mouse with a subcutaneously implanted tumor (~5-8 mm diameter).
- Probe Administration: Inject via tail vein with a dual-emission probe (e.g., one that emits at both ~820 nm and ~1050 nm) or co-inject characterized NIR-I and NIR-II probes at matched doses.
- Imaging Setup: Use a multiplexed imaging system equipped with both a Si CCD and an InGaAs camera. Standardize laser power (e.g., 808 nm, 10 mW/cm²) and field of view.
- Image Acquisition (Timeline):
- t = 0 min (Pre-injection): Acquire background images in both channels.
- t = 1, 5, 10, 30, 60, 120 min, 24h: Anesthetize mouse, acquire sequential NIR-I and NIR-II images using standardized exposures (e.g., 100 ms for NIR-I, 1000 ms for NIR-II).
- Analysis: For each time point, draw regions of interest (ROIs) over the tumor and a contralateral background tissue area. Calculate TBR = (Mean Tumor Signal) / (Mean Background Signal). Plot TBR vs. Time for both windows.
Protocol 2: Evaluating Resolution via Tissue Phantom Imaging Objective: To measure spatial resolution degradation through scattering media.
- Phantom Preparation: Create a 1% Intralipid solution in agarose (simulating tissue scattering). Prepare capillary tubes filled with NIR-I dye or NIR-II dye.
- Embedding: Bury the capillaries at varying depths (0, 2, 4, 6 mm) within the solidified phantom.
- Imaging: Image the phantom from the top surface using both NIR-I and NIR-II settings.
- Analysis: Use the line profile tool across each capillary image. Calculate the Full Width at Half Maximum (FWHM) of the intensity peak. Plot FWHM vs. Depth for both imaging windows to demonstrate resolution preservation in NIR-II.
Mandatory Visualization
Diagram 1: NIR-I vs NIR-II Light-Tissue Interaction
Diagram 2: NIR-II Probe Development & Translation Workflow
The Scientist's Toolkit: Key Research Reagent Solutions
Table 3: Essential Materials for NIR-II Imaging Research
| Item | Category | Function & Rationale |
|---|---|---|
| InGaAs Camera (Cooled) | Hardware | Essential detector for capturing light >1000 nm. Cooling reduces dark noise for long exposures. |
| 808 nm Laser Diode | Hardware | Common excitation source for many NIR-I and NIR-II fluorophores, minimizes tissue heating. |
| Long-Pass Filters (e.g., 1000LP, 1250LP) | Hardware | Blocks excitation and shorter wavelength light, allowing only NIR-II emission to reach the detector. |
| IRDye 800CW / ICG | NIR-I Probe | Benchmark NIR-I dyes for direct performance comparison and system calibration. |
| CH1055-PEG or similar | Organic NIR-II Probe | Representative bright, small-molecule organic NIR-II fluorophore for proof-of-concept studies. |
| PBS (pH 7.4) | Buffer | Standard vehicle for probe dissolution and dilution for in vivo injection. |
| Matrigel | Reagent | For preparing subcutaneous tumor models to evaluate probe accumulation. |
| Isoflurane/Oxygen System | Animal Research | Provides stable anesthesia for longitudinal imaging sessions, critical for minimizing motion artifacts. |
| Spectral Imaging Software | Software | Enables unmixing of multiplexed signals and separation of probe signal from autofluorescence (crucial for NIR-I). |
Troubleshooting Guides and FAQs for NIR-II Imaging in Preclinical Studies
This support center addresses common technical challenges encountered during preclinical NIR-II imaging experiments, framed within the broader research goal of overcoming barriers to clinical translation.
FAQ: Common NIR-II Imaging Issues
Q1: My NIR-II probe shows weak or no fluorescence signal in my murine tumor model. What could be wrong? A: This is often due to poor probe pharmacokinetics or quenching. First, verify probe integrity via absorbance/NIR-II fluorescence spectrometry. Ensure the injection dose (typically 2-5 mg/kg for nanoparticles) is correct. Check the imaging system's laser power and detector sensitivity. Confirm that your anesthesia (e.g., isoflurane) does not affect hemodynamics, as this can alter enhanced permeability and retention (EPR) effects critical for tumor accumulation.
Q2: I observe high background signal in neurological imaging, obscuring vasculature details. How can I improve contrast? A: High background often stems from incomplete blood-brain barrier (BBB) penetration for non-targeted probes or scattering. For vascular imaging, use a high-performance probe like CH1055-PEG (or modern variants) with a high quantum yield. Ensure rapid imaging post-injection (<5 mins) for first-pass angiography. For parenchymal imaging, confirm your probe is BBB-penetrant or use a model with BBB disruption. Adjust excitation/emission filters to minimize autofluorescence.
Q3: During dynamic contrast-enhanced (DCE) imaging for vascular quantification, my kinetics data is noisy. How to optimize? A: Noisy kinetics data arises from low frame rates or low signal-to-noise ratio (SNR). Increase probe concentration slightly (ensure no toxicity) and use a higher laser power within safe limits. Optimize binning on your InGaAs camera. Standardize animal physiology (temperature, heart rate). Use a tail vein catheter for consistent, rapid bolus injection. Ensure consistent region-of-interest (ROI) placement.
Q4: My targeted NIR-II probe for atherosclerosis shows non-specific liver/spleen uptake, masking plaque signal. A: This indicates reticuloendothelial system (RES) sequestration, common with nanoparticles. Introduce a denser PEGylation layer (e.g., increase from PEG2000 to PEG5000) to improve "stealth" properties. Consider using smaller molecular weight probes (<20 kDa). Administer a blocking dose of non-targeted nanoparticle 30 minutes prior to the targeted probe to saturate RES uptake.
Detailed Experimental Protocols
Protocol 1: NIR-II Imaging for Orthotopic Glioma Targeting Validation Objective: To evaluate the specificity and penetration of a BBB-crossing, glioma-targeted NIR-II probe.
- Model Induction: Implant U87MG-luc cells (2x10^5 in 3 µL PBS) into nude mouse brain (stereotactic coordinates: 2mm anterior, 1.5mm lateral to bregma, 3mm depth).
- Probe Administration: At day 14 post-implantation, inject targeted probe (e.g., cRGD-CH1055, 200 µL of 100 µM solution) via tail vein. Include a group injected with non-targeted control probe.
- Imaging Setup: Anesthetize mouse (2% isoflurane). Place in NIR-II imaging system (e.g., Princeton Instruments InGaAs camera, 1064 nm laser, 1300 nm long-pass filter).
- Image Acquisition: Acquire baseline image pre-injection. Image continuously for 5 minutes post-injection, then at 1, 2, 4, 8, and 24 hours. Use consistent parameters: laser power 100 mW/cm², exposure 200 ms.
- Ex Vivo Validation: Sacrifice animal at 24h, harvest brain and major organs. Image ex vivo. Perform immunohistochemistry on brain sections (e.g., CD31, GFAP) for correlation.
- Data Analysis: Draw ROIs over tumor (via bioluminescence coregistration) and contralateral brain. Calculate tumor-to-background ratio (TBR).
Protocol 2: DCE-NIR-II for Hindlimb Ischemia Perfusion Quantification Objective: To quantify blood perfusion recovery in a murine hindlimb ischemia model.
- Model Surgery: Induce unilateral hindlimb ischemia in C57BL/6 mouse by ligating and excising the left femoral artery. Confirm ischemia via laser Doppler pre-imaging.
- Probe & Imaging: At day 0, 7, and 14 post-surgery, inject 150 µL of IRDye 800CW (or Ag2S quantum dots) via tail vein catheter for rapid bolus.
- Dynamic Imaging: Initiate high-speed imaging (5 frames/sec) 5 seconds before injection. Continue for 2 minutes.
- Kinetic Analysis: Generate time-intensity curves for ischemic and non-ischemic limbs. Calculate key perfusion parameters: Peak Signal Intensity (PSI), Time-To-Peak (TTP), and Relative Blood Flow (RBF) ratio (ischemic/non-ischemic).
Table 1: NIR-II Probe Performance in Oncology Models
| Probe Name | Model (Cell Line) | Target | TBR (Tumor/Muscle) at 24h | Key Advantage | Reference Year |
|---|---|---|---|---|---|
| CH1055-PEG | U87MG (s.c.) | Passive (EPR) | ~5.2 | High quantum yield | 2016 |
| cRGD-CH1055 | U87MG (orthotopic) | αvβ3 Integrin | ~8.5 | Active targeting, BBB penetration | 2019 |
| Ag2S QDs-PEG | 4T1 (s.c.) | Passive | ~12.1 | High brightness, photostability | 2023 |
| NIR-IIb Antibody Conjugate | CT26 (s.c.) | PD-L1 | ~15.3 | Immune-targeted, >1500 nm emission | 2024 |
Table 2: Vascular Imaging Performance Metrics
| Application | Model | Probe | Key Metric | Reported Value | Ideal for Clinical Translation? |
|---|---|---|---|---|---|
| Angiography | C57BL/6 Mouse | SWCNTs-PEG | Vessel-to-Tissue Contrast Ratio | > 8 | Yes (deep penetration) |
| Perfusion Quantification | Hindlimb Ischemia | IRDye 800CW | Relative Blood Flow Accuracy | ±5% vs. Doppler | Limited by 800 nm scattering |
| Atherosclerosis | ApoE-/- Mouse (HFD) | Anti-ICAM-1 NPs | Plaque Detection Sensitivity | 92% (vs. histology) | Promising (specific) |
| Stroke | tMCAO Mouse | Lipo-ICG | Penumbra Delineation Time | < 1 min post-inj. | Critical for rapid diagnosis |
Table 3: Neurological Application Benchmarks
| Application | Primary Challenge | Exemplary Probe | Spatial Resolution Achieved | Imaging Depth | Clinical Translation Hurdle |
|---|---|---|---|---|---|
| Whole-Brain Angiography | Skull Scattering | FD1080 (Organic Dye) | ~40 µm | > 3 mm (through skull) | Scalable synthesis |
| Tumor Resection Guidance | Tumor Margin Definition | IR-E-2P | ~25 µm (intraoperative) | Surface | Regulatory approval for dyes |
| Neural Activity | Temporal Resolution | Ca2+ Sensors (NIR-II) | Single-cell | ~1 mm | Biocompatibility long-term |
| Neuroinflammation | Specificity to Microglia | Anti-TMEM119 Dye | N/A | N/A | Human antibody cross-reactivity |
Pathway and Workflow Diagrams
Title: NIR-II Probe Delivery Pathways for Oncology
Title: Preclinical NIR-II Imaging Validation Workflow
The Scientist's Toolkit: Key Research Reagent Solutions
| Item Name | Function & Role in NIR-II Experiments | Key Consideration for Clinical Translation |
|---|---|---|
| IRDye 800CW NHS Ester | Small molecule dye for antibody/protein conjugation. Enables targeted imaging. | FDA-approved for some indications; well-characterized safety. |
| PEGylated Ag2S Quantum Dots | High quantum yield NIR-II emitters for deep-tissue angiography and tumor imaging. | Long-term toxicity and biodegradability studies are ongoing. |
| cRGD Peptide (cyclic Arg-Gly-Asp) | Targeting ligand for conjugating to probes to image αvβ3 integrin (tumor angiogenesis). | Human specificity and immunogenicity need verification. |
| Matrigel | Basement membrane matrix for preparing cell suspensions for orthotopic/subcutaneous tumors. | Animal-derived; variability between lots can affect reproducibility. |
| Isoflurane Anesthesia System | Maintains stable animal physiology (heart rate, temp) during longitudinal imaging. | Standardized protocols are critical for reproducible pharmacokinetics data. |
| Tail Vein Catheter (28G) | Enables rapid, consistent bolus injection for dynamic contrast-enhanced (DCE) studies. | Minimizes injection variability, a key factor for quantitative data. |
| NIR-II Calibration Phantom | Contains channels with known dye concentrations for signal intensity standardization. | Essential for inter-study and inter-site comparison of quantitative data. |
| Collagenase IV | Digests tissues for ex vivo analysis of probe distribution in organs via fluorescence. | Digestion conditions must be optimized to avoid quenching probe signal. |
Conclusion
The clinical translation of NIR-II imaging hinges on a coordinated, multidisciplinary effort to overcome material, instrumental, and regulatory challenges. As outlined, progress requires advances in biocompatible probe design, robust and accessible hardware, and standardized, quantitative protocols. While NIR-II will not replace all existing modalities, its unparalleled resolution and penetration at depth position it as a transformative tool for real-time, high-fidelity visualization in surgery, endoscopic procedures, and dynamic therapy monitoring. For drug developers, it offers a powerful preclinical and potential clinical tool for pharmacokinetic and pharmacodynamic studies. Future directions must focus on large-scale safety studies, manufacturing under Good Manufacturing Practice (GMP), and the execution of robust clinical trials to definitively establish diagnostic efficacy and therapeutic impact. By systematically addressing the outlined challenges, the biomedical community can unlock the full potential of NIR-II imaging to improve patient diagnosis, treatment, and outcomes.