Complete Guide to NIR-II Fluorescence Imaging Systems for Small Animal Preclinical Research
This comprehensive guide provides researchers, scientists, and drug development professionals with an in-depth exploration of second-window near-infrared (NIR-II) fluorescence imaging systems for small animals.
Complete Guide to NIR-II Fluorescence Imaging Systems for Small Animal Preclinical Research
Abstract
This comprehensive guide provides researchers, scientists, and drug development professionals with an in-depth exploration of second-window near-infrared (NIR-II) fluorescence imaging systems for small animals. The article covers foundational principles and system components, detailed methodological protocols for in vivo studies, essential troubleshooting and optimization strategies to enhance signal-to-noise ratio and penetration depth, and validation techniques comparing NIR-II to traditional imaging modalities. The guide synthesizes current best practices to enable high-fidelity, deep-tissue biological imaging for applications in oncology, neurology, and inflammation research.
NIR-II Imaging Fundamentals: Principles, Advantages, and Core System Components Explained
What is NIR-II Imaging? Defining the 1000-1700 nm Spectral Window
NIR-II imaging refers to fluorescence imaging performed in the second near-infrared spectral window, approximately 1000 to 1700 nm. This technique offers superior performance compared to traditional NIR-I (700-900 nm) and visible light imaging for in vivo applications, due to significantly reduced scattering of photons by biological tissues, lower autofluorescence, and deeper penetration. These attributes make it an indispensable tool for high-resolution, real-time visualization of anatomical, physiological, and molecular processes in small animal models, which is central to a thesis focused on developing an advanced NIR-II fluorescence imaging system.
Fundamentals and Advantages
Photons in the NIR-II window interact less with biological components like water, lipids, and hemoglobin, leading to minimized scattering and absorption. This results in:
- Enhanced Spatial Resolution: Scattering reduction allows for sharper, more defined images at depth.
- Increased Penetration Depth: Enables visualization of structures several centimeters deep, suitable for whole-body mouse imaging.
- High Signal-to-Background Ratio (SBR): Dramatically reduced tissue autofluorescence in this window yields images with exceptional contrast.
The performance metrics for different spectral windows are summarized below.
Table 1: Comparison of Fluorescence Imaging Spectral Windows
| Parameter | Visible (400-700 nm) | NIR-I (700-900 nm) | NIR-II (1000-1700 nm) |
|---|---|---|---|
| Tissue Scattering | Very High | High | Low |
| Autofluorescence | Very High | Moderate | Very Low |
| Penetration Depth | Shallow (< 1 mm) | Moderate (1-3 mm) | Deep (5-10 mm+) |
| Typical Resolution at 3mm Depth | > 5.0 µm | ~2.5 µm | < 1.5 µm |
| Optimal SBR | Low | Moderate | High |
Key Research Reagent Solutions
The efficacy of NIR-II imaging is contingent on the availability of high-performance contrast agents. The following table lists essential materials.
Table 2: NIR-II Research Reagent Toolkit
| Reagent / Material | Key Function & Explanation |
|---|---|
| Single-Walled Carbon Nanotubes (SWCNTs) | Semiconducting carbon nanotubes with tunable emission in the NIR-IIb (1500-1700 nm) region. Used for vascular imaging and tumor targeting due to high photostability. |
| Rare-Earth-Doped Nanoparticles (RENPs) | Down-converting nanocrystals (e.g., NaYF4:Yb,Er/Ce) that emit in NIR-II upon NIR excitation. Ideal for multiplexed imaging and deep-tissue sensing. |
| Organic Dye Molecules (e.g., IR-1061, CH-4T) | Small-molecule fluorophores with defined chemical structures. Suitable for rapid pharmacokinetic studies and clinical translation potential. |
| Quantum Dots (PbS/CdS QDs) | Inorganic nanoparticles with bright, narrow emission. Used for high-resolution lymphatic and tumor imaging. |
| Targeting Ligands (Peptides, Antibodies) | Conjugated to NIR-II probes to achieve molecular specificity (e.g., targeting RGD peptides for angiogenesis). |
| Indocyanine Green (ICG) | FDA-approved dye with tail emission in NIR-II. Serves as a benchmark for vascular flow imaging and surgery guidance. |
Experimental Protocols
Protocol 1: NIR-IIIn VivoVascular Imaging and Tumor Targeting
This protocol details a standard procedure for non-invasive angiography and tumor visualization in mice using a targeted NIR-II probe.
Materials:
- NIR-II imaging system (InGaAs or HgCdTe camera, 1064 nm or 808 nm laser).
- Athymic nude mouse with subcutaneously implanted tumor (e.g., U87MG).
- Targeted NIR-II probe (e.g., RGD-conjugated SWCNTs or Ag2S QDs).
- Isoflurane anesthesia system.
- Heating pad.
- Sterile PBS.
Methodology:
- System Calibration: Power on the NIR-II imaging system and allow the camera to cool to operating temperature (-80°C). Calibrate using a reference phantom with known fluorescence intensity.
- Animal Preparation: Anesthetize the mouse using 2% isoflurane in oxygen. Secure the mouse in a supine position on a heated imaging stage to maintain body temperature. Apply ophthalmic ointment.
- Baseline Imaging: Acquire a pre-injection image using appropriate excitation/emission filters (e.g., 1064 nm ex / 1300 nm long-pass em). Set exposure time to 100-500 ms.
- Probe Administration: Intravenously inject 200 µL of the targeted NIR-II probe (e.g., 100 µM in PBS) via the tail vein.
- Kinetic Imaging: Acquire time-series images immediately post-injection (e.g., every 5 seconds for 5 minutes) to capture the vascular flow phase.
- Static Imaging: Capture high-resolution images at 1, 2, 4, 8, and 24 hours post-injection to monitor probe accumulation in the tumor via the enhanced permeability and retention (EPR) effect and active targeting.
- Image Analysis: Use software (e.g., ImageJ, Living Image) to quantify fluorescence intensity in the tumor region (ROIT) and a contralateral muscle region (ROIM). Calculate the Target-to-Background Ratio (TBR) as Mean Intensity(ROIT) / Mean Intensity(ROIM).
- Histology Validation: Euthanize the animal, excise the tumor and major organs. Perform fluorescence microscopy on cryosections to validate probe distribution ex vivo.
Protocol 2: Quantifying Key Performance Metrics: Resolution and SBR
This protocol outlines methods to characterize the core advantages of NIR-II imaging using phantom and in vivo models.
Materials:
- NIR-II imaging system.
- Capillary tube phantom (filled with IR-26 dye).
- Black tubing or thin suture.
- Mouse model.
Methodology for Resolution Measurement:
- Prepare a phantom by sealing a dilute NIR-II dye (e.g., IR-26) in a glass capillary tube with an inner diameter of ~150 µm.
- Immerse the capillary in a scattering medium (e.g., 1% intralipid).
- Image the capillary at increasing depths (0-5 mm) beneath the scattering surface.
- Plot the measured Full Width at Half Maximum (FWHM) of the capillary line profile against depth. Compare with identical measurements performed using an NIR-I dye (e.g., ICG) to demonstrate superior resolution preservation in NIR-II.
Methodology for SBR Measurement:
- Image an anesthetized mouse injected with a non-targeted NIR-II probe (e.g., SWCNTs) after circulatory clearance (e.g., 48h post-injection).
- Draw an ROI over a vessel and an adjacent tissue region of the same area.
- Calculate SBR = (Mean Signalvessel – Mean Signaltissue) / Standard Deviation_tissue.
- Repeat the process in the same animal using an NIR-I probe (e.g., Cy5.5) to demonstrate the higher achievable SBR in the NIR-II window.
Visualization of Core Concepts
NIR-II Imaging Workflow from Excitation to Output
Why NIR-II Light Provides Superior Tissue Imaging
NIR-II (1000-1700 nm) fluorescence imaging offers significant physical advantages over visible (400-700 nm) and NIR-I (700-900 nm) imaging, primarily due to reduced scattering and absorption by biological tissues. The following tables summarize the key quantitative differences.
Table 1: Optical Properties of Biological Tissues Across Spectral Windows
| Spectral Window | Wavelength Range (nm) | Reduced Scattering Coefficient (μs') [cm⁻¹] * | Absorption Coefficient (μa) [cm⁻¹] * | Penetration Depth (Approx.) | Autofluorescence Level |
|---|---|---|---|---|---|
| Visible | 400 - 700 | High (50 - 200) | High (Hb, HbO₂) | Shallow (< 1 mm) | Very High |
| NIR-I | 700 - 900 | Moderate (10 - 50) | Low (Optical Window) | Moderate (1 - 3 mm) | Low |
| NIR-II | 1000 - 1700 | Very Low (5 - 20) | Very Low (Water ↑ >1400nm) | Deep (3 - 10 mm) | Negligible |
Representative values for soft tissue; μs' decreases with increasing wavelength (≈ λ ^ -α).
Table 2: Performance Metrics Comparison in Murine Imaging
| Imaging Metric | Visible Imaging | NIR-I Imaging (e.g., 800 nm) | NIR-II Imaging (e.g., 1300 nm) | Improvement Factor (NIR-II vs. NIR-I) |
|---|---|---|---|---|
| Spatial Resolution at 3 mm depth | > 5.0 mm | ~ 1.5 - 2.0 mm | < 0.5 mm | 3-4x |
| Signal-to-Background Ratio (SBR) | Low (< 2) | Moderate (5-10) | High (10-50+) | 2-10x |
| Maximum Imaging Depth | ~ 1 mm | ~ 3 mm | 5 - 10 mm | ~2-3x |
Application Notes: Exploiting Deeper Penetration & Reduced Scattering
High-Resolution Vascular Imaging
The reduced scattering in NIR-II enables clear visualization of capillary-level vasculature non-invasively. This is critical for monitoring tumor angiogenesis, cerebrovascular flow, and peripheral artery disease models with unparalleled clarity compared to NIR-I.
Deep-Tissue Tumor Detection & Lymph Node Mapping
NIR-II probes can identify < 1 mm metastatic lesions deep within tissue (>5mm), enabling precise image-guided resection. Sentinel lymph nodes can be visualized with high contrast, reducing surgical morbidity.
Real-Time Dynamic Imaging
The high temporal resolution and SBR allow for monitoring of fast physiological processes, such as cardiac cycle dynamics through the chest wall and pharmacokinetics of drug delivery in deep organs.
Experimental Protocols
Protocol 1: In Vivo NIR-II Imaging of Mouse Brain Vasculature
Objective: To achieve high-resolution, deep-penetration imaging of the cerebral vasculature through the intact skull. Materials: See "Scientist's Toolkit" below. Procedure:
- Animal Preparation: Anesthetize a hairless mouse (e.g., SKH1) or remove head hair from a standard strain (C57BL/6). Secure in a stereotaxic frame on a heating pad.
- Probe Administration: Intravenously inject 200 µL of ICG (for 800 nm imaging) or 200 µL of IRDye 800CW (for 900 nm imaging) or 200 µL of a NIR-II fluorophore (e.g., Ag2S quantum dots, 1 mg/mL in PBS) via tail vein.
- System Setup: Use a NIR-II fluorescence imaging system with a 1064 nm (or 980 nm) laser for excitation, equipped with an InGaAs camera (detection range 1100-1700 nm). Use appropriate long-pass filters (e.g., 1250 nm LP) to block excitation and NIR-I emission.
- Image Acquisition:
- Position the laser beam to uniformly illuminate the head region at a power density ≤ 100 mW/cm².
- Acquire a reference image prior to injection (background).
- Acquire time-series images post-injection (e.g., 0, 1, 5, 10, 30 min) with exposure times between 50-500 ms.
- Data Analysis: Use software to subtract background, apply flat-field correction, and create maximum intensity projections (MIP) or 3D reconstructions if using a scanning system. Calculate vessel diameter and signal-to-noise ratio (SNR).
Protocol 2: Comparative Penetration Depth Analysis
Objective: Quantify the penetration depth advantage of NIR-II over NIR-I using tissue-mimicking phantoms. Procedure:
- Phantom Preparation: Prepare 1% agarose blocks containing a homogenized scattering agent (Intralipid, μs' ~10 cm⁻¹ at 800nm) and an absorbing agent (India ink, μa ~0.1 cm⁻¹). Create a series of phantoms with thicknesses of 1, 2, 4, 6, 8, and 10 mm.
- Target Embedment: Place a capillary tube filled with a dual-emissive probe (fluorescent in both NIR-I and NIR-II, e.g., certain carbon nanotubes) at the bottom of each phantom block.
- Sequential Imaging: Image each phantom block first with a standard NIR-I system (785 nm ex / 830 nm em filter). Then image the same block with a NIR-II system (1064 nm ex / 1300 nm LP filter). Keep imaging parameters (exposure, FOV) consistent where possible.
- Quantification: Measure the signal intensity from the target capillary and the background intensity of the phantom for each thickness and modality. Calculate the contrast-to-noise ratio (CNR). Plot CNR vs. phantom thickness for both NIR-I and NIR-II to graphically demonstrate superior penetration.
Diagrams
Title: Optical Physics Underpinning NIR-II Imaging Advantages
Title: Standard In Vivo NIR-II Imaging Workflow
The Scientist's Toolkit: Essential Research Reagents & Materials
Table 3: Key Research Reagent Solutions for NIR-II Imaging
| Item | Function & Rationale | Example Products/Formulations |
|---|---|---|
| NIR-II Fluorophores | Emit fluorescence in the 1000-1700 nm range. The core agent enabling the modality. | Organic dyes (CH1055), Quantum Dots (Ag2S, PbS/CdS), Single-Wall Carbon Nanotubes, Lanthanide Nanoparticles. |
| Targeting Ligands | Conjugated to fluorophores to achieve specific binding to molecular targets (e.g., tumors, vascular markers). | Antibodies (anti-VEGF, anti-EGFR), Peptides (RGD, somatostatin), Aptamers. |
| Biopolymer Coatings | Coat nanoparticles to improve biocompatibility, solubility, and circulation half-life. | PEG derivatives, poly(maleic anhydride-alt-1-octadecene) (PMAO), zwitterionic polymers. |
| Anaesthetic Cocktail | For humane animal immobilization during prolonged image acquisition. | Ketamine/Xylazine mix, Isoflurane/O2 vaporizer. |
| Sterile PBS / Formulation Buffers | For dissolving/reconstituting fluorophore conjugates and as an injection vehicle. | 1x Phosphate Buffered Saline (pH 7.4), 5% Dextrose solution. |
| Tissue-Mimicking Phantom Materials | To calibrate systems and perform controlled penetration studies in vitro. | Agarose, Intralipid (scatterer), India Ink (absorber). |
| In Vivo Imaging Cassette | Securely and reproducibly position animals for longitudinal studies. | Heated, adjustable mouse beds with anesthesia nose cones. |
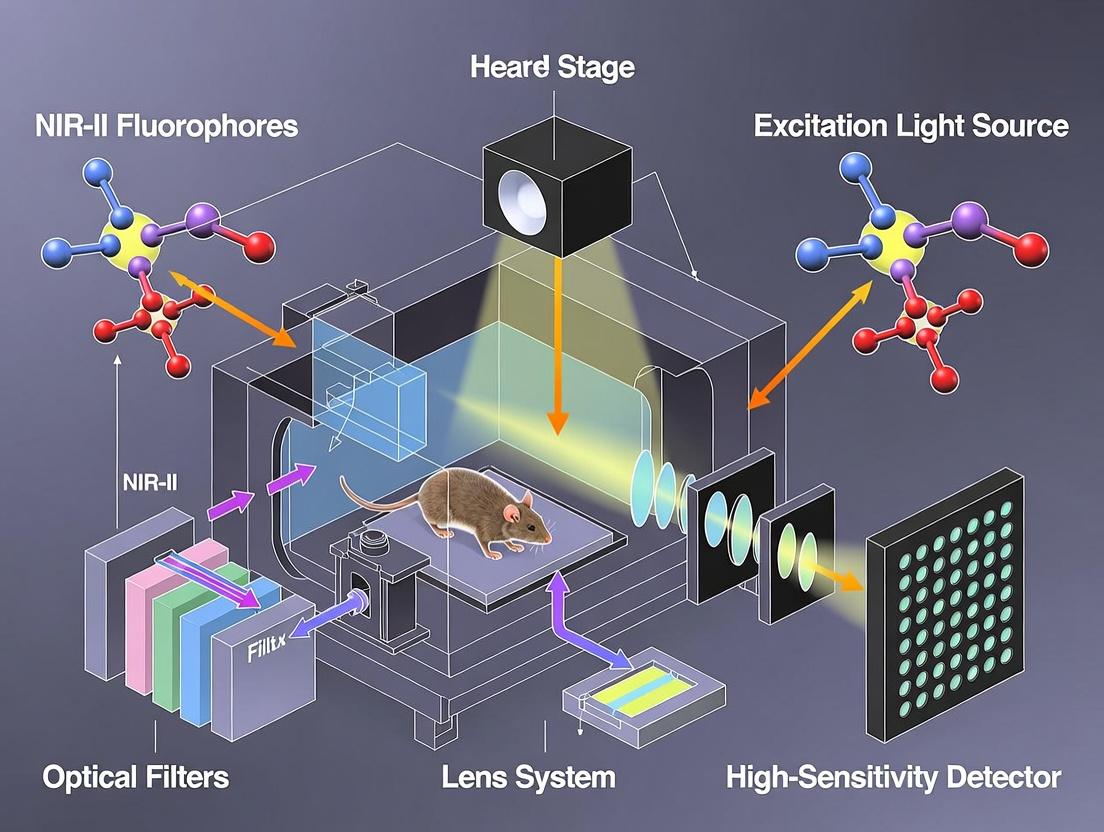
Within the context of a broader thesis on establishing a NIR-II (1000-1700 nm) fluorescence imaging system for in vivo small animal research, this document details the essential hardware components. Optimal selection and integration of lasers, filters, and detectors are critical for achieving high signal-to-background ratio, deep tissue penetration, and high-resolution biodistribution data for drug development.
NIR-II fluorophores are excited by specific wavelengths, typically between 808 nm and 1064 nm. The choice depends on the fluorophore's absorption peak and the need to minimize tissue autofluorescence and scattering.
Key Selection Criteria:
- Wavelength: Must match the absorption peak of the target fluorophore (e.g., 808 nm for ICG, 980 nm for some quantum dots, 1064 nm for rare-earth-doped nanoparticles).
- Power & Stability: Sufficient power (often 100-500 mW) for deep-tissue penetration, with <1% power fluctuation to ensure quantitative accuracy.
- Beam Quality: TEM00 mode for uniform sample illumination.
- Modulation: Ability to be modulated or pulsed for time-gated imaging to suppress autofluorescence.
Quantitative Comparison of Common Laser Types
Data sourced from current manufacturer specifications (Q1 2024).
| Laser Type | Typical Wavelengths (nm) | Output Power Range | Key Advantages | Limitations for NIR-II |
|---|---|---|---|---|
| Diode Laser | 785, 808, 830, 980 | 100 mW - 2 W | Compact, cost-effective, stable, easy to modulate. | Beam profile may require shaping; limited to specific discrete wavelengths. |
| DPSS Laser | 808, 946, 1064 | 50 mW - 1 W | Excellent beam quality (TEM00), high stability. | Larger, more sensitive to temperature, fewer wavelength options. |
| Tunable OPO | 700 - 1300+ | 10s - 100s mW | Wide tunability for multiple fluorophores. | Very expensive, complex, lower power at specific lines. |
Protocol 1.1: Calibrating Laser Power for Safe In Vivo Imaging
- Objective: To ensure consistent and safe excitation energy delivery.
- Materials: NIR-II laser, optical power meter with thermal head (calibrated for relevant wavelength), beam splitter (optional).
- Procedure: a. Warm up the laser for 30 minutes to achieve stable output. b. Direct the laser beam onto the power meter's sensor surface. c. Record the power reading (Pinitial) in Watts. d. Calculate the required power density at the sample plane. For in vivo imaging, typical safe limits are 50-100 mW/cm² for continuous wave lasers. e. Insert neutral density filters or adjust laser current to achieve the target power. Re-measure and record the final power (Pfinal). f. Document the calibrated setting (e.g., current, voltage) for repeatable experiments.
Optical Filters for Signal Isolation
Filters are essential to separate the weak NIR-II emission from the intense excitation light and from shorter-wavelength autofluorescence.
Filter Types and Configuration:
A standard setup uses a series of filters in the detection path:
- Excitation Filter (in illumination path): A bandpass filter placed before the sample to purify the laser line.
- Dichroic Mirror/Longpass Beamsplitter: Reflects the excitation laser towards the sample and transmits the longer-wavelength emission.
- Emission Filter (in detection path): A longpass or bandpass filter that blocks any residual laser light and passes only the NIR-II emission.
Quantitative Filter Specifications
Representative specifications for imaging with an 808 nm laser and ICG (emission >1000 nm).
| Filter Role | Type | Cut-on/Wavelength (nm) | Optical Density (OD) Blocking | Function |
|---|---|---|---|---|
| Excitation Clean-up | Bandpass | 808 ± 5 | >OD6 @ 750-790 & 820-850 nm | Ensures pure laser excitation. |
| Dichroic Beamsplitter | Longpass | Edge at 900 nm | >OD6 for Reflection (808 nm) | Separates excitation and emission paths. |
| Emission Filter | Longpass | 1000 nm or 1250 nm | >OD6 @ 808 nm | Blocks scattered laser and NIR-I autofluorescence. |
Protocol 2.1: Aligning and Validating the Filter Set
- Objective: To maximize emission signal throughput and completely block excitation light.
- Materials: Filter set, laser, NIR-sensitive card, a bright reference NIR-II sample (e.g., IR-1061 dye in capillary tube), power meter.
- Procedure: a. Initial Alignment: Without the emission filter, align the optical path so the excitation spot is centered on the sample and the emitted light is directed toward the detector. b. Insert Dichroic: Install the dichroic mirror at 45°. Verify the excitation spot remains on the sample. c. Blocking Test: Place the emission filter in the detection path. In a darkened room, use a NIR-sensitive card to visually inspect for any pinhole leaks of excitation light in the detection path. None should be visible. d. Signal Verification: Place the reference sample. Acquire an image with the full filter set in place. The signal should be strong. Temporarily remove the emission filter and acquire another image. The ratio of signal intensities (with/without filter) indicates filter transmission efficiency, but the image without the filter will likely be saturated by laser scatter.
Detection Systems: Cameras and Photodetectors
Capturing faint NIR-II photons requires detectors sensitive in the 1000-1700 nm range, with high quantum efficiency and low noise.
Detector Technology Comparison
Current market survey of primary detector technologies for NIR-II bioimaging.
| Detector Type | Spectral Range (nm) | Cooling Temp. | Quantum Efficiency (Peak) | Read Noise (Typical) | Frame Rate | Best Use Case |
|---|---|---|---|---|---|---|
| InGaAs FPA Camera | 900-1700 | -80°C (TE) | 70-85% | 50-100 e- | 10-100 Hz | High-resolution, real-time 2D imaging. |
| 2D InGaAs/CMOS | 400-1700 | -20°C (TE) | >80% @ 1550nm | <10 e- | >50 Hz | Broad spectrum, SWIR to visible. |
| LN2-cooled InGaAs | 800-2500 | -196°C | >85% | <20 e- | <10 Hz | Ultra-low noise for very weak signals. |
| PMT/Photodiode | to 1700 | -40°C | <5% | N/A | N/A | Point scanning for microscopy. |
Protocol 3.1: Characterizing Detector Sensitivity and Linearity
- Objective: To define the operational limits and linear response range of the NIR-II camera.
- Materials: NIR-II camera, integrated sphere or calibrated NIR-II light source, set of neutral density filters, data acquisition software.
- Procedure: a. Dark Current: Cover the camera lens, acquire images at various exposure times (e.g., 10 ms to 5 s). Plot mean pixel value vs. exposure time to derive dark current (counts/s). b. Linearity Test: Illuminate the camera uniformly with a stable NIR-II source. Insert a series of ND filters with known attenuation (e.g., OD 0.1 to 3.0). For each attenuation level, acquire an image and calculate the mean signal in a defined ROI. c. Analysis: Plot measured signal intensity against relative input intensity. Fit a linear regression. The range where R² > 0.999 defines the linear operational range. The point where the signal deviates by 5% indicates saturation.
The Scientist's Toolkit: Research Reagent Solutions
| Item | Function in NIR-II Imaging |
|---|---|
| ICG (Indocyanine Green) | FDA-approved NIR-I/II fluorophore (~820 nm ex / ~840 nm em, with tail >1000 nm). Used for angiography, perfusion, and as a reference standard. |
| IRDye 800CW / 680RD | Commercial NIR-I dyes, often conjugated to antibodies or peptides for molecular targeting. |
| PbS/CdSe Quantum Dots | Tunable NIR-II emitters (1000-1600 nm) with high brightness. Used for lymph node mapping and vascular imaging. |
| Rare-Earth Nanoparticles | (e.g., NaYF4:Yb,Er,Tm). Offer narrow emission bands, long lifetimes for time-gating, and excitation at 980 nm/808 nm. |
| Single-Walled Carbon Nanotubes | Fluoresce across a broad NIR-II range (1000-1400 nm). Used for high-resolution vascular imaging and sensing. |
| CH-4T Dye (Fluorophore) | Small-molecule organic dye with emission beyond 1000 nm. Used for brain and tumor imaging. |
| NIR-II Calibration Phantom | Solid or liquid phantom with embedded NIR-II fluorophores at known concentrations for system performance validation. |
System Integration & Workflow Diagrams
NIR-II Imaging Hardware Signal Path
In Vivo NIR-II Imaging Protocol Workflow
Near-infrared window-II (NIR-II, 1000-1700 nm) fluorescence imaging represents a transformative advancement for in vivo small animal research. Operating in this spectral range minimizes photon scattering, tissue absorption, and autofluorescence, enabling deeper tissue penetration, higher spatial resolution, and improved signal-to-background ratios compared to traditional NIR-I (700-900 nm) or visible light imaging. This is particularly critical for non-invasive longitudinal studies in oncology, neurobiology, and cardiovascular research. The performance of an NIR-II imaging system is fundamentally dependent on the probes employed. This document, framed within a thesis on NIR-II system setup for small animals, details the three primary probe classes—organic dyes, quantum dots, and other nanomaterials—providing application notes and standardized protocols for their evaluation and use.
Probe Classes: Characteristics and Quantitative Comparison
Table 1: Comparative Analysis of Major NIR-II Fluorescent Probe Classes
| Property | Organic Dyes (e.g., CH1055, IR-FEP) | Quantum Dots (e.g., Ag₂S, PbS/CdS) | Carbon Nanotubes (SWCNTs) | Rare-Earth Nanomaterials (RENPs) |
|---|---|---|---|---|
| Emission Range (nm) | 1000-1200 | 1000-1600 (tunable) | 1000-1400 | 1500-1700 (Er³⁺, Ho³⁺) |
| Quantum Yield (%) | 0.1 - 5 | 5 - 20 (in water) | 0.1 - 1 | < 1 |
| Extinction Coefficient (M⁻¹cm⁻¹) | ~10⁵ | 10⁵ - 10⁷ | ~10⁵ (per mg/L) | Varies |
| Stokes Shift (nm) | Large (>150) | Very Large (>200) | Extremely Large (>300) | Extremely Large (>500) |
| Hydrodynamic Size (nm) | < 5 (small molecule) | 5 - 15 (with coating) | Length: 200-500, Diam: 1-2 | 10 - 50 |
| Biodegradability | Generally Good | Poor (heavy metal content) | Poor | Generally Poor |
| Toxicity Concerns | Low (structure-dependent) | High (potential heavy metal leakage) | Under investigation | Low (if properly coated) |
| Excitation Source | 808 nm, 980 nm lasers | Broadband, 808 nm | 785 nm, 808 nm | 808 nm, 980 nm |
| Typical In Vivo Half-life | Hours | Days to weeks (RES accumulation) | Days | Days |
| Key Advantage | Rapid renal clearance, clinical translation potential | Bright, photostable, tunable emission | Ultra-stable, multiplexing capability | Sharp emission peaks, long lifetime |
| Primary Limitation | Moderate brightness | Potential long-term toxicity | Low quantum yield | Low quantum yield, complex synthesis |
Experimental Protocols
Protocol 3.1: Synthesis and Purification of a Representative Organic Dye (CH1055-PEG)
Objective: To synthesize a water-soluble, biocompatible NIR-II dye conjugate for in vivo imaging. Materials:
- CH1055-COOH dye (commercial or synthesized)
- NH₂-PEG₅₀₀₀-NH₂ (amine-PEG-amine)
- N-Hydroxysuccinimide (NHS)
- N-(3-Dimethylaminopropyl)-N'-ethylcarbodiimide (EDC)
- Dimethyl sulfoxide (DMSO), anhydrous
- Phosphate Buffered Saline (PBS, 0.01 M, pH 7.4)
- Dialysis tubing (MWCO 3.5 kDa)
- Size Exclusion Chromatography (SEC) column (Sephadex G-25)
Procedure:
- Activation: Dissolve 5 mg CH1055-COOH in 1 mL anhydrous DMSO. Add a 5-fold molar excess of EDC and NHS. Stir the reaction mixture under argon at room temperature for 2 hours.
- Conjugation: Add a 2-fold molar excess of NH₂-PEG₅₀₀₀-NH₂ to the activated dye solution. Adjust pH to 8.5 using triethylamine. Stir overnight at room temperature, protected from light.
- Purification: a. Dialysis: Transfer the reaction mixture to dialysis tubing and dialyze against 4L of PBS for 48 hours, changing the buffer every 12 hours. b. SEC: Concentrate the dialyzed solution and load onto a Sephadex G-25 column pre-equilibrated with PBS. Elute with PBS and collect the first colored band (CH1055-PEG conjugate).
- Characterization: Determine concentration via UV-Vis-NIR spectroscopy (using the dye's extinction coefficient). Analyze purity via HPLC. Store at -20°C in the dark.
Protocol 3.2:In VivoNIR-II Imaging of Tumor Vasculature in a Mouse Model Using Organic Dyes
Objective: To visualize tumor vascular architecture with high resolution using a tail-vein injected NIR-II dye. Materials:
- Nude mouse with subcutaneously implanted tumor (e.g., U87MG, ~200 mm³)
- CH1055-PEG (from Protocol 3.1, 1 mg/mL in PBS)
- NIR-II Fluorescence Imaging System (equipped with 808 nm laser, InGaAs camera with 1000 nm long-pass filter)
- Isoflurane anesthesia system
- Heating pad
- Insulin syringe (29G)
Procedure:
- Animal Preparation: Anesthetize the mouse using 2% isoflurane in oxygen. Place the animal in a prone position on a heated stage (37°C) within the imaging system. Maintain anesthesia at 1.5% isoflurane.
- Pre-injection Image: Acquire a baseline NIR-II image (exposure: 100 ms, laser power: 80 mW/cm²).
- Probe Administration: Inject 200 µL of CH1055-PEG solution (∼200 µg dye) via the tail vein.
- Image Acquisition: Acquire dynamic images at 1, 3, 5, 10, 30, and 60 minutes post-injection using identical acquisition parameters.
- Data Analysis: Use system software to draw regions of interest (ROIs) over the tumor and a contralateral muscle site. Plot signal intensity versus time. Calculate the tumor-to-background ratio (TBR = Mean IntensityTumor / Mean IntensityMuscle).
- High-Resolution Vasculature Imaging: At the 5-minute time point (peak blood pool contrast), acquire a high-resolution image (exposure: 300 ms) to visualize fine tumor vessels.
Protocol 3.3: Surface Functionalization of Ag₂S Quantum Dots for Targeted Imaging
Objective: To coat hydrophobic Ag₂S QDs with a PEG-ligand shell for active tumor targeting. Materials:
- Hydrophobic Ag₂S QDs (emission at 1200 nm, in chloroform)
- DSPE-PEG(2000)-Maleimide phospholipid
- Cyclic RGD peptide (cRGDfK) with a terminal cysteine
- Chloroform, Tetrahydrofuran (THF)
- PBS (pH 7.4)
- Probe sonicator, rotary evaporator.
Procedure:
- Lipid Coating: Mix 1 mL of Ag₂S QDs (1 µM) with 10 mg of DSPE-PEG-Maleimide in 5 mL chloroform. Remove solvent using a rotary evaporator to form a thin lipid/QD film.
- Hydration and Purification: Hydrate the film with 5 mL of PBS by sonication in a bath sonicator for 10 minutes until the solution is clear. Filter through a 0.22 µm syringe filter to remove aggregates.
- Ligand Conjugation: Add a 50-fold molar excess of thiolated cRGD peptide to the QD solution. React overnight at 4°C on a shaker.
- Purification: Remove excess peptide using a centrifugal filter unit (MWCO 100 kDa). Wash 3 times with PBS. Resuspend in PBS for characterization and use. Verify targeting by incubating with αvβ3 integrin-positive and negative cells.
Visualizations
Title: Probe Classes and Their Shared Applications
Title: In Vivo NIR-II Imaging Workflow
The Scientist's Toolkit: Research Reagent Solutions
Table 2: Essential Materials for NIR-II Probe Development and Imaging
| Item | Function/Description | Example Vendor/Catalog |
|---|---|---|
| NIR-II Organic Dye Building Blocks | Core fluorophores (e.g., benzobisthiadiazole, donor-acceptor-donor structures) for synthesizing small molecule dyes. | Sigma-Aldrich, TCI Chemicals |
| Hydrophobic NIR-II QDs | High-quality core/shell QDs (Ag₂S, PbS/CdS) in organic solvent, serving as the starting point for water solubilization. | NN-Labs, Ocean NanoTech |
| Functionalized PEG Ligands | Polyethylene glycol linkers (e.g., DSPE-PEG-NH₂, -COOH, -Maleimide) for probe biocompatibility and bioconjugation. | Nanocs, Laysan Bio |
| Targeting Ligands | Peptides (cRGD, RGD), antibodies, or affibodies for conferring molecular specificity to the probe. | Peptide International, Abcam |
| InGaAs NIR Camera | The critical detector for NIR-II light, typically cooled to reduce dark noise. Essential for system setup. | Hamamatsu, Princeton Instruments |
| 808 nm & 980 nm Diode Lasers | High-power, stable excitation sources matching the absorbance peaks of common NIR-II probes. | CNI Laser, Laserglow |
| Long-pass & Band-pass Filters | Optical filters (e.g., 1000 nm, 1100 nm, 1500 nm LP) to block excitation laser light and select emission range. | Thorlabs, Semrock |
| Small Animal Imaging Phantom | Calibration tool containing channels of known NIR-II probe concentrations for system performance validation. | BioTex, custom 3D print |
| Dialysis & Filtration Supplies | For probe purification (MWCO 3.5-100 kDa dialysis tubing, 0.22 µm syringe filters, 100 kDa centrifugal filters). | Thermo Fisher (Spectra/Por), Millipore |
| Image Analysis Software | For quantitative ROI analysis, 3D reconstruction, and signal kinetics extraction from acquired NIR-II images. | Living Image, FIJI/ImageJ |
Application Notes
Near-infrared window II (NIR-II, 1000-1700 nm) fluorescence imaging has become a transformative tool in preclinical research. Operating within this spectral range minimizes photon scattering and tissue autofluorescence, enabling deeper tissue penetration and significantly higher signal-to-background ratios (SBR) compared to traditional NIR-I (700-900 nm) imaging. This application note details core protocols in oncology, neuroimaging, and vascular studies, framed within the setup of a typical small animal NIR-II imaging system, which includes a laser excitation source (e.g., 808 nm or 980 nm), indium gallium arsenide (InGaAs) cameras, and a suite of biocompatible NIR-II fluorophores (e.g., quantum dots, single-walled carbon nanotubes, organic dyes).
1. Oncology: Tumor Targeting and Therapy Response NIR-II imaging provides unparalleled sensitivity for visualizing tumor morphology, receptor targeting, and pharmacokinetics. It allows for real-time monitoring of drug delivery and precise resection of metastatic lymph nodes. Quantitative metrics like tumor-to-background ratio (TBR) and SBR are drastically improved.
2. Neuroimaging: Cerebrovascular Dynamics and Blood-Brain Barrier Integrity The NIR-II window facilitates non-invasive, high-resolution imaging of cerebral blood flow and vascular architecture through the intact skull. It is critical for studying ischemic strokes, brain tumors, and neurovascular coupling, with minimal cranial window preparation required in rodent models.
3. Vascular Studies: Angiogenesis and Peripheral Hemodynamics NIR-II imaging enables the visualization of microvasculature below 100 µm in diameter with high temporal resolution. It is essential for quantifying hemodynamic parameters (blood flow velocity, vessel diameter) in models of hindlimb ischemia, tumor angiogenesis, and inflammatory diseases.
Quantitative Performance Data: NIR-I vs. NIR-II Imaging
Table 1: Comparative Performance Metrics in Key Preclinical Applications
| Application | Metric | NIR-I (700-900 nm) Performance | NIR-II (1000-1700 nm) Performance | Improvement Factor |
|---|---|---|---|---|
| Tumor Imaging | Signal-to-Background Ratio (SBR) | ~2 - 4 | ~8 - 12 | 3-4x |
| Imaging Depth (mm) | 1 - 3 | 5 - 10+ | 2-5x | |
| Spatial Resolution (µm) | ~500 - 1000 | ~20 - 50 | 10-25x | |
| Cerebrovascular Imaging | Vessel Contrast (Artery/Vein) | Low-Moderate | High | >2x |
| Through-skull clarity | Poor, often requires thinning | High-resolution mapping possible | N/A | |
| Peripheral Vasculature | Resolution (Min. vessel dia.) | ~200 - 300 µm | < 100 µm | 2-3x |
| Blood Flow Velocity Tracking | Limited by depth/blur | Precise tracking in capillaries | N/A |
Experimental Protocols
Protocol 1: NIR-II Imaging of Tumor-Targeted Probe Distribution and Pharmacokinetics
Objective: To quantify the accumulation and clearance of a targeted NIR-II fluorescent probe in a subcutaneous xenograft tumor model.
Materials: See The Scientist's Toolkit below. Animal Model: Athymic nude mouse with subcutaneously implanted U87MG (glioblastoma) cells.
Procedure:
- Probe Administration: Inject 200 µL of ICG-derivative NIR-II probe (e.g., IRDye800CW, 1 nmol in PBS) via tail vein.
- Imaging Setup: Anesthetize mouse with 2% isoflurane. Place in prone position on heated stage.
- Image Acquisition:
- Use 808 nm laser for excitation at a power density of 100 mW/cm².
- Acquire sequential images over 72 hours (e.g., 5 min, 30 min, 1, 2, 4, 8, 24, 48, 72 h) using a 1500 nm long-pass filter and InGaAs camera.
- Maintain consistent exposure time (e.g., 100 ms) and field of view.
- Data Analysis:
- Draw regions of interest (ROIs) over the tumor and contralateral muscle.
- Calculate mean fluorescence intensity (MFI) for each ROI.
- Plot Tumor-to-Background Ratio (TBR = MFItumor / MFImuscle) over time to generate pharmacokinetic profile.
Protocol 2: NIR-II Cerebral Vascular Imaging Through the Intact Skull
Objective: To visualize dynamic cerebral blood flow and vascular architecture in a C57BL/6 mouse without cranial window surgery.
Materials: See The Scientist's Toolkit below. Animal Model: Adult C57BL/6 mouse.
Procedure:
- Animal Preparation: Anesthetize mouse and secure in stereotaxic frame. Remove fur from scalp. Gently clean skull surface.
- Probe Administration: Inject 100 µL of NIR-II blood-pooling agent (e.g., PEGylated Ag₂S quantum dots, 5 µM) via tail vein.
- Imaging Setup: Position animal supine with skull facing the InGaAs detector. Use 980 nm excitation at 80 mW/cm².
- Image Acquisition:
- Acquire a high-resolution static image (exposure: 300 ms) with a 1250 nm long-pass filter to map vasculature.
- Switch to high-speed mode (exposure: 10 ms) to capture dynamic blood flow in a selected region (e.g., middle cerebral artery territory).
- Data Analysis:
- Use vessel analysis software to measure vessel diameter and branching density.
- From dynamic series, use line-scan analysis or particle image velocimetry to calculate blood flow velocity.
Protocol 3: NIR-II Imaging of Hindlimb Ischemia-Induced Angiogenesis
Objective: To longitudinally monitor revascularization and perfusion recovery following femoral artery ligation.
Materials: See The Scientist's Toolkit below. Animal Model: C57BL/6 mouse post-unilateral femoral artery ligation.
Procedure:
- Surgery: Perform unilateral femoral artery ligation under aseptic conditions. Allow animal to recover.
- Longitudinal Imaging: On days 0, 3, 7, 14, and 21 post-surgery, anesthetize the mouse.
- Probe & Acquisition: Administer blood-pooling NIR-II probe (as in Protocol 2). Image the ventral hindlimb region using 808 nm excitation and a 1100 nm long-pass filter.
- Perfusion Analysis: Acquire a time series immediately post-injection to monitor first-pass kinetics.
- Data Analysis:
- Quantify perfusion by measuring the time-to-peak intensity in the ischemic vs. non-ischemic limb.
- Calculate the ischemic/normal limb perfusion ratio from peak intensities.
- Count the number of visible collateral vessels in the thigh region at each time point.
Visualizations
NIR-II Tumor Targeting & Imaging Workflow
Neurovascular Coupling & NIR-II Reporting Pathway
Ischemia-Induced Angiogenesis Signaling & Monitoring
The Scientist's Toolkit: Key Research Reagent Solutions
Table 2: Essential Materials for NIR-II Preclinical Imaging Protocols
| Item Name | Category | Function & Brief Explanation |
|---|---|---|
| IRDye 800CW PEG | NIR-I/NIR-II Organic Dye | A benchmark hydrophilic dye for conjugation to targeting ligands (antibodies, peptides). Used for proof-of-concept tumor targeting studies. |
| PEGylated Ag₂S Quantum Dots | NIR-II Nanoprobes | Biocompatible, bright NIR-II emitters (~1200 nm). Ideal as inert, long-circulating blood-pool agents for vascular and perfusion imaging. |
| CH-4T Dye | NIR-II Organic Dye | A small-molecule dye with high quantum yield in the NIR-IIb region (>1500 nm). Excellent for high-contrast, deep-tissue imaging. |
| Anti-EGFR Affibody-IRDye800CW | Targeted Imaging Agent | Bioconjugate for specific targeting of Epidermal Growth Factor Receptor, overexpressed in many carcinomas. |
| Indocyanine Green (ICG) | Clinical NIR-I Dye | FDA-approved dye with a weak NIR-II tail emission. Used for initial system validation and comparative NIR-I vs. NIR-II studies. |
| Isoflurane Anesthesia System | Animal Preparation | Standard inhalation anesthetic for maintaining stable, long-term anesthesia during imaging sessions. |
| 1500 nm Long-Pass Emission Filter | Optical Filter | Critical optical component to block excitation laser light and collect only the genuine, redshifted NIR-II emission signal. |
| IVIS Spectrum CT or Similar | Integrated Imaging System | Commercial platform combining 2D NIR-II fluorescence, 3D tomography (CT), and living image software for co-registration and quantification. |
Step-by-Step Protocol: Setting Up and Running a NIR-II In Vivo Imaging Experiment
Within a thesis focused on establishing a robust NIR-II (1000-1700 nm) fluorescence imaging system for small animal research, meticulous pre-experimental planning is paramount. The selection of an appropriate animal model and the route for administering NIR-II fluorescent probes are critical variables that directly impact data quality, biological relevance, and experimental reproducibility. This document provides application notes and protocols to guide these foundational decisions.
Animal Model Selection for NIR-II Imaging
The choice of animal model is dictated by the research question, requiring careful consideration of species, strain, age, and health status.
Key Selection Criteria and Quantitative Comparison
Table 1: Common Small Animal Models for NIR-II Imaging
| Model | Typical Weight (g) | Key Advantages for NIR-II | Primary Research Applications | Considerations |
|---|---|---|---|---|
| Nude Mouse (nu/nu) | 20-30 | Lack of fur reduces scattering/autofluorescence; immunodeficient for xenografts. | Tumor oncology, pharmacokinetics. | Susceptible to infections; requires sterile housing. |
| C57BL/6 Mouse | 20-30 | Well-characterized genome; robust immune system. | Immunology, metabolism, cardiovascular disease. | Black fur must be removed (shaving/chemical depilation) for imaging. |
| BALB/c Mouse | 20-30 | Predisposed to Th2 immune response; readily forms tumors. | Immunology, infectious disease, monoclonal antibody production. | Similar fur considerations as C57BL/6. |
| SD Rat | 200-300 | Larger size allows for more surgical manipulation, repeated blood draws. | Neuroimaging, cardiovascular studies, detailed organ imaging. | Higher probe doses required; higher maintenance costs. |
| Athymic Nude Rat | 200-300 | Larger xenograft host with deeper imaging potential. | Orthotopic and larger tumor model studies. | High cost; specialized housing needed. |
Table 2: Impact of Animal Characteristics on NIR-II Signal
| Characteristic | Effect on NIR-II Imaging | Mitigation Strategy |
|---|---|---|
| Fur | Significant scattering & attenuation of signal. | Use hairless strains, or shave/depilate furred animals 24h prior to imaging. |
| Skin Pigmentation | Melanin absorbs in NIR region, can reduce signal. | Prefer albino strains (e.g., BALB/c nude) for superficial imaging. |
| Adipose Tissue | Lipophilic probes may accumulate, creating background. | Use fasted models or targeted hydrophilic probes for specific applications. |
| Age | Younger animals have thinner skin/less collagen. | Standardize age across experimental groups to minimize variability. |
Probe Administration Routes
The administration route determines the probe's pharmacokinetics, biodistribution, and target engagement profile.
Protocol 1: Intravenous (IV) Tail Vein Injection in Mice/Rats
This is the most common route for systemic probe delivery.
- Materials: NIR-II probe in sterile PBS/saline, 29-30G insulin syringe (mouse) or 26-27G syringe (rat), animal restrainer, heating lamp or chamber (37°C), 70% ethanol wipes.
- Procedure: a. Warm the animal for 5-10 minutes under a lamp or in a chamber to induce vasodilation of tail veins. b. Place the animal in a secure restrainer, exposing the tail. c. Clean the tail with an ethanol wipe. Identify one of the two lateral tail veins. d. Align the needle parallel to the vein. Insert the needle bevel-up at a shallow angle (~10-15°). e. Gently pull back on the plunger. Flashback of blood confirms correct intravenous placement. f. Inject the probe solution slowly and steadily (typical volume: 100-200 µL for mouse, up to 500 µL for rat). g. Withdraw the needle and apply gentle pressure to the site with gauze to achieve hemostasis.
- Notes: For repeated injections, start at the distal end of the tail and move proximally for subsequent doses.
Protocol 2: Subcutaneous (SC) Injection
Used for local delivery, lymphatic drainage studies, or slow-release profiles.
- Materials: NIR-II probe solution, 27-30G syringe, alcohol swab.
- Procedure: a. Restrain the animal manually or in a holder. b. Clean the loose skin over the scapular (back) or flank region with alcohol. c. Pinch a fold of skin to raise it. Insert the needle at a 45-degree angle into the base of the skin fold. d. Aspirate slightly to ensure the needle is not in a blood vessel. e. Inject the probe (typical volume: 50-200 µL). A slight bleb should form under the skin. f. Withdraw the needle and gently massage the area.
Protocol 3: Intramuscular (IM) Injection
Used for targeted delivery to muscle tissue.
- Materials: NIR-II probe solution, 27-30G syringe, alcohol swab.
- Procedure: a. Restrain the animal. Clean the hind limb (quadriceps or gastrocnemius) with alcohol. b. Insert the needle perpendicularly into the belly of the muscle. c. Aspirate to check for blood. If present, withdraw and reposition. d. Inject the probe (typical volume: 20-50 µL for mouse). e. Withdraw the needle and apply gentle pressure.
Protocol 4: Intratumoral (IT) Injection
For direct delivery of probes or therapeutics into a tumor mass.
- Materials: NIR-II probe solution, 29-30G syringe, alcohol swab, isoflurane/anesthesia equipment.
- Procedure: a. Anesthetize the animal and place it in a stable position. b. Clean the skin over the tumor. Palpate to define tumor borders. c. Insert the needle into the center of the tumor. To minimize backflow, insert the needle along the long axis of the tumor. d. Inject slowly to allow the solution to infiltrate the tissue without creating high pressure (typical volume: 20-100 µL, depending on tumor size). e. Leave the needle in place for 10-15 seconds post-injection before slowly withdrawing to reduce leakage.
Table 3: Comparison of Probe Administration Routes
| Route | Abbr. | Typical Volume (Mouse) | Onset of Systemic Signal | Key Applications |
|---|---|---|---|---|
| Intravenous | IV | 100-200 µL | Seconds | Whole-body biodistribution, angiography, tumor targeting. |
| Intraperitoneal | IP | 100-500 µL | Minutes | Systemic delivery when IV access is difficult; slower absorption. |
| Subcutaneous | SC | 50-200 µL | Minutes to Hours | Lymphatic imaging, vaccine/drug depot studies. |
| Intramuscular | IM | 20-50 µL | Minutes | Local muscle imaging, vaccine research. |
| Intratumoral | IT | 20-100 µL | Localized | Direct tumor therapy monitoring, probe retention studies. |
| Oral Gavage | PO | 100-500 µL | Hours | Gastrointestinal tract imaging, bioavailability studies. |
The Scientist's Toolkit: Essential Research Reagents & Materials
Table 4: Key Reagents and Materials for NIR-II Imaging Studies
| Item | Function/Description | Example/Notes |
|---|---|---|
| NIR-II Fluorescent Probes | Biological labels or activatable agents emitting >1000 nm. | ICG (FDA-approved, emits ~820 nm, tail into NIR-II), Quantum Dots (PbS, Ag2S), Single-Walled Carbon Nanotubes (SWCNTs), Organic Dye-Polymer Conjugates. |
| Sterile Phosphate-Buffered Saline (PBS) | Universal solvent/diluent for probe reconstitution and injection. | Ensure pH 7.4 and lack of endotoxins for in vivo use. |
| Isoflurane/Oxygen Anesthesia System | For safe and reversible immobilization during prolonged imaging sessions. | Essential for obtaining motion-artifact-free images. |
| Hair Removal Cream | Chemically removes fur to minimize optical scattering. | Apply 24 hours before imaging to avoid skin irritation affecting results. |
| Physiological Monitoring System | Monitors temperature, respiration, ECG during imaging. | Critical for animal welfare and data normalization under anesthesia. |
| Blackout Box/Chamber | Eliminates ambient light for maximal signal-to-noise ratio. | Custom-built or commercial imaging station enclosures. |
| Fluorescent Reference Phantoms | Contains known dye concentrations for signal calibration. | Essential for quantifying fluorescence intensity across experiments. |
Visualization of Decision Workflows
Title: Animal Model and Probe Administration Decision Workflow
Within the context of a thesis focused on establishing a robust near-infrared window II (NIR-II, 1000-1700 nm) fluorescence imaging system for longitudinal small animal research, precise system calibration and initialization are paramount. This protocol details the critical procedures for laser alignment and detector cooling, which directly impact spatial resolution, signal-to-noise ratio (SNR), and quantitative accuracy—key parameters for drug development studies.
Objective: To achieve precise spatial overlap of the excitation laser beam with the system's field of view and detection path, ensuring uniform and maximal excitation efficiency.
Materials and Equipment
| Item | Specification | Function |
|---|---|---|
| NIR-II Excitation Laser | e.g., 808 nm or 980 nm diode laser, CW/Pulsed | Provides excitation light for NIR-II fluorophores. |
| Alignment Tool: IR Card | Phosphor-based card (visible glow) | Allows visualization of near-infrared laser beam profile. |
| Beam Profiler Camera | Sensitive in laser wavelength range | Quantifies beam shape, size, and intensity distribution. |
| Optical Power Meter | Thermopile head, calibrated for relevant wavelength | Measures absolute laser power at sample plane. |
| Kinematic Mirror Mounts | High-precision, tip-tilt adjustment | Enables steering and alignment of laser beam path. |
| Pinhole Aperture | 100 µm diameter | Provides a fixed reference point for beam centering. |
| Optical Breadboard & Posts | Vibration-damped table, metric posts/stabilizers | Ensures mechanical stability of optical components. |
Step-by-Step Methodology
- Safety Initialization: Engage all laser safety interlocks. Install laser safety goggles appropriate for the wavelength.
- Coarse Visual Alignment: Using an IR card, visually trace the beam path from the laser output port to the sample stage. Adjust kinematic mirrors (M1, M2) to direct the beam towards the center of the objective lens's back aperture.
- Beam Centering (Pinhole Method):
- Place a 100 µm pinhole at the sample plane, coincident with the system's calibrated center position.
- With the laser at low power (<10% of operating power), adjust the upstream kinematic mirrors to maximize the transmitted power through the pinhole, measured by a power meter placed directly underneath.
- Beam Profile & Size Verification:
- Replace the pinhole with a beam profiler camera at the sample plane.
- Record beam parameters: 1/e² diameter, ellipticity, and Gaussian fit.
- Adjust beam expander/collimator (if present) to achieve the desired spot size (typically covering ~80% of the imaging field for wide-field systems).
- Final Power Calibration:
- Place the power meter at the sample plane.
- Measure power across a range of laser controller set points (e.g., 10%-100%).
- Create a calibration table to ensure reproducible excitation intensity.
Quantitative Alignment Targets
Table 1: Target Alignment Parameters for a Typical NIR-II Imaging System
| Parameter | Target Value | Tolerance | Measurement Tool |
|---|---|---|---|
| Beam Center Offset | 0 µm | ± 25 µm | Pinhole & Power Meter |
| Beam Diameter (1/e²) at Sample | 20 mm (for wide-field) | ± 2 mm | Beam Profiler Camera |
| Beam Ellipticity (Major/Minor Axis) | 1.0 (Circular) | < 1.1 | Beam Profiler Camera |
| Power Linearity (R² of Set vs. Measured) | 0.999 | > 0.995 | Power Meter |
| Point Spread Function (PSF) FWHM* | System-Limited (e.g., ~20 µm) | < 10% increase from theoretical | Fluorescent nanobead image |
*Post-alignment verification using 100 nm NIR-II fluorescent nanobeads.
Detector Cooling Protocol for InGaAs Cameras
Objective: To minimize dark current and read noise in the indium gallium arsenide (InGaAs) or other NIR-II sensitive detector, which is critical for detecting weak fluorescence signals from deep tissues.
Materials and Equipment
| Item | Specification | Function |
|---|---|---|
| NIR-II Camera | Thermoelectrically Cooled (TEC) InGaAs FPA (e.g., 320 x 256 or 640 x 512 pixels) | Captures NIR-II fluorescence emission. |
| Cooling System | Integrated TEC with liquid or air heat exchanger | Reduces sensor temperature. |
| Vacuum System (if applicable) | Integrated pump or sealed dewar | Prevents condensation and thermal shorting in deep-cooled sensors. |
| Dark Frame Acquisition Software | Manufacturer SDK or LabVIEW/Python API | Controls camera temperature and acquires calibration images. |
| Temperature Monitor | Integrated sensor readout | Provides real-time detector temperature. |
Step-by-Step Methodology
- System Power-Up & Initialization: Power on the camera controller and cooling system. Allow the electronics to stabilize for 15 minutes.
- Cooling Ramp-Down: In software, set the target sensor temperature (typically -20°C to -80°C, depending on model). Initiate gradual cooling. A rate of 5°C per minute is recommended to avoid thermal stress.
- Stabilization & Vacuum Check (if applicable): Once the target temperature is reached, allow the system to stabilize for 30 minutes. For cameras requiring vacuum, verify vacuum level is within manufacturer specification (e.g., < 10⁻³ mbar).
- Dark Current Characterization:
- Set the camera to its normal operating integration time range (e.g., 1 ms to 5 s).
- With the laser off and the lens cap on, acquire a series of 100 dark frames at each key integration time.
- Calculate the mean dark signal (DN) and its temporal standard deviation (noise) for each pixel and integration time.
- Cooling Performance Validation: Plot dark current (mean DN/s) vs. sensor temperature. Verify it follows the approximate doubling rule for every 10°C increase (for InGaAs).
Quantitative Cooling Performance Metrics
Table 2: Expected Detector Cooling Performance Benchmarks
| Parameter | Typical Value at -60°C | Measurement Condition | Importance for Imaging |
|---|---|---|---|
| Mean Dark Signal | < 50 DN/s | Integration Time: 100 ms | Determines the background floor of the image. |
| Dark Signal Non-Uniformity (DSNU) | < 20 DN (peak-to-valley) | Integration Time: 100 ms | Affects fixed-pattern noise, correctable by calibration. |
| Temporal Dark Noise (Read Noise + Dark Shot Noise) | < 150 e⁻ RMS | Integration Time: 1 ms | Ultimate limit for detecting low photon fluxes. |
| Cooling Stability (over 1 hour) | ± 0.1 °C | At operating temperature | Ensures consistent dark current during long acquisitions. |
Integrated Calibration Workflow Diagram
Title: NIR-II Imaging System Calibration and Initialization Workflow
The Scientist's Toolkit: Essential Reagents & Materials
Table 3: Key Research Reagent Solutions for Calibration & Validation
| Item | Function/Application | Example Product/Specification |
|---|---|---|
| NIR-II Fluorescent Nanobeads | Point Spread Function (PSF) measurement for resolution validation. Allows quantification of system resolution post-alignment. | 100 nm diameter, PEG-coated, emitting at 1300 nm. |
| IR-Reflective Phosphor Card | Visualizes near-infrared laser beam path and approximate profile for safe, coarse alignment. | Card converting 700-1600 nm light to visible glow. |
| NIR Spectral Flat-Field Standard | Provides uniform reflectance (>95%) across 900-1700 nm for correcting pixel-to-pensitivity variations in the detector. | Labsphere Spectralon diffuse reflectance target. |
| Laser Power Calibration Meter | Provides traceable measurement of absolute excitation power at the sample plane for dose reproducibility. | Thermopile head meter calibrated at 808 nm & 980 nm. |
| Absolute Temperature Blackbody | For radiometric calibration of the NIR-II camera, converting digital counts to spectral radiance (mW/cm²/sr/nm). | Cavity blackbody source with known emissivity (>0.99). |
Animal Preparation and Anesthesia for Stable, Ethical NIR-II Imaging
1. Introduction Effective near-infrared-II (NIR-II, 1000-1700 nm) fluorescence imaging in small animal models requires meticulous physiological stabilization and humane anesthetic management. Motion artifacts from breathing and cardiac output severely degrade image resolution and quantitative accuracy. This protocol details a standardized approach for animal preparation, anesthesia induction, and maintenance tailored for prolonged NIR-II imaging sessions, ensuring both data fidelity and animal welfare within a comprehensive NIR-II system setup thesis.
2. Key Principles & Quantitative Parameters for Stable Imaging Successful imaging hinges on maintaining homeostasis. Critical physiological parameters must be monitored and kept within optimal ranges.
Table 1: Target Physiological Parameters for Stable NIR-II Imaging in Rodents
| Parameter | Mouse Target Range | Rat Target Range | Monitoring Method | Impact on Imaging |
|---|---|---|---|---|
| Body Temperature | 36.5 - 37.5 °C | 36.5 - 37.5 °C | Rectal probe, feedback pad | Crucial for metabolic rate, cardiac function, and anesthetic depth. |
| Respiratory Rate | 80 - 120 breaths/min | 65 - 85 breaths/min | Thoracic pressure pad, capnograph | Primary source of motion artifacts. Stable rate minimizes drift. |
| Heart Rate | 450 - 550 bpm | 300 - 400 bpm | ECG electrodes, pulse oximeter | Indicates anesthetic depth and circulatory stability. |
| Oxygen Saturation (SpO₂) | > 95% | > 95% | Pulse oximeter (paw/tail) | Ensures adequate tissue oxygenation for physiology. |
| Anesthetic Depth | Surgical plane (no pedal reflex) | Surgical plane (no pedal reflex) | Toe pinch reflex, respiratory pattern | Prevents movement while avoiding overdose. |
3. Detailed Protocol: Pre-Imaging Preparation & Anesthesia
3.1. Materials and Pre-Procedural Setup The Scientist's Toolkit: Essential Materials for Animal Preparation
| Item | Function & Rationale |
|---|---|
| Isoflurane Anesthesia System | Vaporizer, induction chamber, and nose cone for precise, reversible gas anesthesia. |
| Circulating Water Heating Pad | Maintains core body temperature under anesthesia-induced hypothermia. |
| Physiological Monitor | Integrated system for tracking temperature, ECG, respiration, and SpO₂. |
| Ophthalmic Ointment | Prevents corneal drying during prolonged anesthesia. |
| Hair Removal Cream/Depilatory | Removes hair at imaging site with minimal skin irritation vs. shaving. |
| Physiological Saline (0.9%) | For subcutaneous injection to prevent dehydration during long procedures. |
| Tail Vein Catheter (e.g., 30G) | For stable, repeated intravenous administration of NIR-II contrast agents. |
| Sterile Lubricant | For lubricating temperature probe. |
3.2. Step-by-Step Animal Preparation Protocol
- Acclimatization: House animals in the procedure room for >30 minutes pre-experiment.
- Induction: Place animal in an induction chamber with 3-4% isoflurane in 1 L/min O₂.
- Transfer & Securing: Once unresponsive, transfer to imaging stage. Secure nose in anesthesia mask (1-2.5% isoflurane for maintenance). Apply ophthalmic ointment.
- Physiological Monitoring: Insert rectal temperature probe. Place animal on heating pad (37°C set point). Attach ECG leads (front and hind paw). Position respiration sensor under thorax. Attach pulse oximeter clip to hind paw or tail.
- Hydration: Administer 0.5-1 mL (mouse) or 2-3 mL (rat) sterile saline subcutaneously.
- Site Preparation: Apply depilatory cream to imaging area (e.g., dorsum, abdomen) for 30-60 seconds. Wipe clean thoroughly with saline-moistened gauze.
- Vascular Access (Optional for IV agents): Under a stereomicroscope, cannulate a lateral tail vein with a 30G catheter. Secure with tape and flush with heparinized saline.
- Stabilization Period: Allow animal to stabilize under anesthesia for 5-10 minutes, ensuring all parameters (Table 1) are within target ranges before starting imaging.
3.3. Intra-Imaging Monitoring & Recovery
- Monitoring: Continuously record all parameters. Adjust isoflurane level (typically 1-1.5% for maintenance) based on respiration and reflex.
- Recovery: Upon imaging completion, discontinue isoflurane and maintain O₂ flow. Place animal in a warm, clean cage in a sternal recumbent position. Monitor until fully ambulatory.
4. Experimental Workflow for NIR-II Imaging Session
Diagram Title: Workflow for Animal Prep and NIR-II Imaging Session
5. Signaling Pathway of Anesthetic Action & Physiological Impact
Diagram Title: Anesthetic Action Pathway and Physiological Effects
Within the framework of optimizing a NIR-II fluorescence imaging system for longitudinal small animal research, defining the acquisition workflow is paramount. The core distinction lies in selecting parameters tailored for dynamic (kinetic, time-series) imaging versus static (single-time-point, high-resolution) imaging. This protocol details the systematic approach to parameter configuration, ensuring data integrity for pharmacokinetic, biodistribution, and disease progression studies.
Core Parameter Definitions & Comparative Analysis
The following parameters form the basis of the acquisition workflow. Their optimal settings diverge significantly based on the imaging mode.
Table 1: Core Acquisition Parameters for Static vs. Dynamic NIR-II Imaging
| Parameter | Static Imaging Purpose & Typical Setting | Dynamic Imaging Purpose & Typical Setting | Rationale for Difference |
|---|---|---|---|
| Integration Time | Maximize SNR for detailed anatomy. Typical: 100-1000 ms. | Balance SNR with temporal resolution. Typical: 50-200 ms. | Longer time improves SNR for snapshots; shorter time enables faster sampling for kinetics. |
| Binning | Improve SNR without sacrificing resolution. Typical: 1x1 or 2x2. | Improve SNR and speed at cost of resolution. Typical: 2x2 or 4x4. | Dynamic studies prioritize frame rate; binning increases signal throughput per pixel. |
| Field of View (FOV) | Often high-magnification for specific organ/region. Typical: 5x5 cm to 10x10 cm. | Must encompass whole animal or region of interest for entire kinetic series. Typical: 10x10 cm to 15x15 cm. | Dynamic tracking requires a consistent, encompassing FOV; static can be focused. |
| Excitation Power | Optimize for depth penetration & target signal. Typical: 50-100 mW/cm². | Lower to minimize photobleaching & toxicity over series. Typical: 10-50 mW/cm². | Repeated exposure in dynamic mode necessitates lower fluence to preserve signal and biology. |
| Frame Rate / Total Acquisition | Single frame or average of few frames. Total Time: Seconds. | Continuous or triggered capture over time. Frame Rate: 0.2-5 Hz. Total Time: Minutes to hours. | Dynamic imaging is defined by a temporal dimension, requiring sequential frames. |
| Anesthesia Management | Single, short-duration plane. | Sustained, stable plane (e.g., via nose cone with isoflurane). | Physiological stability is critical over extended dynamic acquisitions. |
Experimental Protocols
Protocol 3.1: Static High-Resolution Biodistribution Study
Aim: To capture a high-SNR, detailed image of probe distribution at a terminal time point.
- Animal Preparation: Anesthetize mouse (e.g., 2% isoflurane), depilate relevant areas, position supine on heated stage.
- System Setup:
- Select appropriate NIR-II filter set (e.g., 1000 nm long-pass).
- Set FOV to cover entire animal or region of interest (e.g., 8x8 cm).
- Set Parameters: Integration Time: 300 ms; Binning: 1x1; Excitation Power: 80 mW/cm².
- Perform a flat-field correction using a reference standard.
- Acquisition:
- Acquire a background image (no excitation).
- Administer NIR-II probe via tail vein.
- Wait for predetermined uptake period (e.g., 24h).
- Acquire fluorescence image. Optionally, average 3 frames.
- Acquire white-light reference image.
- Analysis: Subtract background; apply flat-field correction; quantify ROI intensities for biodistribution.
Protocol 3.2: Dynamic Kinetic Pharmacokinetic Study
Aim: To non-invasively monitor the real-time circulation and clearance of an NIR-II probe.
- Animal Preparation: Place mouse in anesthesia induction chamber (3% isoflurane), then transfer to imaging stage with nose cone (1.5-2% isoflurane). Secure tail vein with a pre-warmed cuff for injection.
- System Setup:
- Select NIR-II filter set.
- Set FOV to encompass heart, liver, and bladder (e.g., 12x6 cm).
- Set Parameters: Integration Time: 100 ms; Binning: 2x2; Excitation Power: 25 mW/cm².
- Set acquisition to continuous stream mode with 2 Hz frame rate for 30 minutes.
- Acquisition:
- Start acquisition, recording 30 seconds of pre-injection baseline.
- Pause acquisition briefly; intravenously inject probe (100 µL bolus).
- Immediately resume acquisition for the remainder of the 30-minute period.
- Analysis: Generate time-activity curves (TACs) from ROIs over major organs (heart, liver, kidney). Calculate pharmacokinetic parameters (e.g., half-life).
Visualizing the Decision Workflow
Diagram Title: Decision Workflow for Selecting Imaging Mode
The Scientist's Toolkit: Essential Reagents & Materials
Table 2: Key Research Reagent Solutions for NIR-II Imaging
| Item | Function & Application | Example/Notes |
|---|---|---|
| NIR-II Fluorescent Probes | Generate target-specific or blood-pool contrast in the NIR-II window (1000-1700 nm). | Organic dyes (e.g., CH-4T), quantum dots, single-walled carbon nanotubes (SWCNTs). |
| Anesthetic System | Maintain animal immobility and physiological stability during imaging. | Isoflurane vaporizer with induction chamber and nose cone; heated stage. |
| Fluorescence Reference Standards | For system calibration, flat-field correction, and signal quantification. | Solid epoxy blocks or liquid phantoms with embedded NIR fluorophores (e.g., IR-26 dye). |
| Depilatory Cream | Remove hair to eliminate autofluorescence and light scattering. | Commercial hair removal creams; apply and wipe clean before imaging. |
| Sterile Saline / Vehicle | Diluent for probe formulation and vehicle control injections. | 0.9% saline, phosphate-buffered saline (PBS). |
| Tail Vein Injection Setup | For precise, reproducible intravenous bolus delivery. | 30G insulin syringes, pre-warmed tail vein restrainer, alcohol swabs. |
| Image Analysis Software | For ROI analysis, kinetic curve fitting, and image processing. | Commercial (Living Image, Aura) or open-source (ImageJ, FIJI) with custom macros. |
This document details the critical post-processing pipeline for data acquired from a NIR-II fluorescence imaging system, a core component of a thesis focused on optimizing in vivo imaging for small animal research in oncology and neurobiology.
Raw NIR-II imaging data is contaminated by multiple signal sources: tissue autofluorescence, excitation light leakage, and spectral bleed-through from multiplexed probes. A robust pipeline is required to isolate the target fluorescence signal and reconstruct quantitative, localizable data. This pipeline is sequential: the output of Background Subtraction feeds into Spectral Unmixing, the result of which is used for 3D Reconstruction.
Protocol 1: Background Subtraction
Objective: Remove non-specific background (autofluorescence, stray light) to enhance target signal-to-noise ratio (SNR). Principle: Modeling and subtracting the baseline signal present in the absence of the specific fluorophore.
Detailed Protocol:
- Image Acquisition:
- Acquire in vivo image of the animal injected with the NIR-II fluorescent probe (e.g., IRDye 800CW, CH-4T) at the target excitation/emission settings (e.g., 785 nm ex / 1000 nm LP em).
- Acquire an autofluorescence control image of the same animal prior to probe injection or from a non-injected control animal, using identical imaging parameters (exposure time, laser power, FOV).
- Software Loading:
- Open both images in processing software (e.g., MATLAB with Image Processing Toolbox, Python with SciKit-Image, or commercial software like Living Image).
- Image Registration:
- Use a rigid or affine transformation algorithm to align the autofluorescence control image precisely with the probe image, correcting for any minor animal movement.
- Subtraction Model:
- Perform pixel-wise subtraction:
Background_Subtracted_Image = Probe_Image - (k * Autofluorescence_Control_Image). - The scaling factor
k(typically between 0.8 and 1.2) is determined by optimizing SNR in a region devoid of specific signal.
- Perform pixel-wise subtraction:
- Validation:
- Quantify SNR in a region-of-interest (ROI) over the target and an adjacent background ROI. Successful subtraction should yield a >3-fold increase in SNR.
Table 1: Impact of Background Subtraction on Signal Quality
| Metric | Raw Image | After Background Subtraction | Improvement Factor |
|---|---|---|---|
| Target Signal (Mean Counts) | 15,000 ± 1,200 | 12,500 ± 800 | N/A |
| Background (Mean Counts) | 8,000 ± 600 | 1,200 ± 150 | 6.7x |
| Signal-to-Noise Ratio (SNR) | 8.8 | 56.3 | 6.4x |
| Contrast-to-Noise Ratio (CNR) | 7.3 | 49.5 | 6.8x |
Protocol 2: Spectral Unmixing
Objective: Resolve individual fluorescent probe signals in multiplexed imaging. Principle: Using a linear mixing model to decompose the measured spectrum at each pixel into the weighted sum of known reference spectra.
Detailed Protocol:
- Spectral Library Creation:
- Acquire reference spectral images from mice injected with a single probe (e.g., Probe A: IRDye 800CW, Probe B: CH-4T) or from phantoms containing individual probes. Use the same spectral filter set (e.g., 1000nm, 1100nm, 1200nm, 1300nm LP).
- For each probe, extract the mean intensity value across each spectral channel to create its characteristic spectral signature vector, normalized to its maximum.
- Multiplexed Data Acquisition:
- Image the co-injected animal across the same set of spectral channels.
- Linear Unmixing Computation:
- For each pixel
i, model the measured signal:S_i = Σ (c_j * R_j) + ε, whereS_iis the vector of intensities across channels,c_jis the concentration of probej,R_jis its reference spectrum, andεis noise. - Solve for
c_jusing non-negative least squares (NNLS) regression, constrained so thatc_j ≥ 0.
- For each pixel
- Output Generation:
- The algorithm generates a set of unmixed images, one for each probe, representing its spatially resolved contribution.
- Validation:
- Validate using a phantom with spatially separated probes. Cross-talk between unmixed channels should be <5%.
Table 2: Spectral Unmixing Performance for a Two-Probe System
| Probe | Reference Peak (nm) | Unmixed Signal Fidelity* | Residual Cross-Talk to Other Channel |
|---|---|---|---|
| IRDye 800CW | 820 | 98.5% | 2.1% |
| CH-4T | 1100 | 97.8% | 1.7% |
| Background | N/A | N/A | 96% removed |
*Fidelity = Correlation coefficient between unmixed image and ground-truth single-probe image.
Protocol 3: 3D Surface Reconstruction
Objective: Project 2D fluorescence data onto a 3D anatomical surface for improved localization. Principle: Using a structured light or laser profilometry scan to acquire a 3D mesh of the animal, then mapping the 2D fluorescence image onto this mesh using camera projection geometry.
Detailed Protocol:
- 3D Surface Scan:
- Immediately following fluorescence imaging, acquire a 3D surface scan of the animal in the same pose using an integrated laser scanner or structured light module.
- Coordinate System Calibration:
- Use a calibration target visible to both the fluorescence camera and 3D scanner to define a common world coordinate system.
- Image-to-Surface Mapping:
- Using the calibrated camera intrinsic (focal length, principal point) and extrinsic (rotation, translation) parameters, project each pixel from the unmixed 2D fluorescence image onto the corresponding 3D coordinate on the surface mesh (ray-triangle intersection).
- Data Integration & Visualization:
- The fluorescence intensity is assigned as a texture or vertex color on the 3D mesh.
- The 3D model enables volumetric quantification (e.g., tumor surface fluorescence density) and multi-view visualization.
Table 3: Dimensional Accuracy of 3D Fluorescence Reconstruction
| Measurement | Ground Truth (Calipers) | 3D Reconstructed Model | Error |
|---|---|---|---|
| Tumor Length (mm) | 4.2 | 4.1 | 2.4% |
| Distance between foci (mm) | 8.5 | 8.7 | 2.3% |
| Surface Area of Signal (mm²) | 28.3 | 27.5 | 2.8% |
Title: NIR-II Post-Processing Pipeline Workflow
The Scientist's Toolkit: Research Reagent & Software Solutions
| Item | Category | Function in Pipeline |
|---|---|---|
| IRDye 800CW PEG | Fluorescent Probe | Well-characterized NIR-I/NIR-II dye for labeling; serves as a reference in spectral unmixing libraries. |
| CH-4T (or similar DCNP) | Fluorescent Probe | Bright, tunable NIR-II semiconductor probe; enables deep-tissue multiplexing. |
| MatLab Image Processing Toolbox | Software | Platform for implementing custom background subtraction and unmixing algorithms. |
| Python (SciKit-Image, NumPy) | Software | Open-source alternative for building and executing the entire processing pipeline. |
| Living Image (PerkinElmer) / IVIS SpectrumCT | Software/Hardware | Integrated commercial solution offering all three pipeline steps with GUI-driven workflows. |
| 3D Laser Scanner Module | Hardware | Attachable to imaging system for high-resolution animal surface mesh acquisition. |
| Spectral Filter Set (e.g., 1000, 1100, 1200nm LP) | Hardware | Enables acquisition of spectral data cubes required for linear unmixing. |
| Fluorescent Gel Phantom Kit | Calibration Tool | Provides ground-truth targets for validating unmixing accuracy and 3D reconstruction fidelity. |
This application note details a critical case study within a broader thesis focused on establishing a robust NIR-II (1000-1700 nm) fluorescence imaging system for preclinical small animal research. The superior performance of NIR-II probes, characterized by reduced tissue scattering, minimal autofluorescence, and deeper tissue penetration, is leveraged here to quantitatively analyze tumor targeting efficiency and biodistribution profiles of a novel molecular probe.
Key Experimental Data and Findings
Table 1: In Vivo Tumor Targeting Efficacy of Probe X
| Time Point (h post-injection) | Tumor Signal-to-Background Ratio (SBR) | Tumor Uptake (%ID/g) * | Major Organ of Accumulation |
|---|---|---|---|
| 1 | 2.1 ± 0.3 | 3.5 ± 0.8 | Liver |
| 6 | 5.8 ± 0.9 | 8.2 ± 1.2 | Tumor |
| 12 | 8.9 ± 1.4 | 10.5 ± 1.5 | Tumor |
| 24 | 6.2 ± 1.1 | 7.1 ± 1.0 | Tumor > Kidneys |
| 48 | 2.5 ± 0.5 | 2.0 ± 0.5 | Intestines |
*%ID/g = Percentage of Injected Dose per gram of tissue.
Table 2: Ex Vivo Biodistribution at 24 Hours Post-Injection
| Organ/Tissue | Fluorescence Intensity (Mean ± SD) | %ID/g (Mean ± SD) |
|---|---|---|
| Tumor | 85500 ± 12500 | 10.5 ± 1.5 |
| Liver | 42100 ± 7800 | 5.2 ± 0.9 |
| Spleen | 38800 ± 6500 | 4.8 ± 0.7 |
| Kidneys | 50200 ± 8200 | 6.3 ± 1.0 |
| Heart | 8500 ± 1500 | 1.1 ± 0.3 |
| Lungs | 12400 ± 2100 | 1.5 ± 0.4 |
| Muscle | 3100 ± 800 | 0.4 ± 0.1 |
| Blood | 4500 ± 900 | 0.6 ± 0.2 |
Detailed Experimental Protocols
Protocol 1: Synthesis and Characterization of NIR-II Probe X
- Conjugation: React the NHS ester of the NIR-II fluorophore (e.g., CH1055 derivative) with the amine-terminated targeting ligand (e.g., cRGD peptide) in anhydrous DMSO with DIEA for 12 hours at 4°C.
- Purification: Purify the conjugate via HPLC using a C18 column with an acetonitrile/water (0.1% TFA) gradient.
- Characterization: Validate using MALDI-TOF mass spectrometry. Determine concentration via UV-Vis absorbance using the fluorophore's extinction coefficient.
Protocol 2: In Vivo NIR-II Imaging for Tumor Targeting Kinetics
- Animal Model: Use athymic nude mice bearing subcutaneous U87MG glioblastoma xenografts (tumor volume ~150-300 mm³).
- Probe Administration: Inject Probe X intravenously via the tail vein at 100 µL of a 200 µM solution in PBS (n=5).
- Imaging: Anesthetize mice with 2% isoflurane. Acquire images at 1, 6, 12, 24, and 48 hours post-injection using a NIR-II imaging system (e.g., equipped with a 1064 nm laser, 1300 nm long-pass filter, InGaAs camera).
- Analysis: Draw regions of interest (ROIs) over tumor and contralateral background tissue. Calculate Tumor SBR as (Mean Tumor Signal) / (Mean Background Signal).
Protocol 3: Ex Vivo Biodistribution Analysis
- Tissue Collection: At 24h post-injection, euthanize mice and perfuse with PBS. Harvest tumor and major organs (heart, liver, spleen, lungs, kidneys, muscle).
- Imaging: Place tissues on a petri dish and acquire ex vivo NIR-II images using identical system settings.
- Quantification: Measure fluorescence intensity for each tissue ROI. Convert to %ID/g using a standard curve generated from serially diluted probe solutions imaged under identical conditions.
Visualizations
Experimental Workflow for NIR-II Probe Evaluation
Mechanism of Targeted NIR-II Probe Accumulation
The Scientist's Toolkit: Essential Research Reagents & Materials
Table 3: Key Research Reagent Solutions
| Item | Function/Benefit | Example/Note |
|---|---|---|
| NIR-II Fluorophore | Core emitter with excitation/emission in NIR-II window for deep-tissue, high-resolution imaging. | CH1055, IR-1061, or organic dye like FDA. |
| Targeting Ligand | Enables specific binding to biomarkers overexpressed on target cells (e.g., tumor vasculature). | Peptides (cRGD, octreotate), antibodies, affibodies. |
| Conjugation Reagent | Facilitates covalent linkage between fluorophore and targeting moiety. | NHS ester, maleimide, click chemistry reagents (DBCO, TCO). |
| Animal Disease Model | Provides a physiologically relevant system to study probe targeting and biodistribution. | Mouse xenograft (U87MG, 4T1), orthotopic, or transgenic models. |
| NIR-II Imaging System | Enables detection and quantification of NIR-II fluorescence in vivo. Requires 1064 nm laser, InGaAs camera, spectral filters. | Commercial systems or custom-built setups. |
| Image Analysis Software | For ROI quantification, signal intensity measurement, and kinetic/biodistribution analysis. | ImageJ, Living Image, or vendor-specific software. |
| Anatomical Reference Agent | Co-administered for spatial registration of fluorescent signal with anatomy. | Micro-CT contrast agent or ultrasound. |
Maximizing Performance: Troubleshooting Common Issues and Advanced Optimization Techniques
Diagnosing and Fixing Poor Signal-to-Noise Ratio (SNR) and Autofluorescence
Within the thesis framework for establishing a robust NIR-II (1000-1700 nm) fluorescence imaging system for longitudinal small animal studies, managing signal-to-noise ratio (SNR) and autofluorescence is paramount. Poor SNR compromises detection sensitivity and quantification accuracy, directly impacting drug efficacy and biodistribution studies. This protocol details systematic diagnostic steps and corrective protocols to optimize imaging fidelity.
Core Principles & Quantitative Benchmarks
A high-performance NIR-II system should achieve specific benchmarks. Suboptimal values trigger the diagnostic workflow.
Table 1: NIR-II System Performance Benchmarks
| Parameter | Target Benchmark | Typical Poor Performance Indicator |
|---|---|---|
| System SNR (in vivo, major vessel) | > 10 dB | < 5 dB |
| Tissue Autofluorescence (Background, 1100 nm) | < 100 counts/ms (at standard gain) | > 500 counts/ms |
| Detector Dark Noise (Cooled InGaAs) | < 500 e-/pixel/sec | > 1000 e-/pixel/sec |
| Excitation Laser Stability | Fluctuation < 2% (over 1 hr) | Fluctuation > 5% |
| Spatial Resolution (in vivo) | < 40 µm | > 100 µm |
Diagnostic Workflow for Low SNR & High Autofluorescence
Follow this structured decision tree to identify the root cause.
Diagram Title: Root Cause Diagnosis for SNR and Autofluorescence Issues
Detailed Experimental Protocols for Diagnosis and Correction
Protocol 4.1: Quantifying System-Induced Background
Objective: Differentiate detector dark noise from system stray light.
- Dark Frame Acquisition: Seal all camera ports. Acquire a 5-minute exposure image at standard operational temperature (e.g., -80°C for InGaAs). Calculate mean pixel value (DNdark) and standard deviation (σdark).
- Stray Light Test: Illuminate the sample chamber with excitation laser (e.g., 808 nm) without any sample or standard. Use identical collection filters. Acquire a 100 ms frame. Calculate mean pixel value (DN_stray).
- Analysis: If
DN_stray > 3 * σ_dark + DN_dark, significant stray light is present. Correct by adding light traps and baffles in the optical path.
Protocol 4.2: Mapping and Minimizing Tissue Autofluorescence
Objective: Identify and reduce endogenous fluorescence sources.
- Spectral Profiling: Anesthetize the animal (e.g., 2% isoflurane). Acquire fluorescence images (ex: 785 nm) across emission bands (900 nm, 1000 nm, 1100 nm) using a tunable filter or a series of long-pass filters. Use identical laser power and exposure.
- Dietary Control: House animals on an alfalfa-free, low-fluorescence diet for a minimum of 7 days prior to imaging. Replace standard bedding with purified cellulose-based bedding.
- Spectral Unmixing: Administer NIR-II fluorophore. Acquire a hyperspectral datacube. Use reference spectra of isolated skin, fur, and muscle (from control animal) to perform linear unmixing, subtracting the autofluorescence component.
Objective: Ensure optimal photon collection and homogeneous illumination.
- Laser Profile Homogenization: Place a NIR-reflective diffuse scatterer (e.g., Spectralon) in the sample plane. Image the excitation spot with a calibrated beam profiler camera. Use a beam-shaping diffuser or lens array to achieve a flat-top profile (uniformity > 85%).
- Eission Path Efficiency Test: Use a standardized fluorescent reference slide (e.g., IR-26 dye in epoxy). Image with all standard filters. Replace with a high-efficiency, broad NIR-II anti-reflective coated lens (e.g., CaF2). Compare signal counts. A >20% increase indicates prior suboptimal transmission.
- Filter Stack Optimization: Ensure all emission filters are placed at a slight angle (e.g., 5-10°) to deflect back-reflections away from the detector. Use bandpass filters instead of long-pass only to reject more excitation bleed-through.
The Scientist's Toolkit: Key Reagent Solutions
Table 2: Essential Research Reagents and Materials for NIR-II Optimization
| Item | Function & Rationale |
|---|---|
| Low-Autofluorescence Diet (e.g., TestDiet AIN-93G Modified) | Eliminates chlorophyll-derived fluorescence from standard rodent chow, drastically reducing gut and skin background. |
| Purified Cellulose Bedding | Replaces corncob or wood chip bedding, which have high lignocellulosic autofluorescence in NIR. |
| NIR-II Reference Standards (e.g., IR-26, IR-1061 in solid matrix) | Provides a stable, reproducible fluorescence source for daily system validation and quantum yield comparisons. |
| Spectralon Diffuse Reflectance Target | Calibrates excitation homogeneity and serves as a non-fluorescent background for system checks. |
| Liquid Phantoms (e.g., Intralipid + India Ink) | Mimics tissue scattering and absorption for pre-clinical validation of SNR under simulated biological conditions. |
| Titanium Dioxide (TiO2) Paint | Used to create non-fluorescent, high-reflectance surfaces inside the imaging chamber to improve light collection efficiency. |
Integrated Correction Protocol Workflow
The final integrated workflow for system optimization.
Diagram Title: Integrated Workflow for NIR-II System Optimization
Table 3: Summary of Diagnoses and Corresponding Fixes
| Root Cause Diagnosis | Immediate Corrective Action | Long-Term Solution |
|---|---|---|
| Tissue Autofluorescence | Switch to low-fluorescence diet 1-week pre-imaging. Use spectral unmixing. | Develop/use fluorophores >1100 nm where tissue absorption increases and autofluorescence decays. |
| System Stray Light | Turn off all ambient lights. Cover ports with blackout cloth. | Install internal baffles, light traps, and use anodized black aluminum inside the imaging box. |
| Detector Dark Noise | Increase detector cooling (if adjustable). Use shorter exposure & average. | Upgrade to deeper-cooled camera or use a detector with lower dark current specification. |
| Poor Optical Throughput | Clean all lens surfaces. Remove unnecessary filters. | Replace optics with AR-coated NIR-II components (CaF2, ZnSe). Use wider aperture collection lenses. |
| Laser Instability | Allow 30-min warm-up. Check power supply connections. | Implement feedback-stabilized laser diode driver. Use fiber-coupled laser with mode scrambler. |
Optimizing Laser Power, Exposure Time, and Filter Sets for Specific Probes
This application note, framed within a broader thesis on establishing a robust NIR-II (1000-1700 nm) fluorescence imaging system for small animal research, details the critical optimization of three interdependent hardware parameters: laser power, exposure time, and filter sets. The choice of these parameters is not universal but is fundamentally dictated by the photophysical properties of the specific NIR-II probe employed. Improper configuration leads to suboptimal signal-to-noise ratio (SNR), increased photobleaching, and potential phototoxicity, compromising quantitative data integrity in longitudinal studies for drug development.
Core Principles of Parameter Optimization
The optimal imaging configuration balances signal intensity against background noise and specimen health. The key relationships are:
- Signal is proportional to Laser Power × Exposure Time × Probe Extinction Coefficient × Quantum Yield.
- Background includes autofluorescence, scattering, and detector dark noise. Filter sets are crucial for its suppression.
- Photobleaching/Phototoxicity increases with Laser Power and total irradiance.
Therefore, optimization requires a probe-specific, iterative approach to maximize SNR while minimizing light dose.
Research Reagent Solutions Toolkit
| Item | Function in NIR-II Imaging |
|---|---|
| NIR-II Fluorophores (e.g., IRDye 800CW, CH-4T, Ag2S QDs, Lanthanide-doped NPs) | Specific probes with defined excitation/emission peaks, quantum yield, and photostability. Dictate optimal laser wavelength and filter selection. |
| Phosphate-Buffered Saline (PBS) | Standard vehicle for preparing probe stock solutions and for in vivo injection dilutions. |
| Matrigel or Tissue-Mimicking Phantoms | Used for in vitro validation of imaging parameters in a scattering medium that simulates tissue. |
| Isoflurane/Oxygen Mixture | Standard anesthetic for maintaining stable physiological conditions during longitudinal small animal imaging sessions. |
| Hair Removal Cream | Critical for preparing mouse skin to reduce optical scattering and absorption, maximizing signal collection from underlying structures. |
| Blackout Box or Chamber | Eliminates ambient light, which is crucial for long exposure times required for some low-quantum-yield probes. |
Quantitative Optimization Guidelines & Data
The following tables summarize general starting points and effects based on current literature and standard probe categories.
Table 1: Filter Set Selection Guide for Common NIR-II Probes
| Probe Type | Example Probes | Recommended Excitation Filter (nm) | Recommended Emission Filter (LP Cut-on, nm) | Rationale |
|---|---|---|---|---|
| Small Organic Dye | IRDye 800CW, CH1055 | 780 ± 10 | 1000, 1200, or 1500 | Block laser scatter; LP 1000 maximizes signal, LP 1500 minimizes tissue autofluorescence. |
| Quantum Dots | Ag2S QDs, PbS/CdS QDs | 808 ± 10 | 1200 or 1300 | Narrow excitation band matches common laser; longer LP cut-on exploits QD emission >1200 nm for high SNR. |
| Lanthanide Nanoparticles | NaYF4:Nd, NaErF4 | 808 ± 10, 980 ± 10 | 1000, 1300, or 1500 | Match specific ion absorption (Nd³⁺@808nm, Er³⁺@980nm). Use appropriate LP to isolate desired emission band. |
| Single-Walled Carbon Nanotubes | (6,5)-SWCNTs | 785 ± 10 | 1100 ± 20 (BP) or LP 1250 | Can use band-pass (BP) filter for specific chirality or LP for broad collection. |
Table 2: Laser Power & Exposure Time Starting Parameters for In Vivo Imaging
| Probe Brightness (Relative QY) | Initial Laser Power (mW/cm²) | Initial Exposure Time (ms) | Adjustment Strategy |
|---|---|---|---|
| High (e.g., Some QDs) | 50 - 100 | 50 - 100 | Start low. Increase power only if SNR is inadequate at max safe exposure time. |
| Medium (e.g., Organic Dyes) | 100 - 200 | 100 - 300 | Typical starting range. Optimize exposure time first, then adjust power incrementally. |
| Low (e.g., Some Lanthanides) | 200 - 400 | 300 - 1000 | Requires higher flux/longer integration. Monitor for heating/bleaching. Use highest sensitivity camera setting. |
Detailed Experimental Protocol: Probe-Specific Parameter Optimization
This protocol describes a systematic method to determine the optimal trio of parameters for a new NIR-II probe in a mouse model.
I. Materials & Pre-Imaging Setup
- NIR-II Imaging System equipped with: tunable or 808 nm laser, cooled InGaAs or SWIR camera, filter wheels with LP filters (1000, 1200, 1300, 1500 nm).
- Probe Solution: NIR-II fluorophore in sterile PBS.
- Animal: Healthy nude mouse (or other appropriate model).
- Anesthesia Setup: Isoflurane vaporizer, induction chamber, nose cones.
- Software: For image acquisition and ROI intensity/SNR analysis.
II. Procedure
Step 1: Baseline System & Background Capture
- Anesthetize the mouse and place it in the imaging chamber without any probe.
- Set the laser to a safe low power (50 mW/cm²), exposure to 100 ms, and emission filter to LP 1000 nm.
- Acquire an image. This is your background reference (Bkg_ref).
- Repeat Step 1.3 with LP 1200, 1300, and 1500 nm filters.
Step 2: In Vivo Probe Administration & Signal Acquisition
- Administer the probe via tail vein injection at a standard dose (e.g., 100-200 µL of 100 µM solution).
- Wait for appropriate circulation time (e.g., 5-10 min for vascular imaging; longer for targeting).
- Position the mouse to image the region of interest (e.g., liver, tumor).
- Initial Acquisition: Use parameters from Table 2 as a starting point based on probe type. Acquire images across all emission filters (LP 1000, 1200, 1300, 1500 nm).
Step 3: Iterative Optimization Loop This loop is performed for each emission filter candidate.
- Fix Exposure Time, Vary Laser Power: Set exposure to a moderate value (e.g., 200 ms). Acquire images at increasing laser powers (e.g., 50, 100, 150, 200 mW/cm²). Keep all other settings identical.
- Analyze SNR: For each image, draw an ROI on the target tissue and an adjacent background tissue. Calculate SNR = (Mean SignalROI - Mean SignalBkg) / Standard Deviation_Bkg.
- Identify Laser Power Knee-of-the-Curve: Plot SNR vs. Laser Power. The point where SNR increase plateaus or signal bleaches indicates the maximum useful power.
- Fix Optimal Power, Vary Exposure Time: Using the power from Step 3.3, acquire images at increasing exposure times (e.g., 50, 100, 200, 500, 1000 ms).
- Identify Exposure Time Knee-of-the-Curve: Plot SNR vs. Exposure Time. Identify the point of diminishing returns.
- Final Check: Acquire a final image series with the optimal {Power, Exposure, Filter} combo. Verify signal stability over 5 consecutive frames to assess acute photobleaching.
Step 4: Filter Set Final Selection
- Compare the maximum achievable SNR from the optimal settings for each emission filter (LP 1000, 1200, etc.).
- Select the filter that yields the highest usable SNR. Note: LP 1500 nm may have higher contrast but lower absolute signal. The choice depends on the experiment's goal (quantification vs. high-contrast delineation).
Workflow & Pathway Visualizations
Optimization Workflow for NIR-II Imaging Parameters
Strategies for Minimizing Tissue Absorption and Scattering Artifacts
Within the broader thesis on optimizing a NIR-II (1000-1700 nm) fluorescence imaging system for small animal research, a primary challenge is mitigating artifacts from tissue absorption and scattering. These phenomena attenuate signal, reduce spatial resolution, and introduce quantitative inaccuracies. This document presents application notes and protocols to minimize these artifacts, leveraging the superior tissue penetration of NIR-II light.
Quantitative Data on Optical Properties
The efficacy of NIR-II imaging is grounded in the reduced interaction of light with biological components in this spectral window. Key data is summarized below.
Table 1: Optical Properties of Tissue Components Across Wavelengths
| Component | Primary Effect | Magnitude at 800 nm | Magnitude at 1300 nm | Notes |
|---|---|---|---|---|
| Hemoglobin | Absorption | High (ε ~ 10^5 M⁻¹cm⁻¹) | Very Low (ε ~ 10^3 M⁻¹cm⁻¹) | Major absorber in visible/NIR-I; minimal impact in NIR-II. |
| Lipids | Absorption & Scattering | Moderate | Characteristic peaks ~1210, 1730 nm | Absorption peaks require spectral filtering between 1100-1400 nm. |
| Water | Absorption | Low | Moderate, increases >1400 nm | Becomes dominant absorber beyond 1500 nm. |
| Tissue Matrix | Scattering (µs') | High (µs' ~ 1.5 mm⁻¹) | Lower (µs' ~ 0.5-0.7 mm⁻¹) | Reduced scattering coefficient significantly improves resolution. |
| Effective Penetration Depth | - | ~1-2 mm | ~3-8 mm | Depth where signal drops to 1/e; highly dependent on tissue type. |
Table 2: Comparison of Fluorophore Performance in NIR-II Windows
| Fluorophore Type | Peak Emission (nm) | Quantum Yield | Absorption Cross-section | Key Advantage for Artifact Reduction |
|---|---|---|---|---|
| Single-Walled Carbon Nanotubes | 1000-1600 | 0.1-1% | High (~10⁵ cm⁻¹) | Extremely narrow emission bands enable spectral unmixing. |
| Rare-Earth Doped Nanoparticles | 1525 (Er³⁺) | 5-10% | Moderate | Sharp emission lines; resist photobleaching for longitudinal studies. |
| Organic Dyes (e.g., IR-1061) | 1064 | <0.1% | High | Fast clearance; suitable for dynamic imaging. |
| Quantum Dots (Ag₂S, PbS) | 1200-1600 | 10-20% | Very High | Bright, tunable emission; surface coating critical for biocompatibility. |
Experimental Protocols
Protocol 1: System Calibration for Scattering Correction
Objective: To characterize and correct for light scattering using phantom-based calibration. Materials: Intralipid-20% (scattering agent), India ink (absorbance agent), agarose, NIR-II fluorescent bead suspension (2 mm diameter). Procedure:
- Phantom Preparation: Create a series of 1% agarose phantoms in PBS with varying Intralipid concentrations (0.5%-4% v/v) to mimic tissue scattering (µs' range: 0.2-2.0 mm⁻¹). Add trace India ink to match background absorption (µa ~ 0.02-0.1 mm⁻¹).
- Embed Beads: Suspend NIR-II fluorescent beads at a fixed depth (e.g., 3 mm) within each phantom before solidification.
- Image Acquisition: Image each phantom using identical system parameters (laser power, exposure time, FOV).
- Point Spread Function (PSF) Modeling: For each bead image, fit the intensity profile to a 2D Gaussian function. Plot the measured Full Width at Half Maximum (FWHM) against the known scattering coefficient.
- Generate Correction LUT: Use the relationship to create a Look-Up Table (LUT) or algorithm to deconvolve scattering blur from in vivo images based on estimated tissue scattering properties.
Protocol 2: Spectral Unmixing for Absorption Artifact Minimization
Objective: To separate target fluorescence signal from background autofluorescence and correct for wavelength-dependent absorption. Materials: Dual-emitting NIR-II nanoparticle (e.g., 1100 nm & 1300 nm), spectrally resolved NIR-II imaging system. Procedure:
- Spectral Characterization: First, acquire the pure emission spectra of your target fluorophore and major tissue autofluorescence (from a non-injected control animal) using the spectrometer mode of your system.
- Dual-Channel Imaging: Administer the nanoparticles to the animal. Acquire in vivo images in at least two distinct, narrow spectral bands (e.g., 1100±20 nm and 1300±20 nm).
- Linear Unmixing: For each pixel, apply a linear unmixing algorithm using the equation:
I_total(λ) = a*S_fluor(λ) + b*S_auto(λ), whereI_totalis the measured intensity,Sare the reference spectra, anda, bare the unmixed contributions. - Absorption Correction: Using the unmixed target signal from the two channels, apply a correction based on the differential water/lipid absorption between the two wavelengths to estimate the "true" fluorescence intensity at the source.
Visualizations
Title: NIR-II Image Artifact Correction Workflow
Title: Artifact Sources and Strategic Mitigation Pathways
The Scientist's Toolkit: Research Reagent Solutions
Table 3: Essential Materials for NIR-II Artifact Reduction Studies
| Item | Function & Rationale |
|---|---|
| Intralipid-20% Emulsion | A standardized scatterer for creating tissue-mimicking phantoms to calibrate imaging systems and model scattering properties. |
| NIR-II Fluorescent Microspheres | Serve as point sources for measuring the system's Point Spread Function (PSF) in scattering media. Critical for deconvolution algorithms. |
| Spectral Libraries (e.g., IR-26 Dye, Tissue Homogenates) | Provide reference emission/absorption spectra for key fluorophores and autofluorescence, required for accurate spectral unmixing. |
| Dual- or Multi-Emissive NIR-II Nanoparticles | Enable internal reference calibration for absorption correction by providing signals at two wavelengths with known intensity ratios. |
| Hematoxylin & Eosin (H&E) Staining Kit | For histological validation. Correlates in vivo NIR-II images with ex vivo tissue structure to confirm artifact correction accuracy. |
| Indocyanine Green (ICG) | Although an NIR-I dye, its tail emission in NIR-II can be used for vascular imaging and as a benchmark for penetration depth comparisons. |
Improving Spatial Resolution and Quantification Accuracy
Within the development of a novel NIR-II (1000-1700 nm) fluorescence imaging system for longitudinal small animal studies, two paramount challenges persist: achieving micrometer-scale spatial resolution in vivo and translating photon counts into accurate, quantitative metrics of probe concentration. This document provides detailed application notes and protocols to address these challenges, which are critical for the broader thesis aim of creating a robust, quantifiable platform for drug development research in oncology, neurology, and inflammation.
Core Principles & Recent Advances
Current literature emphasizes that spatial resolution and quantification accuracy are interdependent. Scattering and absorption by tissue distort both spatial integrity of the signal and its intensity.
Key Advances (2023-2024):
- Super-Resolution Reconstruction: Deep learning models (e.g., U-Net architectures) are now routinely applied to NIR-II images to achieve super-resolution, predicting high-resolution images from low-resolution inputs by training on paired data.
- Radiometric Quantification: The use of dual-channel or ratiometric probes, combined with spectral unmixing algorithms, corrects for depth-dependent signal attenuation.
- Monte Carlo-Based Correction: Open-source software packages enable researchers to simulate photon migration in tissue, creating look-up tables for depth and concentration correction.
Table 1: Comparison of Resolution Enhancement Techniques for NIR-II Imaging
| Technique | Principle | Achievable Resolution (in tissue) | Key Requirement | Impact on Quantification |
|---|---|---|---|---|
| Hardware Deblurring | Optical clearing agents (e.g., glycerol) | Improves from ~40 μm to ~15 μm | Transparent tissue window; invasive | Mixed (reduces scattering but may alter probe environment) |
| Computational Deconvolution | Iterative algorithms (e.g., Richardson-Lucy) | Improves effective resolution by ~1.5-2x | Accurate Point Spread Function (PSF) measurement | Improves accuracy by isolating point sources |
| Deep Learning Super-Resolution | Convolutional Neural Network (CNN) prediction | Can surpass diffraction limit, reporting ~5-10 μm | Large, high-quality paired dataset for training | High risk of hallucinating features; must be validated |
| Structured Illumination | Moiré pattern analysis | ~2x improvement, to ~20 μm | Specialized modulated laser source | Directly improves quantitation by separating signal from background |
Table 2: Methods for Improving Quantification Accuracy
| Method | Measured Parameter | Corrects For | Typical Accuracy Gain | Protocol Complexity |
|---|---|---|---|---|
| External Calibration Phantom | Fluorescence intensity | Camera sensitivity, laser power drift | Low (10-20%) | Low |
| Ratiometric Imaging | Emission Ratio (e.g., 1100nm/1300nm) | Probe concentration, excitation intensity | Medium (20-40%) | Medium (requires specific probes) |
| 3D Monte Carlo Simulation | Calculated Absorption & Scattering | Tissue heterogeneity, depth, organ geometry | High (40-60%) | Very High |
| Hybrid Optical-Ultrasound/X-ray | Co-registered Anatomical Data | Tissue depth, organ boundaries | High (50%+) | High (multi-modal system) |
Detailed Experimental Protocols
Protocol 4.1: System PSF Measurement for Deconvolution
Objective: To empirically determine the Point Spread Function of your NIR-II imaging system for use in computational deblurring.
Materials:
- NIR-II imaging system
- Dilute solution of IR-26 dye or PbS quantum dots
- Coverslip or thin glass capillary tube
- Nano-positioning stage (or precise manual stage)
- Analysis software (ImageJ with DeconvolutionLab2, or MATLAB).
Procedure:
- Sample Preparation: Create a dilute suspension of point-like emitters (e.g., QDs) and allow a sparse distribution to dry on a coverslip.
- Image Acquisition: Using the highest magnification objective/lens, acquire a high-SNR image of several isolated, sub-resolution fluorescent spots. Use exposure times that avoid pixel saturation.
- PSF Extraction: In software, select 10-20 isolated point sources. Align and average their intensity profiles to create a single, high-SNR PSF image.
- Validation: Apply this PSF in a Richardson-Lucy deconvolution algorithm to a test image of a known pattern (e.g., a microfabricated grid). Assess resolution improvement by measuring line profiles.
Protocol 4.2: Ratiometric Quantification of Tumor UptakeIn Vivo
Objective: To accurately quantify the accumulation of a targeted NIR-II probe in a subcutaneous tumor model, correcting for depth and excitation variance.
Materials:
- Mice with subcutaneous xenograft tumors.
- Dual-emission NIR-II probe (e.g., a probe with peaks at 1000 nm and 1300 nm).
- NIR-II imaging system with spectral filtering capability.
- Isoflurane anesthesia setup.
- Image analysis software (LI-COR Image Studio, FIJI).
Procedure:
- Pre-Imaging: Anesthetize the mouse and position it in the imaging chamber. Acquise a pre-injection background image for both emission channels (Ch1: 1000nm, Ch2: 1300nm).
- Probe Administration: Inject the probe via tail vein. Record injection time and exact dose.
- Time-Series Imaging: At defined time points (e.g., 1, 4, 12, 24, 48h), acquire co-registered images in both emission channels using identical exposure times and lamp/laser power.
- Image Processing:
a. Subtract the pre-injection background from all images.
b. Define three Regions of Interest (ROIs): Tumor, contralateral muscle (background), and a major vessel (internal reference).
c. Calculate the mean fluorescence intensity (MFI) in each ROI for both channels.
d. Compute the ratiometric value for the tumor:
R = (MFI_tumor_Ch1 - MFI_muscle_Ch1) / (MFI_vessel_Ch1 - MFI_muscle_Ch1). e. Optional: Compute an internal calibration ratioCh1/Ch2within the tumor to correct for depth-dependent spectral effects. - Quantification: Plot
Rover time. The ratio corrects for variations in systemic circulation and excitation flux, providing a more accurate measure of specific tumor uptake.
The Scientist's Toolkit: Research Reagent Solutions
Table 3: Essential Materials for High-Resolution Quantitative NIR-II Imaging
| Item | Function & Rationale | Example Product/Catalog |
|---|---|---|
| NIR-II Calibration Phantom | Provides stable reference for fluorescence intensity and spatial uniformity across the field of view. Essential for day-to-day system validation. | BioPhantom (PerkinElmer) or in-house agarose phantoms with IR-1061 dye. |
| Optical Clearing Reagent | Temporarily reduces tissue scattering to improve resolution and signal strength for ex vivo or deep tissue imaging. | CUBIC (Clear, Unobstructed Brain/Body Imaging Cocktail), or commercially available agents (e.g., Visikol). |
| Spectral Unmixing Software | Deconvolutes overlapping emissions from multiple probes or autofluorescence, critical for accurate quantification in multiplex studies. | InForm (Akoya), Aivia (Leica), or open-source SCiLS Lab. |
| Dual-Emissive NIR-II Reference Probe | A non-targeted, spectrally distinct probe (e.g., emitting at 1550 nm) used as an internal control to normalize for pharmacokinetic and injection variances. | PEG-coated Ag2S quantum dots (1550 nm emission). |
| Matrigel or Tissue-Mimicking Phantoms | For creating in vitro depth-controlled validation experiments to test quantification algorithms before animal studies. | Corning Matrigel, or silicone-based phantoms with tunable optical properties. |
Visualization Diagrams
Diagram Title: Workflow for Quantitative NIR-II Image Analysis
Diagram Title: Interdependence of Resolution & Quantification
Care, Maintenance, and Environmental Control for Detectors (InGaAs, etc.)
Within the context of a near-infrared II (NIR-II, 1000-1700 nm) fluorescence imaging system for small animal research, the detector is a critical, high-value component. Typically, indium gallium arsenide (InGaAs)-based cameras, either one-dimensional linear arrays or two-dimensional focal plane arrays (FPAs), are employed due to their sensitivity in this spectral region. Their performance, longevity, and signal-to-noise ratio are profoundly influenced by proper care, maintenance, and stringent environmental control. This document outlines application notes and protocols to ensure optimal detector operation, directly impacting the reliability and reproducibility of in vivo biodistribution, pharmacokinetic, and tumor targeting studies in preclinical drug development.
Core Principles of Detector Degradation & Protection
InGaAs detectors are susceptible to performance degradation from several environmental factors:
- Thermal Noise: Dark current doubles approximately every 7-10°C increase in temperature for InGaAs, drastically increasing noise.
- Humidity and Condensation: Moisture can cause corrosion, electrical shorts, and icing on the sensor or window, particularly in cooled detectors.
- Contamination: Particulate matter (dust) and organic films on optical windows attenuate signal and create imaging artifacts.
- Excessive Light Exposure: While less sensitive than silicon to visible light, prolonged exposure to high-intensity light, especially during system warm-up/shutdown, can cause damage or accelerate aging.
Environmental Control Protocols
Temperature Stabilization
Stable, precise cooling is non-negotiable for low-noise NIR-II imaging.
Protocol: Detector Cooling and Temperature Management
- Pre-Start Check: Ensure the chiller unit (if separate) coolant level is adequate and its set point is at least 10°C below the desired detector temperature.
- Power Sequence: Always power on the cooling system (thermoelectric cooler (TEC) controller or cryocooler) before applying high voltage to the detector. Follow manufacturer-recommended power sequences precisely.
- Stabilization: Allow the detector to reach its operating temperature (typically -60°C to -90°C for deep-cooled InGaAs FPAs) and stabilize for a minimum of 30 minutes before acquiring scientific data.
- Monitoring: Log the detector temperature and housing temperature at the start and end of each imaging session. Investigate deviations >2°C from set point.
- Shutdown: Reverse the power sequence: disable high voltage, then turn off cooling, allowing the detector to warm gradually in a dry environment.
Humidity and Purge Gas Control
Preventing condensation is paramount when operating below the dew point.
Protocol: Dry Purge System Maintenance
- Objective: Maintain a positive pressure of dry, inert gas (Nitrogen, N₂, purity >99.99%) within the detector housing.
- Connection: Attach the dry gas source to the purge port on the detector housing using appropriate, clean fittings.
- Flow Regulation: Install a regulated purge gas kit. Use a flowmeter to adjust and maintain a constant, gentle flow (typically 2-5 standard liters per minute). A bubbling check valve can be used to verify positive pressure.
- Purge Duration: Initiate purging at least 1 hour before cooling the detector. Continue purging throughout operation and for 1-2 hours after the detector has fully warmed to ambient post-shutdown.
- Desiccant Check: If the housing contains disposable desiccant cartridges, inspect monthly. Replace if the indicator color shows saturation (e.g., blue to pink).
Maintenance and Cleaning Protocols
Routine Preventive Maintenance
Weekly/Monthly Checklist:
| Task | Frequency | Acceptance Criteria |
|---|---|---|
| Visual inspection of detector window for contamination | Before major session | No visible dust, spots, or film |
| Check purge gas pressure/flow rate | Weekly | Stable, within manufacturer spec |
| Log detector operating temperature & housing temp | Per imaging session | Temp stable within ±1°C |
| Check system for unusual vibrations or sounds | Weekly | No abnormal mechanical noise |
| Verify dark current & read noise values* | Monthly | Values within 10% of baseline |
*See Section 5. Performance Validation Protocol.
Window Cleaning Protocol
Note: Consult manufacturer guidelines. Some windows (e.g., AR-coated) are extremely delicate.
Materials Required: Clean, lint-free gloves, optical-grade compressed air or nitrogen duster, reagent-grade isopropyl alcohol (IPA, 99%+), spectroscopic-grade acetone, lens tissue or polyester swabs (e.g., Texwipe), clean tweezers.
Protocol:
- Power Down: Ensure the detector is off and at ambient temperature.
- Dry Removal: In a clean environment, use a stream of dry, oil-free air or N₂ to blow loose particles from the window surface. Hold the canister upright.
- Wet Cleaning (if necessary): Moisten a fresh lens tissue or swab with a small amount of acetone. Gently wipe the surface in a straight line, using minimal pressure. Discard the tissue/swab.
- Final Polish: Using a fresh tissue/swab lightly moistened with IPA, wipe in a perpendicular direction to the acetone wipe. This removes any acetone residue.
- Inspection: Use a bright, oblique light to check for streaks or remaining particles. Repeat only if essential.
Performance Validation Protocol
Regular quantitative assessment ensures data integrity.
Experiment: Baseline Noise and Sensitivity Measurement
- Dark Current: At operating temperature, acquire a sequence of 100 dark frames with an integration time typical for your experiments (e.g., 100-500 ms). Calculate the mean signal and standard deviation for each pixel. The mean of the standard deviation across the array is the temporal dark noise.
- Linearity: Image a stable, uniform NIR-II light source (e.g., an integrating sphere with a 1550 nm LED) at a series of increasing integration times. Plot mean signal vs. time. The detector response should be linear ((R^2 > 0.99)) up to near-saturation.
- Relative Responsivity: Using the same uniform source and a calibrated optical power meter, measure the signal (in Digital Numbers or counts) per unit of incident power (µW/cm²) at a standard integration time. Track this value over months.
Table 1: Example Performance Benchmark Data for a 320x256 InGaAs FPA (-80°C)
| Parameter | Test Condition | Acceptable Range | Measurement Frequency |
|---|---|---|---|
| Operating Temp | Steady State | Set Point ± 1.0°C | Per Session |
| Dark Current (Mean) | 300 ms, -80°C | < 5000 e-/pixel/s | Monthly |
| Read Noise | 0 ms Integration | < 150 e- rms | Monthly |
| Dynamic Range | From noise floor to 80% full well | > 2000:1 | Quarterly |
| Peak QE @ 1550 nm | Per manufacturer spec | > 70% | Annually (if calibrated) |
The Scientist's Toolkit: Essential Research Reagent Solutions
Table 2: Key Materials for Detector Care & NIR-II Imaging
| Item | Function/Application | Critical Notes |
|---|---|---|
| High-Purity Dry Nitrogen (N₂) Gas | Purging detector housing to prevent condensation and oxidation. | Use a regulated purge kit with a flowmeter. Purity >99.99% is essential. |
| In-Line Desiccant Filter | Further dries purge gas before it enters the detector. | Place between gas source and detector. Regenerate or replace per schedule. |
| Optical Cleaning Kit | For cleaning detector windows and system optics. | Must include glove, lens tissue, swabs, IPA, acetone, and air duster. |
| Stable NIR-II Reference Source | For system calibration and detector responsivity checks. | e.g., Integrating sphere with temperature-stabilized LED at 1300 nm or 1550 nm. |
| Laser Safety Equipment | For systems with NIR-II excitation lasers. | Appropriate OD goggles, interlocks, and beam enclosures for 1064 nm/1319 nm. |
| Vibration Isolation Platform | Stabilizes the imaging platform and detector. | Mitigates microphonic noise in the detector and improves image clarity. |
| Data Acquisition & Control Software | For running performance validation protocols. | Enables automated dark frame acquisition, linearity tests, and analysis. |
System Integration Workflow
Diagram Title: NIR-II Imaging Session & Detector Care Workflow
Signal Integrity Pathway
Diagram Title: Environmental Factors Impact on NIR-II Data Fidelity
Software and Algorithmic Enhancements for Image Analysis
This document details the critical software and algorithmic components required to maximize data fidelity and quantitative output from a NIR-II fluorescence imaging system for preclinical small animal research. Effective analysis of NIR-II data, characterized by superior tissue penetration and reduced autofluorescence, demands specialized computational approaches to translate raw photon counts into biologically relevant metrics.
Core Software Architecture & Preprocessing
Raw NIR-II data requires robust preprocessing to correct for systemic and optical artifacts before quantitative analysis.
Preprocessing Pipeline Protocol
Objective: Convert raw sensor data into a calibrated, analysis-ready image stack. Materials: Raw .tiff or .dat files from NIR-II camera, system spectral calibration file, flat-field/dark-field reference images. Procedure:
- Dark Current Subtraction: For each experimental image
I_exp, subtract the average dark-field imageI_dark(acquired with lens cap on, same exposure time):I_temp = I_exp - I_dark. - Flat-Field Correction: Normalize for non-uniform illumination and pixel sensitivity. Divide
I_tempby the normalized flat-field imageI_flat(acquired using a uniform fluorescent phantom):I_corrected = I_temp / (I_flat / mean(I_flat)). - Spectral Unmixing (if using multiple fluorophores): Apply linear unmixing algorithms. Given a matrix of reference spectra
Sand the acquired multichannel imageM, solveM = S * Cfor concentration matrixCvia non-negative least squares (NNLS) regression. - Geometric and Intensity Calibration: Apply spatial calibration using a ruler phantom and convert pixel values to units of radiance (µW/cm²/sr) using a calibrated light source.
Quantitative Performance Metrics Table
Table 1: Key Software-Correctable Image Quality Metrics in NIR-II Imaging
| Metric | Typical Raw Value | Target Post-Processing Value | Algorithm Used |
|---|---|---|---|
| Signal-to-Noise Ratio (SNR) | 10-30 dB | > 40 dB | Temporal frame averaging, wavelet denoising |
| Spatial Resolution | 20-40 µm (system-limited) | ~15-25 µm (deconvolved) | Richardson-Lucy or Blind Deconvolution |
| Temporal Drift (over 1 hr) | Up to 15% intensity loss | < 3% variation | Reference channel normalization |
| Spectral Bleed-Through | 15-25% for close emitters | < 5% residual | Linear Unmixing (NNLS) |
Advanced Analysis Algorithms
Protocol for Dynamic Contrast-Enhanced (DCE) NIR-II Kinetics
Objective: Quantify pharmacokinetic parameters of targeted NIR-II probes in vivo. Materials: Time-series image stack, region-of-interest (ROI) definitions, arterial input function (AIF) or reference tissue. Procedure:
- ROI Segmentation: Manually or automatically define ROIs over target tissue (tumor), muscle/background, and a major vessel (if possible).
- Time-Activity Curve (TAC) Extraction: Plot mean radiance within each ROI versus time.
- Pharmacokinetic Modeling: Fit TACs to an appropriate model (e.g., two-compartment model) using non-linear least-squares optimization.
- Parameter Extraction: Calculate key parameters: Peak Signal (PS), Time-to-Peak (TTP), and Area Under the Curve (AUC) for semi-quantitative analysis. For model-derived quantitative analysis, extract
K_trans(transfer constant) andv_e(extravascular extracellular volume fraction).
Deep Learning for Segmentation & Denoising
Convolutional Neural Networks (CNNs) address low-SNR and manual segmentation challenges.
Protocol for U-Net-based Organ Segmentation:
- Dataset Preparation: Co-register NIR-II images with high-contrast anatomical scans (e.g., MRI, CT). Manually label organs/tumors to create ground truth masks.
- Model Training: Train a U-Net architecture using a loss function combining Dice loss and cross-entropy. Use data augmentation (rotation, flipping, noise injection).
- Inference & Validation: Apply trained model to new NIR-II data. Validate segmentation accuracy via Dice coefficient against manual segmentation.
Research Reagent & Computational Toolkit
Table 2: Essential Solutions for NIR-II Image Analysis Workflows
| Item / Tool Name | Category | Function in Analysis |
|---|---|---|
| ICG (Indocyanine Green) | Reference Fluorophore | Provides standardized signal for system calibration & pharmacokinetic benchmarking. |
| ThorImage, Living Image | Commercial Software | Turnkey solutions for basic acquisition, ROI analysis, and 3D reconstruction. |
| MATLAB with Image Processing Toolbox | Programming Environment | Custom script development for advanced filtering, unmixing, and kinetic modeling. |
| Python (SciPy, scikit-image, TensorFlow/PyTorch) | Open-Source Platform | Flexible implementation of custom preprocessing pipelines, CNNs, and batch processing. |
| 3D Slicer, Fiji/ImageJ | Visualization & Analysis | Open-source platforms for manual segmentation, volume rendering, and plugin-based analysis. |
| NIR-II Fluorescent Phantoms | Calibration Standard | Agarose or epoxy-based phantoms with embedded fluorophores for flat-field correction and quantification. |
Visualization of Workflows & Pathways
NIR-II Image Analysis Computational Workflow
Two-Compartment Model for NIR-II DCE Kinetics
Benchmarking NIR-II Imaging: Validation Strategies and Comparative Analysis with Other Modalities
Near-infrared window II (NIR-II, 1000-1700 nm) fluorescence imaging has revolutionized in vivo small animal research by providing deep-tissue penetration, high spatial resolution, and reduced autofluorescence. However, the ultimate validation of in vivo NIR-II findings requires correlation with gold-standard ex vivo histological and immunofluorescence (IF) analyses. This protocol details a rigorous workflow to bridge in vivo functional imaging with cellular- and molecular-level ex vivo validation, a critical step for preclinical studies in oncology, neurology, and cardiovascular disease.
A core challenge is maintaining the spatial registration between the in vivo imaging signal and the processed tissue sections. This protocol emphasizes meticulous tissue harvesting, orientation, and embedding to preserve anatomical context. Furthermore, it addresses the specific considerations for tissues from animals injected with NIR-II contrast agents (e.g., rare-earth doped nanoparticles, organic dyes), which may require specialized fixation or sectioning to retain the probe or its signal for correlative analysis.
Experimental Protocols
Protocol 2.1: Animal Preparation & Terminal NIR-II Imaging
Objective: To capture the final in vivo NIR-II signal prior to tissue extraction. Materials: Anesthetized mouse, NIR-II fluorescence imaging system (e.g., equipped with 808 nm or 980 nm laser, InGaAs camera), depilatory cream, sterile PBS. Procedure:
- Ensure the animal is under stable surgical anesthesia (e.g., 2% isoflurane).
- Remove hair from the region of interest (ROI) using depilatory cream. Clean the skin with PBS.
- Position the animal in the NIR-II imager. Acquire a brightfield reference image.
- Acquire NIR-II fluorescence images using appropriate excitation/emission filters for your probe (e.g., 808 nm ex, 1000 nm long-pass emission filter).
- Critical Step: Capture an image with a millimeter-scale ruler or fiducial markers placed next to the ROI. This is essential for later size-correction with histology.
- Euthanize the animal via an approved method (e.g., cervical dislocation under deep anesthesia, CO₂ overdose) immediately following image acquisition.
Protocol 2.2: Tissue Harvesting and Processing for Correlation
Objective: To harvest the target organ/tissue while preserving its in vivo spatial orientation and fluorescence. Materials: Dissection tools, 4% Paraformaldehyde (PFA) in PBS, optimal cutting temperature (O.C.T.) compound, isopentane, dry ice, plastic biopsy cryomolds. Procedure:
- Rapidly perform a gross necropsy to expose the target tissue.
- Orientation: Before excision, use sutures or tissue marking dye to mark a specific anatomical orientation (e.g., superior pole of a tumor).
- Excise the tissue intact with minimal manipulation. Rinse briefly in PBS.
- For fluorescence retention: For some probes, flash-freeze a portion of tissue directly in O.C.T. by submerging the mold in isopentane cooled by dry ice. This preserves the NIR-II probe distribution for potential ex vivo NIR-II imaging of the block face or section.
- For histology/IF: Fix the primary portion in 4% PFA for 24-48 hours at 4°C, then transfer to 30% sucrose in PBS for 48 hours (cryoprotection). Embed in O.C.T. and freeze as in step 4.
- Store blocks at -80°C.
Protocol 2.3: Cryosectioning and Slide Preparation
Objective: To generate tissue sections suitable for H&E staining and immunofluorescence, mapped to the in vivo image. Materials: Cryostat, charged glass slides, PBS. Procedure:
- Allow the O.C.T. block to equilibrate in the cryostat chamber (-20°C) for 30 minutes.
- Trim the block until the full tissue face is exposed.
- Sectioning for Mapping: Take sequential sections at a defined thickness (e.g., 5-10 µm). Place every 5th section on a separate slide for H&E staining to reconstruct the 3D anatomy.
- Record Keeping: Note the exact section number and its approximate depth from the block surface. This log is crucial for 3D reconstruction.
- Air-dry slides for 30 minutes, then store at -80°C or process immediately.
Protocol 2.4: Immunofluorescence Staining
Objective: To stain for specific biomarkers (e.g., CD31 for vasculature, F4/80 for macrophages, Cytokeratin for tumor cells) adjacent to the H&E-stained section. Materials: Acetone or ice-cold methanol, blocking buffer (5% normal serum, 1% BSA in PBS), primary antibodies, Alexa Fluor-conjugated secondary antibodies (e.g., AF488, AF555, AF647), Hoechst 33342 or DAPI, mounting medium. Procedure:
- Fix slides in pre-chilled acetone for 10 minutes at -20°C. Air dry.
- Circle the tissue with a hydrophobic barrier pen.
- Rehydrate and block with blocking buffer for 1 hour at room temperature (RT).
- Incubate with primary antibody diluted in blocking buffer overnight at 4°C.
- Wash 3x with PBS for 5 minutes each.
- Incubate with fluorophore-conjugated secondary antibody and nuclear stain (e.g., DAPI) for 1 hour at RT in the dark.
- Wash 3x with PBS.
- Mount with antifade mounting medium and apply a coverslip.
Protocol 2.5: Image Registration and Correlation Analysis
Objective: To digitally overlay the in vivo NIR-II image with the ex vivo H&E and IF images. Materials: Image analysis software (e.g., ImageJ/Fiji, commercial co-registration software). Procedure:
- Scale Alignment: Using the ruler from the in vivo image, set the scale (pixels/mm) for all images.
- Landmark-Based Registration: Identify at least 3 corresponding, unambiguous anatomical landmarks (e.g., tissue edge bifurcations, major vessel branch points) in the in vivo NIR-II image and the photograph of the O.C.T. block face or a low-magnification brightfield image of the first section.
- Use software to apply a rigid or affine transformation to align the in vivo image to the ex vivo geometry.
- Apply the same transformation matrix to the original high-resolution NIR-II image.
- Manually align sequential H&E and IF images from the same block using the DAPI or tissue outline as a guide, creating a 2D mosaic or 3D stack.
- Perform quantitative region-of-interest (ROI) analysis: Draw ROIs based on histological features (e.g., tumor core, invasive margin) and extract mean NIR-II fluorescence intensity from the registered in vivo image.
Data Presentation
Table 1: Example Quantitative Correlation Data from a Tumor Targeting Study
| Animal ID | In Vivo NIR-II TBR (Tumor/Muscle) | Ex Vivo IF: %CD31+ Area (Tumor Core) | Ex Vivo IF: Mean F4/80 Intensity (Tumor Margin) | Histological Tumor Area (mm²) |
|---|---|---|---|---|
| Mouse 1 | 5.2 ± 0.3 | 12.5% ± 2.1% | 155.2 ± 18.7 AU | 28.4 |
| Mouse 2 | 3.8 ± 0.2 | 8.7% ± 1.5% | 210.5 ± 22.3 AU | 22.1 |
| Mouse 3 | 6.1 ± 0.4 | 15.3% ± 3.0% | 98.7 ± 15.6 AU | 31.6 |
| Control | 1.1 ± 0.1 | 4.2% ± 0.8% | 45.3 ± 9.4 AU | N/A |
TBR: Target-to-Background Ratio; AU: Arbitrary Units.
Table 2: Key Research Reagent Solutions
| Item | Function in Validation Protocol | Example/Notes |
|---|---|---|
| NIR-II Contrast Agent | Generates the primary in vivo signal to be validated. | PbS/CdS quantum dots, IR-1061 dyes, rare-earth nanoparticles (e.g., NaYF₄:Yb,Er). |
| Tissue Marking Dye | Provides visual orientation landmarks on excised tissue for spatial registration. | Tissue marking dye (various colors), sterile surgical sutures. |
| O.C.T. Compound | Water-soluble embedding medium for cryosectioning; preserves tissue morphology and antigenicity. | Must be compatible with planned stains. |
| Primary Antibodies | Bind specifically to cellular biomarkers for immunofluorescence validation. | Anti-CD31 (vasculature), Anti-F4/80 (macrophages), Anti-Cytokeratin (epithelial cells). |
| Alexa Fluor Secondaries | Highly fluorescent, photostable conjugates for multiplex IF detection. | Use AF488, AF555, AF647 to avoid spectral bleed-through into NIR channels. |
| Antifade Mountant | Preserves fluorescence signal during microscopy and storage. | Should contain DAPI or be compatible with Hoechst for nuclear counterstain. |
| Image Co-registration Software | Aligns multi-modal images based on landmarks or intensity. | ImageJ with plugins (TurboReg, bUnwarpJ), commercial packages (e.g., Visiopharm, HALO). |
Visualization Diagrams
Title: NIR-II to Histology Correlation Workflow
Title: Image Registration and Overlay Process
1. Introduction Within the thesis framework of establishing a robust NIR-II (1000-1700 nm) fluorescence imaging system for longitudinal small animal studies, quantitative validation is paramount. This protocol details the generation of standard curves and the determination of sensitivity limits (e.g., limit of detection - LOD, limit of quantification - LOQ) for system characterization. These metrics are essential for translating raw fluorescence signal into quantitative, reporter concentration data, enabling accurate biodistribution and pharmacokinetic analysis in drug development.
2. Research Reagent Solutions The following materials are critical for performing the quantitative validation.
| Item | Function & Specification |
|---|---|
| NIR-II Fluorescent Agent | The standard (e.g., IRDye 800CW, IR-12N3, Ag2S quantum dots). Must be chemically stable and have a known absorption/emission profile in the NIR-II window. |
| PBS (1X), pH 7.4 | Sterile, particle-free phosphate-buffered saline for serial dilution of the fluorophore to prevent aggregation and precipitation. |
| Matte Black Microplate | 96-well or 384-well plates with minimal autofluorescence to reduce background signal and well-to-well crosstalk during imaging. |
| Precision Micropipettes | For accurate serial dilution (e.g., P10, P100, P1000). |
| Calibrated Absorbance Spectrophotometer | For independent verification of stock fluorophore concentration (via Beer-Lambert law) prior to dilution series preparation. |
3. Protocol: Generation of Standard Curves & Sensitivity Analysis
3.1. Preparation of Fluorophore Dilution Series
- Using the stock fluorophore solution (concentration verified by absorbance measurement), perform a serial dilution in PBS to create a minimum of 8 concentrations spanning at least 3 orders of magnitude (e.g., from 1 µM to 1 nM).
- Pipette a consistent volume (e.g., 100 µL) of each concentration and a PBS-only blank into separate wells of the matte black microplate. Use triplicate wells per concentration for statistical rigor.
- Seal the plate to prevent evaporation and protect from light until imaging.
3.2. Image Acquisition on NIR-II System
- Power on the NIR-II imaging system (laser excitation, InGaAs camera) and allow it to stabilize for 30 minutes.
- Set acquisition parameters to values standard for in vivo imaging: excitation laser power (e.g., 100 mW/cm²), exposure time (e.g., 100-500 ms), camera gain, and appropriate emission filters matching the fluorophore.
- Place the microplate in the imaging chamber. Acquire images for all wells using the defined parameters. Ensure no pixel saturation occurs in the highest concentration wells.
3.3. Data Analysis & Curve Fitting
- Using the system's analysis software, define identical Regions of Interest (ROIs) for each well.
- Record the mean fluorescence intensity (MFI) for each ROI. Subtract the average MFI of the PBS blank wells to generate background-corrected values.
- Calculate the mean and standard deviation (SD) of the triplicate measurements for each concentration.
- Plot the background-corrected MFI (y-axis) against the known fluorophore concentration (x-axis) using scientific graphing software. Perform a linear regression (y = mx + b) on the linear portion of the data. The coefficient of determination (R²) should be >0.99.
3.4. Determination of Sensitivity Limits Sensitivity limits are calculated from the standard curve data.
| Metric | Calculation Method | Description |
|---|---|---|
| Limit of Detection (LOD) | LOD = 3.3 * (σ/S) | The lowest concentration distinguishable from background. σ = SD of the blank response; S = slope of the standard curve. |
| Limit of Quantification (LOQ) | LOQ = 10 * (σ/S) | The lowest concentration that can be reliably quantified with acceptable precision and accuracy. |
| Linear Dynamic Range | From LOQ to the point where signal deviates from linearity by >10%. | The concentration range over which quantitative measurements are valid. |
4. Data Presentation: Representative Validation Results The following table summarizes hypothetical but representative data from the validation of an NIR-II imaging system using IRDye 800CW.
Table 1: Standard Curve Data and Derived Sensitivity Metrics
| Fluorophore Concentration (nM) | Mean Fluorescence Intensity (a.u.) | SD (a.u.) | CV (%) |
|---|---|---|---|
| 0 (Blank) | 105.2 | 3.1 | 2.9 |
| 1 | 118.5 | 4.7 | 4.0 |
| 5 | 165.8 | 5.2 | 3.1 |
| 10 | 225.1 | 6.9 | 3.1 |
| 50 | 855.3 | 25.6 | 3.0 |
| 100 | 1620.7 | 48.6 | 3.0 |
| 500 | 8015.4 | 240.5 | 3.0 |
| 1000 | 15980.1 | 479.4 | 3.0 |
Derived Parameters:
- Standard Curve Equation: y = 15.95x + 110.5 (R² = 0.9998)
- LOD: 0.64 nM
- LOQ: 1.94 nM
- Linear Dynamic Range: ~2 nM to 2000 nM
5. Experimental Workflow & Logical Framework
Standard Curve & Sensitivity Workflow
Role of Validation in NIR-II Research
This application note is framed within the broader thesis objective of establishing and validating a robust NIR-II (1000-1700 nm) fluorescence imaging system for longitudinal, non-invasive studies in small animal models. The transition from established modalities like NIR-I (700-900 nm), bioluminescence imaging (BLI), and magnetic resonance imaging (MRI) to NIR-II requires a clear, quantitative understanding of their respective capabilities and limitations. This document provides a comparative analysis and detailed protocols to guide researchers in selecting the appropriate modality for specific biomedical research and drug development applications.
Comparative Performance Data
Table 1: Core Performance Characteristics of In Vivo Imaging Modalities
| Parameter | NIR-I Fluorescence (700-900 nm) | NIR-II Fluorescence (1000-1700 nm) | Bioluminescence (BLI) | Magnetic Resonance Imaging (MRI) |
|---|---|---|---|---|
| Signal Origin | Exogenous fluorophore emission | Exogenous fluorophore emission | Endogenous luciferase-luciferin reaction | Proton (¹H) spin relaxation |
| Excitation Source | External light (e.g., 785 nm laser) | External light (e.g., 808 nm, 980 nm laser) | None (substrate injection only) | Magnetic field & radiofrequency pulses |
| Penetration Depth | Moderate (~1-3 mm for high resolution) | High (~3-8 mm, up to >1 cm) | High (limited by light scattering) | Excellent (whole body) |
| Spatial Resolution | ~2-3 mm (in vivo) | ~20-50 µm (in vivo, sub-surface) | ~3-5 mm (in vivo) | 50-100 µm (preclinical) |
| Temporal Resolution | Seconds to minutes (real-time possible) | Seconds to minutes (real-time possible) | Minutes (signal integration needed) | Minutes to hours |
| Quantitative Accuracy | Moderate (affected by tissue attenuation) | High (reduced scattering & autofluorescence) | High (low background, linear relationship) | High (excellent for anatomy & physiology) |
| Molecular Sensitivity | High (pM-nM) | Very High (pM-nM, improved SBR) | Extremely High (fM-pM, zero background) | Low (mM for contrast agents) |
| Key Advantages | Wide probe availability, established protocols | Deep tissue, high-resolution, low background | Ultra-high sensitivity, no autofluorescence | Excellent anatomical/functional soft tissue contrast |
| Key Limitations | Tissue scattering, autofluorescence, shallow depth | Limited commercial probe library, specialized equipment | Requires genetic modification, not anatomical | Low molecular sensitivity, high cost, slow imaging |
Table 2: Quantitative Comparison of Signal-to-Background Ratio (SBR) & Resolution
| Experiment Model | NIR-I SBR | NIR-II SBR | Improvement Factor (NIR-II/NIR-I) | Achievable Resolution (NIR-II) |
|---|---|---|---|---|
| Subcutaneous Tumor | ~3.2 | ~12.5 | ~3.9x | ~200 µm |
| Brain Vessels (Through Skull) | ~1.5 | ~6.8 | ~4.5x | ~30 µm |
| Artery Angiography | ~2.1 | ~10.2 | ~4.9x | ~50 µm |
| Lymph Node Mapping | ~4.0 | ~15.8 | ~4.0x | ~150 µm |
Experimental Protocols
Protocol 1: NIR-II Fluorescence Imaging of Tumor Vasculature in Mice
- Objective: Visualize tumor-associated blood vessels with high spatial resolution.
- Materials: NIR-II imaging system (InGaAs camera, 808 nm laser, 1300 nm LP filter), ICG or IRDye 800CW PEG (or approved NIR-II fluorophore like CH-4T), nude mouse with subcutaneous xenograft tumor (~5 mm diameter), anesthesia setup (isoflurane), heating pad, saline.
- Procedure:
- Anesthetize mouse using 2-3% isoflurane and maintain at 1-2% during imaging. Place on heated stage (37°C).
- Fluorophore Administration: Inject fluorophore (e.g., 200 µL of 100 µM ICG in saline) via tail vein.
- Image Acquisition: Position mouse in imaging chamber. Set laser power to 80 mW/cm², exposure time to 100-200 ms. Acquire dynamic images immediately post-injection for 5-10 minutes (vascular phase), then at 24h for targeted accumulation.
- Data Analysis: Use system software to draw regions of interest (ROI) over tumor and background tissue. Calculate SBR = (Mean Tumor Signal) / (Mean Background Signal). Generate time-intensity curves.
Protocol 2: Cross-Validation of Tumor Burden Using NIR-II and Bioluminescence
- Objective: Correlate NIR-II probe accumulation with BLI signal from tumor cells.
- Materials: Firefly luciferase-expressing tumor cell line (e.g., 4T1-luc), D-luciferin substrate, NIR-II tumor-targeting probe (e.g., peptide-conjugated fluorophore), NIR-II imager, BLI imager (CCD camera).
- Procedure:
- Establish tumors in mice using 4T1-luc cells.
- Day 1 - BLI: Inject D-luciferin (150 mg/kg, i.p.). Anesthetize and acquire BLI image 10 minutes post-injection. Quantify total flux (photons/sec).
- Day 2 - NIR-II: Inject the NIR-II targeting probe (2 nmol, i.v.). Acquire NIR-II images at 24h post-injection. Quantify tumor ROI signal.
- Analysis: Perform linear regression analysis between BLI flux (Day 1) and NIR-II signal intensity (Day 2) across a cohort of mice (n≥5) to establish correlation.
Protocol 3: MRI and NIR-II Co-Imaging for Anatomical Localization
- Objective: Overlay high-sensitivity NIR-II molecular data onto high-resolution anatomical MRI.
- Materials: Preclinical MRI system, T2-weighted sequences, NIR-II imager, gadolinium-based MRI contrast agent (optional), NIR-II fluorophore.
- Procedure:
- Acquire baseline anatomical MRI scan of the mouse (e.g., T2-weighted RARE sequence).
- Allow animal to recover. Administer NIR-II fluorophore (i.v.) and incubate per protocol.
- Acquire NIR-II fluorescence image at designated time point.
- Image Co-Registration: Use multi-modal image analysis software (e.g., AMIRA, 3D Slicer). Manually or automatically align anatomical landmarks (e.g., spine, organ outlines) from the MRI and bright-field/NIR-II images to create a fused overlay.
The Scientist's Toolkit: Research Reagent Solutions
| Item | Function & Application |
|---|---|
| IRDye 800CW PEG | A commercial, stable NIR-I fluorophore; serves as a benchmark for comparing NIR-II agent performance. |
| CH-4T (or similar D-A-D dye) | A classic small-molecule organic fluorophore emitting in the NIR-II window; used for vascular imaging and particle synthesis. |
| PbS/CdS Quantum Dots | Semiconductor nanocrystals with tunable NIR-II emission; offer high brightness but require careful toxicity assessment. |
| Lanthanide Nanoparticles (Er³⁺, Nd³⁺) | Rare-earth-doped particles with long-lived NIR-II emission; useful for time-gated imaging to eliminate autofluorescence. |
| D-Luciferin, Potassium Salt | The standard substrate for firefly luciferase; essential for generating BLI signal in genetically engineered models. |
| Gadolinium-Based Contrast Agent (e.g., Gd-DOTA) | T1-shortening agent for MRI; provides contrast in angiography and perfusion studies. |
| Matrigel | Basement membrane matrix; used for consistent subcutaneous tumor cell implantation. |
| Isoflurane | Volatile inhalation anesthetic; standard for prolonged imaging sessions in rodents due to rapid induction/recovery. |
Visualized Workflows and Pathways
Title: Thesis Workflow for NIR-II Imaging System Validation
Title: Core Signal Generation Pathways for Each Modality
Within the framework of a thesis focused on establishing a robust NIR-II (1000-1700 nm) fluorescence imaging system for preclinical small animal research, a critical evaluation of key performance metrics is essential. This analysis directly informs system design, reagent selection, and experimental protocol development, impacting the accuracy and translational value of data in oncology, neuroscience, and drug development.
Comparative Analysis of Imaging Modalities
The selection of an imaging modality involves trade-offs. The table below quantifies the core metrics for common in vivo imaging techniques relative to NIR-II fluorescence.
Table 1: Quantitative Comparison of In Vivo Imaging Modalities
| Modality | Penetration Depth (in tissue) | Spatial Resolution | Approximate System Cost (USD) | Throughput (Temporal Resolution) | Key Limitation for Small Animal Imaging |
|---|---|---|---|---|---|
| NIR-II Fluorescence | 5-10 mm | 20-50 µm | $150,000 - $300,000 | High (seconds-minutes) | Requires exogenous contrast agents. |
| NIR-I Fluorescence | 1-3 mm | 2-10 µm | $80,000 - $200,000 | High (seconds-minutes) | High tissue scattering/autofluorescence. |
| Bioluminescence | N/A (Surface-weighted) | 3-5 mm | $50,000 - $150,000 | Low (minutes-hours) | Poor spatial resolution; requires substrate. |
| Micro-CT | Whole body | 50-100 µm | $200,000 - $500,000 | Low (minutes) | Ionizing radiation; poor soft-tissue contrast. |
| Micro-MRI | Whole body | 50-100 µm | $500,000 - $1,000,000 | Very Low (minutes-hours) | Very high cost; low throughput. |
| Photoacoustic | 4-7 cm | 50-200 µm | $200,000 - $400,000 | Medium (minutes) | Limited by optical diffusion depth. |
Application Notes & Protocols
Protocol: Evaluating NIR-II Probe Penetration DepthIn Vivo
Objective: Quantify the maximum detectable depth of a NIR-II fluorophore (e.g., IRDye 800CW, CH-4T) in tissue-mimicking phantoms and in vivo.
Materials: See Scientist's Toolkit. Procedure:
- Phantom Preparation: Create a series of agarose phantoms (1-2% w/v) with varying concentrations of Intralipid (0.5-2%) and Indian ink to mimic tissue scattering and absorption.
- Depth Calibration: Embed a capillary tube filled with a known concentration (e.g., 100 µM) of NIR-II probe at measured depths (1-12 mm) within the phantom.
- Imaging Acquisition: Place phantom in the NIR-II imaging system. Acquire images using consistent parameters: Laser power (e.g., 50 mW/cm²), exposure time (e.g., 100-500 ms), and appropriate NIR-II long-pass filters (e.g., 1250 nm LP).
- Signal Analysis: Use region-of-interest (ROI) analysis to plot mean fluorescence intensity (MFI) vs. depth. Define the penetration depth as the depth where the signal-to-noise ratio (SNR) drops below 3.
- In Vivo Validation: Anesthetize a tumor-bearing mouse. Administer probe via tail vein. Acquire sequential images over time. Using 3D reconstruction software, estimate tumor depth via co-registration with micro-CT/MRI and correlate with fluorescence signal intensity.
Protocol: Spatial Resolution Calibration of NIR-II System
Objective: Measure the spatial resolution of the NIR-II imaging system under realistic conditions.
Materials: USAF 1951 resolution target, fluorescent microsphere slide (e.g., 1 µm diameter, NIR-II emitting). Procedure:
- Direct Measurement: Place the USAF target in the imaging plane. Illuminate with diffuse NIR light. Acquire an image. The smallest clearly resolvable element group gives the limiting resolution in line pairs per mm.
- Fluorescent Point Spread Function (PSF): Image a slide with sparse, sub-resolution NIR-II fluorescent microspheres. Use a high magnification lens.
- Analysis: Use image analysis software (e.g., ImageJ) to plot the intensity profile across a single microsphere. Fit the data to a Gaussian function. The Full Width at Half Maximum (FWHM) of this curve is the measured system resolution.
Workflow: Integrated Throughput for Drug Efficacy Study
Diagram Title: Workflow for NIR-II Drug Efficacy Study
The Scientist's Toolkit: Key Research Reagent Solutions
Table 2: Essential Materials for NIR-II Small Animal Imaging
| Item | Function & Rationale |
|---|---|
| NIR-II Fluorophores (e.g., CH-4T, IRDye 800CW, Ag2S QDs) | Exogenous contrast agents that emit light in the 1000-1700 nm window, minimizing scattering and autofluorescence for deeper, clearer imaging. |
| Targeted Probes (e.g., cRGD-CH1055) | Fluorophores conjugated to peptides or antibodies for specific molecular targeting (e.g., of tumor integrins). |
| Animal Anesthesia System (Isoflurane/O2) | Provides stable, reversible anesthesia for longitudinal imaging, minimizing motion artifact and stress. |
| NIR-II Optical Filters (1250 nm, 1500 nm LP) | Critical for blocking excitation laser light and NIR-I fluorescence, isolating the true NIR-II signal. |
| Calibration Phantoms (IR cards, fluorescent beads) | Ensure day-to-day system performance consistency and allow for quantitative intensity measurements. |
| Hair Removal Cream | Non-invasive method to remove fur, which severely scatters and attenuates NIR light. |
| Image Analysis Software (e.g., LI-COR Image Studio, FIJI/ImageJ) | Enables ROI analysis, signal quantification, 3D reconstruction, and colocalization studies. |
System Setup & Signal Pathway
Diagram Title: NIR-II Imaging Signal Pathway
Decision Logic for Modality Selection
Diagram Title: Logic for Choosing Imaging Modality
Within the context of a thesis on developing an NIR-II fluorescence imaging system for small animal research, the integration of this modality with anatomical imaging techniques like Computed Tomography (CT) or Ultrasound (US) is critical. This synergy provides quantitative, deep-tissue functional and molecular data (via NIR-II) co-registered with high-resolution anatomical context (via CT/US), enabling superior longitudinal tracking of disease progression, drug biodistribution, and therapeutic efficacy in preclinical models.
Application Notes
1. NIR-II/CT for Orthopedic and Pulmonary Research: Combining NIR-II fluorescence with micro-CT is indispensable for bone and lung studies. CT provides exquisite 3D bone morphology or lung structure, while NIR-II probes highlight areas of active osteogenesis, tumor metastasis, or inflammation. This is vital for studying bone regeneration implants or lung cancer models.
2. NIR-II/US for Abdominal and Cardiovascular Dynamics: The real-time, non-ionizing nature of ultrasound makes it ideal for integrating with NIR-II imaging for cardiovascular and abdominal studies. US visualizes blood flow and soft tissue anatomy, while NIR-II signals report on vascular leakage, tumor angiogenesis, or immune cell recruitment with high temporal resolution.
3. Quantitative Co-Registration for Pharmacokinetics/Pharmacodynamics (PK/PD): Multi-modal integration allows for the precise localization of fluorescently labeled drug carriers (NIR-II) within specific organs delineated by CT. This enables accurate region-of-interest (ROI) analysis for quantifying drug accumulation and clearance rates, a cornerstone of drug development.
Experimental Protocols
Protocol 1: NIR-II Fluorescence and Micro-CT Co-Imaging for Tumor Metastasis
Objective: To longitudinally monitor liver metastasis from a subcutaneous primary tumor using an NIR-II-labeled targeting agent and correlate fluorescence with anatomical change.
Materials:
- NIR-II Imaging System (e.g., customized 1064 nm laser, InGaAs cameras).
- Micro-CT scanner.
- Nude mouse model with orthotopic or subcutaneous tumor.
- NIR-II fluorescent probe (e.g., CH1055-PEG-cRGD, ~1 mg/mL in PBS).
- Isoflurane anesthesia system.
- Heating pad.
- Image co-registration software (e.g., AMIRA, 3D Slicer).
Procedure:
- Animal Preparation: Anesthetize mouse with 2% isoflurane. Place in sternal recumbency on a heated multimodal imaging stage.
- Baseline CT Scan: Acquire a whole-body micro-CT scan (parameters: 50 kVp, 600 μA, 200 ms exposure, 360° rotation).
- NIR-II Probe Administration: Administer 100 μL of probe solution via tail vein injection.
- Time-Point NIR-II Imaging: At predetermined time points (e.g., 1, 4, 24, 48 h post-injection), acquire NIR-II fluorescence images (Ex: 1064 nm, Em: 1100-1700 nm, exposure: 100-500 ms).
- Endpoint CT & Ex Vivo Validation: At study endpoint (e.g., 72 h), acquire a final co-registered CT and NIR-II scan. Euthanize the animal, excise organs (liver, spleen, kidneys, tumor), and image ex vivo for validation.
- Image Processing & Analysis:
- Reconstruct 3D CT volumes.
- Apply spectral unmixing to NIR-II images if needed.
- Use fiducial markers or mutual information algorithms in co-registration software to spatially align NIR-II and CT datasets.
- Draw ROIs on CT-defined organs to quantify mean NIR-II fluorescence intensity.
Protocol 2: NIR-II and High-Frequency Ultrasound for Cardiac Imaging
Objective: To assess myocardial perfusion and inflammation using a NIR-II vascular agent concurrently with Doppler ultrasound.
Materials:
- NIR-II Imaging System.
- High-frequency ultrasound system with Doppler capability (e.g., Vevo 3100).
- Mouse model of myocardial infarction.
- NIR-II blood pool agent (e.g., IRDye 800CW PEG, ~1 mg/mL).
- ECG/respiratory gating equipment.
- Depilatory cream.
Procedure:
- Animal Prep: Anesthetize mouse. Remove chest hair using depilatory cream. Secure mouse on a heated platform with integrated ECG leads.
- Baseline US: Apply ultrasound gel. Acquire B-mode, M-mode, and Doppler images of the heart in parasternal long-axis view. Record ejection fraction and cardiac output.
- NIR-II Agent Injection: Inject 50 μL of NIR-II agent intravenously.
- Simultaneous Dynamic Imaging: Immediately initiate simultaneous NIR-II video-rate imaging (10-30 fps) and contrast-enhanced ultrasound cine loops.
- Longitudinal Imaging: Repeat combined imaging sessions at days 1, 3, and 7 post-infarction.
- Analysis: Co-register US and NIR-II images using the heart's anatomical boundaries. Correlate areas of reduced blood flow on Doppler with regions of delayed NIR-II agent arrival or clearance.
Data Presentation
Table 1: Comparison of Multi-Modal Integration Strategies
| Parameter | NIR-II / CT Integration | NIR-II / Ultrasound Integration |
|---|---|---|
| Primary Application | Oncology (metastasis), Osteology, Pulmonary research | Cardiology, Abdominal imaging, Lymphatic research |
| Spatial Resolution | ~10-100 μm (CT dominant) | ~50-200 μm (US dominant) |
| Temporal Resolution | Low-Minutes (CT scan time) | High-Seconds to Real-Time (US) |
| Depth Penetration | Excellent (CT), Good (NIR-II: up to 5-10 mm) | Good (US: 1-3 cm), Good (NIR-II) |
| Key Quantitative Output | Tumor-to-background ratio (TBR) in CT-defined volumes | Fluorescence intensity vs. Doppler flow velocity curves |
| Primary Advantage | Perfect hard-tissue anatomy + molecular targeting | Real-time physiology + dynamic contrast enhancement |
| Main Challenge | Radiation dose, sequential imaging requiring animal movement | Acoustic coupling, operator dependency for co-registration |
Table 2: Example NIR-II Probe Properties for Multi-Modal Studies
| Probe Name/Type | Excitation (nm) | Emission (nm) | Target/Application | Typical Dose (IV) |
|---|---|---|---|---|
| CH1055-PEG-cRGD | 1064 | 1100-1350 | αvβ3 Integrin (Tumor Angiogenesis) | 2-3 mg/kg |
| IR-12N Dye | 980 | 1050-1400 | Blood Pool Imaging | 1.5 mg/kg |
| Lanthanide Nanoprobes | 808 or 980 | 1525 | Lymph Node Mapping | 100 μL of 0.5 mg/mL |
| Ag2S Quantum Dots | 808 | 1200-1600 | Sentinel Lymph Node Biopsy | 200 pmol |
Visualization
Title: NIR-II Multi-Modal Imaging Workflow
The Scientist's Toolkit
Table 3: Essential Research Reagents & Materials
| Item | Function & Explanation |
|---|---|
| NIR-II Fluorophores | Molecular reporters emitting >1000 nm light. Provide deep tissue penetration and low autofluorescence for high-contrast imaging. |
| Multi-Modal Imaging Stage | Customizable, heated animal holder compatible with both NIR-II and CT/US systems. Ensures consistent positioning for accurate co-registration. |
| Isoflurane Anesthesia System | Delivers precise, maintained gas anesthesia for stable longitudinal imaging sessions. |
| Fiducial Markers | Contain both CT-dense (e.g., iodine) and NIR-II fluorescent materials. Placed near animal to provide reference points for automated image alignment. |
| Co-Registration Software | (e.g., AMIRA, Living Image, 3D Slicer). Algorithms align 2D NIR-II and 3D CT/US volumes into a single coordinate space for analysis. |
| High-Frequency Ultrasound Probe | (e.g., 40-70 MHz). Provides anatomical and Doppler flow images of superficial structures in small animals with high resolution. |
| ECG/Respiratory Gating Module | Synchronizes image acquisition with heart and breathing cycles, crucial for motion-free cardiac and thoracic imaging. |
| Spectral Unmixing Software | Separates the specific NIR-II probe signal from autofluorescence or other background emissions, improving quantification accuracy. |
Conclusion
Implementing a robust NIR-II fluorescence imaging system provides a transformative tool for non-invasive, deep-tissue visualization in small animal models, offering superior penetration and spatial resolution over traditional optical methods. Success hinges on a solid understanding of foundational principles, meticulous execution of methodological protocols, proactive system optimization, and rigorous cross-validation. As NIR-II probe chemistry advances and system accessibility increases, this technology is poised to become a standard in preclinical pipelines, accelerating drug discovery and our fundamental understanding of disease pathophysiology. Future directions will likely focus on the clinical translation of NIR-II imaging agents and the development of real-time, high-throughput surgical guidance systems.