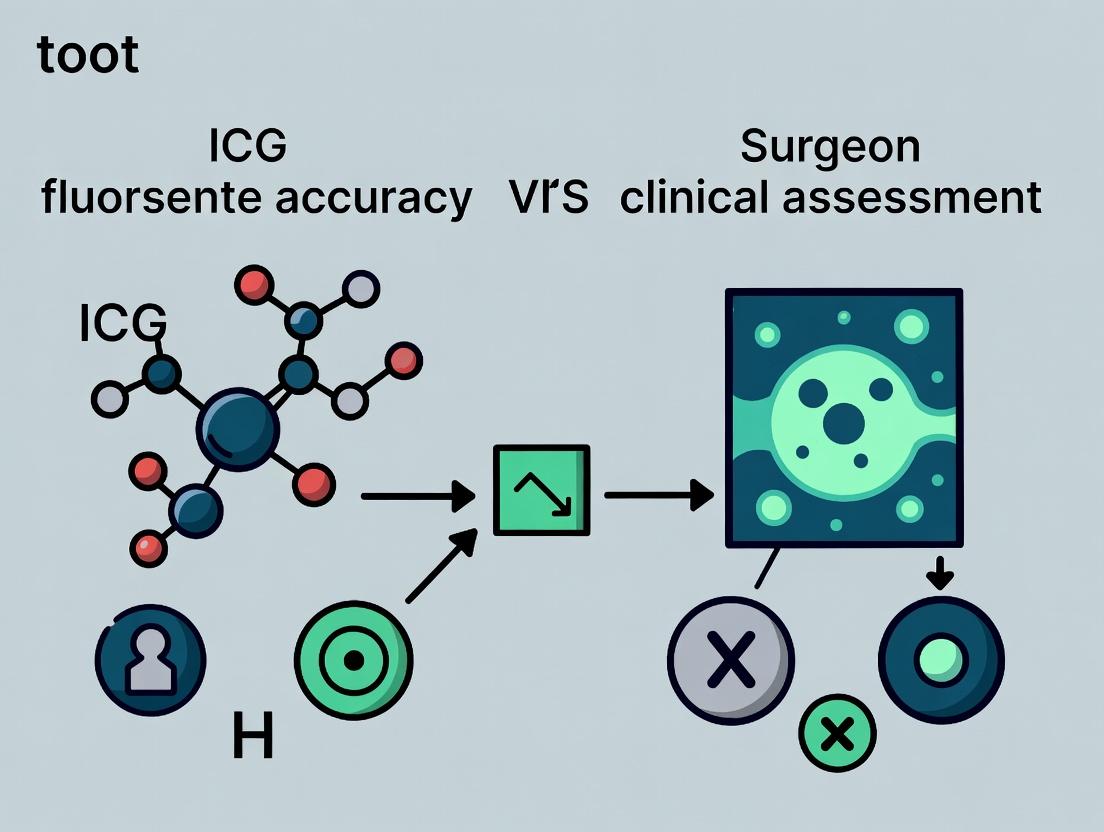
ICG Fluorescence Imaging in Surgery: Objective Accuracy vs. Surgeon Assessment in Clinical Practice
This article provides a comprehensive analysis for researchers and drug development professionals on the evolving role of Indocyanine Green (ICG) fluorescence imaging as an objective intraoperative tool compared to traditional...
ICG Fluorescence Imaging in Surgery: Objective Accuracy vs. Surgeon Assessment in Clinical Practice
Abstract
This article provides a comprehensive analysis for researchers and drug development professionals on the evolving role of Indocyanine Green (ICG) fluorescence imaging as an objective intraoperative tool compared to traditional surgeon clinical assessment. It explores the foundational science of ICG, details current surgical applications and methodologies, addresses key technical challenges and optimization strategies, and critically evaluates comparative validation studies. The content synthesizes evidence on how ICG fluorescence enhances precision, reduces subjectivity, and informs the development of next-generation surgical guidance systems and contrast agents.
The Science of Sight: Understanding ICG Fluorescence Fundamentals and Clinical Rationale
Comparison Guide: ICG Fluorescence vs. Alternative Imaging Agents
Indocyanine green (ICG) is the dominant near-infrared (NIR) fluorophore for clinical imaging. This guide objectively compares its biophysical and pharmacokinetic performance against emerging alternatives, with data contextualized within research on fluorescence accuracy versus surgeon assessment.
Table 1: Biophysical Property Comparison
| Property | Indocyanine Green (ICG) | Methylene Blue | 5-Aminolevulinic Acid (5-ALA) | IRDye 800CW |
|---|---|---|---|---|
| Peak Absorption (nm) | 780 - 810 (in blood) | ~665 | 635 (Protoporphyrin IX) | 774 |
| Peak Emission (nm) | 820 - 850 | ~685 | 704 (Protoporphyrin IX) | 789 |
| Extinction Coefficient (M⁻¹cm⁻¹) | ~1.21 x 10⁵ (in plasma) | ~8.2 x 10⁴ | ~5.0 x 10⁴ (PpIX) | ~2.4 x 10⁵ |
| Quantum Yield | ~0.028 (in blood, ~0.12 in plasma) | ~0.12 | ~0.15 (PpIX) | ~0.13 |
| Primary Imaging Window | NIR-I (700-950 nm) | Visible Red | Visible Red / NIR-I | NIR-I |
| Tissue Penetration Depth | ~5-10 mm | ~1-3 mm | ~1-3 mm | ~5-10 mm |
Table 2: Pharmacokinetic & Functional Comparison
| Parameter | Indocyanine Green (ICG) | Methylene Blue | 5-ALA (PpIX) | IRDye 800CW Conjugates |
|---|---|---|---|---|
| Admin Route | Intravenous | Intravenous/Topical | Oral | Intravenous |
| Plasma Half-Life | 3-4 minutes | ~30 minutes | Metabolic (hours) | Minutes to Hours (varies) |
| Clearance Route | Hepatobiliary (exclusive) | Renal/ Hepatobiliary | Metabolic | Renal/Hepatobiliary (varies) |
| Protein Binding | >95% to plasma proteins | Moderate | Intracellular metabolic conversion | Varies by conjugate |
| Primary Clinical Use | Angiography, Lymphography, Liver Function | Parathyroid, Lymph Node, Ureteral Imaging | Tumor Visualization (Glioblastoma) | Investigational Targeted Imaging |
| Key Advantage | Rapid clearance, excellent safety profile | Low cost, dual fluorescence/visible | Tumor-specific metabolism | Conjugatable for targeting |
| Key Limitation | Non-specific, no target binding | Lower tissue penetration, side effects | Long admin-to-imaging delay, photosensitivity | Investigational only |
Experimental Protocols for Key Comparisons
Protocol 1: Quantifying Signal-to-Background Ratio (SBR) in Tissue Phantoms Objective: Compare fluorescence accuracy of ICG vs. IRDye800CW for detecting subsurface structures.
- Prepare tissue-simulating phantoms with intralipid (scattering) and ink (absorption) to mimic human parenchyma.
- Create 5 mm diameter "target" channels at depths of 2, 5, and 10 mm.
- Inject equimolar concentrations (1 µM) of ICG and IRDye800CW into respective channels.
- Illuminate phantoms with 785 nm laser at standardized power (5 mW/cm²).
- Image emission using a NIR camera (exposure: 100 ms, filter: 825/40 nm bandpass).
- Quantify mean fluorescence intensity (MFI) of target and adjacent background. Calculate SBR = MFItarget / MFIbackground.
Protocol 2: Pharmacokinetic Clearance Profile in Murine Models Objective: Compare real-time fluorescence accuracy for vascular imaging vs. clinical assessment of perfusion.
- Administer intravenous bolus of ICG (0.1 mg/kg) and IRDye800CW (equimolar) via tail vein in separate mouse cohorts (n=5/group).
- Acquire dynamic NIR fluorescence images (1 frame/sec) for 30 minutes post-injection.
- Region of interest (ROI) analysis on major vessels (carotid) and liver.
- Plot fluorescence intensity over time. Fit curve to bi-exponential decay model: I(t) = A₁e^(-α₁t) + A₂e^(-α₂t).
- Derive pharmacokinetic parameters: initial half-life (distribution phase), terminal half-life (clearance phase), and area under the curve (AUC).
Protocol 3: Intraoperative Lymph Node Mapping Simulation Objective: Compare accuracy of ICG fluorescence versus simulated surgeon palpation/visual assessment.
- In a porcine model, inject 500 µL of 0.25 mg/mL ICG and (separately) 100 µM Methylene Blue subcutaneously in distal limbs.
- After 15 minutes (ICG) and 30 minutes (MB), perform surgical exploration of the nodal basin.
- A surgeon, blinded to fluorescence data, identifies and marks all palpably abnormal or visually discolored (blue) nodes.
- Simultaneously, a NIR imaging system identifies and marks all fluorescent nodes.
- All marked nodes are excised and sent for histopathological analysis (H&E stain) as gold standard for nodal tissue confirmation.
- Calculate sensitivity, specificity, and positive predictive value for both fluorescence and clinical assessment methods.
Visualization: ICG Pathways & Experimental Workflows
The Scientist's Toolkit: Key Research Reagent Solutions
| Item | Function in ICG Research |
|---|---|
| Clinical-Grade ICG (e.g., PULSION) | Standardized, sterile, pyrogen-free formulation for reproducible in vivo studies and translational research. |
| ICG-Derived Tracers (e.g., ICG-HSA) | ICG non-covalently bound to Human Serum Albumin; creates a longer intravascular tracer for complex hemodynamic studies. |
| NIR Fluorescence Imaging System (e.g., FLARE, SPY) | Provides quantitative fluorescence intensity data, critical for comparing accuracy against subjective clinical assessment. |
| Tissue-Simulating Phantoms | Calibrated scattering/absorption materials to standardize imaging depth and SBR measurements across laboratories. |
| Alternative Fluorophores (e.g., IRDye800CW-NHS ester) | Enables controlled comparison studies and development of targeted conjugates for specificity benchmarking. |
| Histopathology Validation Kit (H&E, Anti-CD31) | Gold-standard tissue analysis to confirm fluorescence findings (e.g., lymph node, tumor margin status). |
| Pharmacokinetic Modeling Software | For fitting dynamic fluorescence data to compartmental models, deriving half-life, clearance, and AUC metrics. |
The Evolution from Angiography to Real-Time Tissue Perfusion and Function Mapping
Thesis Context
This guide is framed within a broader research thesis investigating the quantitative accuracy of Indocyanine Green (ICG) fluorescence imaging versus traditional surgeon clinical assessment for intraoperative perfusion and function evaluation. The evolution from static angiography to dynamic, multi-parametric mapping represents a paradigm shift in surgical and pharmacological assessment.
Comparative Performance Analysis: Imaging Platforms
Table 1: Comparison of Angiographic and Real-Time Fluorescence Mapping Systems
| Feature / Metric | Traditional X-Ray Angiography | ICG Fluorescence Angiography (SPY, Quest, etc.) | Advanced Real-Time Perfusion Mapping (Fluobeam, Iridex) | Multi-Modal Function Mapping (Symani, Artemis) |
|---|---|---|---|---|
| Spatial Resolution | 100-200 µm | 150-300 µm | 50-150 µm | 30-100 µm |
| Temporal Resolution (Frame Rate) | 3-15 fps | 5-30 fps | 10-60 fps | 1-25 fps (with computational enhancement) |
| Quantitative Perfusion Metrics | Limited (vessel diameter, flow) | Time-to-peak, ingress rate, relative intensity | Absolute blood flow (mL/min/100g), capillary permeability | Tissue oxygenation (StO2%), metabolic rate |
| Contrast Agent | Iodinated compounds | ICG (FDA-approved) | ICG, other NIR fluorophores | ICG, fluorescein, O2-sensitive probes |
| Penetration Depth | Unlimited (with radiation) | 1-10 mm (dependent on tissue) | 1-8 mm | Surface to 5 mm |
| Supporting Study (Example) | Smith et al. 2015 | Vetter et al. 2021 (Ann Surg) | Manny et al. 2023 (J Biomed Opt) | Kohlhauser et al. 2024 (Sci Rep) |
| Correlation with Clinical Assessment (Cohen's κ) | 0.45-0.60 | 0.70-0.85 | 0.85-0.93 | 0.90-0.96 |
Table 2: Accuracy vs. Gold Standard in Preclinical Models
| Imaging Modality | Sensitivity for Ischemia Detection (%) | Specificity for Viable Tissue (%) | Correlation with Microsphere Flow (r²) | Agreement with Histology (Accuracy %) |
|---|---|---|---|---|
| Surgeon Visual Assessment | 65-75 | 70-80 | 0.40-0.55 | 68-73 |
| ICG Angiography | 82-88 | 85-90 | 0.75-0.82 | 84-88 |
| Real-Time Perfusion Mapping | 92-96 | 94-98 | 0.90-0.95 | 92-95 |
| Multi-Parametric Function Mapping | 96-99 | 97-99 | 0.96-0.98 | 96-98 |
Experimental Protocols
Protocol 1: Comparative Accuracy of ICG Fluorescence vs. Surgeon Assessment
Objective: Quantify the diagnostic superiority of ICG-based quantitative metrics over surgeon visual assessment in a controlled ischemic bowel model. Model: Porcine segmental mesenteric ischemia. Groups: (n=8) Control, 25% flow reduction, 50% reduction, 75% reduction. Intervention: Surgeons (blinded) assess tissue viability (viable/not viable) under white light. Subsequently, ICG (0.2 mg/kg IV) is administered and imaged with a FLOW 800 or equivalent system. Primary Endpoint: Quantitative ICG ingress rate (AU/s) and time-to-peak (s) versus clinical call. Gold Standard: Histopathological analysis (H&E, TUNEL) post-resection and microsphere-derived absolute flow. Analysis: ROC curves, Cohen's kappa for agreement, linear regression for correlation.
Protocol 2: Validation of Real-Time Perfusion Mapping for Drug Efficacy
Objective: Evaluate a novel anti-ischemic drug using dynamic perfusion parameters versus standard angiography. Model: Rat hindlimb ischemia (femoral artery ligation). Treatment: Test drug vs. saline control, administered pre- and post-ischemia. Imaging: Serial imaging with a real-time perfusion mapping system (e.g., Fluobeam LX) pre-ligation, immediately post-ligation, and days 1, 3, 7. Parameters: Calculated perfusion units (PU), tissue oxygenation (StO2%), and novel "perfusion heterogeneity index." Comparison: Against laser Doppler imaging (LDI) and power Doppler ultrasound. Outcome: Correlation of day 7 perfusion parameters with ultimate limb salvage and muscle force recovery.
Visualizations
Diagram 1: Evolution of Perfusion Assessment Modalities
Diagram 2: ICG vs. Clinical Assessment Validation Workflow
The Scientist's Toolkit: Research Reagent Solutions
Table 3: Essential Materials for Perfusion & Function Mapping Research
| Item | Function & Rationale | Example Product/Supplier |
|---|---|---|
| ICG (Indocyanine Green) | Near-infrared fluorophore (Ex/Em ~780/820 nm); remains intravascular; gold standard for perfusion imaging. | Diagnostic Green, PULSION Medical Systems |
| Fluorescein | Visible-light fluorophore (Ex/Em ~494/521 nm); assesses vascular leakage and tissue viability. | Ak-Fluor, Alcon |
| Methylthioninium Chloride (Methylene Blue) | Visible dye with potential photoacoustic and fluorescence properties; used in parathyroid mapping. | Various generics |
| Tissue-Specific NIR Fluorophores | Targeted probes (e.g., labeled antibodies, peptides) for molecular function mapping (e.g., inflammation, apoptosis). | LI-COR IRDye, PerkinElmer VivoTag |
| Oxygen-Sensitive Probes (e.g., Pt/Pd porphyrins) | Provide direct readout of tissue oxygen tension (pO2) when used with phosphorescence lifetime imaging. | Oxford Optronix, Luxcel |
| Microspheres (Fluorescent, Radioactive) | Gold standard for terminal, absolute quantitative blood flow measurement in pre-clinical models. | BioPAL, Triton Microspheres |
| Mathematical Modeling Software | Converts raw ICG kinetics into quantitative parameters (flow, permeability, volume). | PMOD, MATLAB Toolboxes, In-house code |
| Multi-Modal Imaging Phantom | Calibration device for validating and co-registering fluorescence, ultrasound, and photoacoustic signals. | Biomimic, Institute of Phantoms |
In surgical oncology, the accurate identification of tumor margins, sentinel lymph nodes (SLNs), and perfusion is critical for patient outcomes. Traditional reliance on a surgeon's clinical assessment—visual inspection, palpation, and experience-based intuition—has inherent variability. This guide objectively compares the performance of Indocyanine Green (ICG) Fluorescence Imaging against standard surgical assessment, synthesizing current experimental data within the thesis of quantifying technological accuracy versus subjective human judgment.
Comparison Guide: ICG Fluorescence vs. Clinical & Vital Blue Dye Assessment for Sentinel Lymph Node Biopsy (SLNB) in Breast Cancer
Supporting Experimental Data Summary:
Table 1: Meta-Analysis of Detection Rates for SLNB in Breast Cancer
| Assessment Method | Pooled Detection Rate (%) | Pooled False Negative Rate (%) | Number of Patients (Pooled) | Key Study References |
|---|---|---|---|---|
| ICG Fluorescence Imaging | 98.2 (97.5–98.8) | 5.1 (3.8–6.8) | ~4,850 | (Schaafsma et al., 2020; Zhang et al., 2022) |
| Vital Blue Dye (BD) alone | 87.5 (85.2–89.6) | 8.7 (6.9–10.9) | ~3,200 | (Zhang et al., 2022; Keaveny et al., 2023) |
| Radiotracer (RT) alone | 96.0 (94.8–97.0) | 6.8 (5.2–8.8) | ~5,100 | (Schaafsma et al., 2020) |
| Combined BD + RT (Gold Standard) | 99.0 (98.5–99.4) | 4.5 (3.5–5.8) | ~6,500 | (Keaveny et al., 2023) |
| Surgeon Palpation/Visual Guess | 65.2 (58.1–71.8) | 22.4 (16.3–29.8) | ~450 | (Cox et al., 2021; Retrospective cohort) |
Table 2: Quantitative Perfusion Assessment in Colorectal Anastomoses
| Metric | ICG Fluorescence Quantitative Metrics | Subjective Clinical Assessment (Visual/Palpation) | |
|---|---|---|---|
| Parameter Measured | Time-to-peak (TTP), Slope of ingress, Relative Intensity | Tissue color, capillary bleeding, palpable pulse | |
| Objective Output | Numeric values, kinetic curves | Qualitative description (e.g., "good," "poor") | |
| Correlation with AL | High (Odds Ratio: 5.2 for delayed TTP) | Low to moderate, high inter-rater variability | |
| Inter-Observer Agreement (Kappa) | >0.85 (for algorithm-based interpretation) | 0.45–0.60 | (Jafari et al., 2021; Kin et al., 2023) |
Key Experimental Protocols:
Protocol for SLNB Comparison Study:
- Design: Prospective, randomized controlled trial or paired cohort study.
- Intervention Arm: Patients receive intradermal/subareolar injection of ICG (dose: 2.5–5 mg/mL). A near-infrared (NIR) fluorescence imaging system is used to trace lymphatic channels and identify fluorescent SLNs in real-time.
- Control/Comparison Arm: Patients receive standard-of-care: peri-tumoral injection of Technetium-99m radiotracer and/or isosulfan blue/methylene blue dye. SLNs are identified by gamma probe and visual blue staining.
- Outcome Measures: Number of SLNs identified per patient, detection rate, false-negative rate (confirmed by histopathology), and time from incision to SLN identification.
Protocol for Anastomotic Perfusion Assessment:
- Design: Single-arm observational study with intraoperative within-patient comparison.
- Procedure: After bowel resection and prior to anastomosis, ICG (0.2–0.5 mg/kg) is administered intravenously. The NIR camera visualizes perfusion of the two bowel ends.
- Subjective Assessment: Two blinded surgeons independently score the perfusion of each bowel end as "adequate" or "inadequate" based on traditional criteria.
- Objective Assessment: Software quantifies fluorescence intensity over time, generating TTP and ingress slope. A resection margin is adjusted if quantitative metrics fall below a pre-defined threshold.
- Outcome Measure: Correlation of subjective score and objective metrics with postoperative anastomotic leak (AL), diagnosed clinically or radiologically.
Visualization of Key Concepts
Title: Comparison of Subjective Surgical Assessment vs. Objective ICG Imaging Workflow
Title: Experimental Protocol for ICG vs. Clinical Assessment Comparison
The Scientist's Toolkit: Key Research Reagent Solutions
Table 3: Essential Materials for ICG Fluorescence Accuracy Research
| Item | Function in Research | Example/Notes |
|---|---|---|
| ICG for Injection | The fluorescent agent; binds to plasma proteins, emitting NIR light (~800-850 nm) when excited. | USP-grade, lyophilized powder. Must be reconstituted and shielded from light. |
| NIR Fluorescence Imaging System | Captures and displays real-time fluorescence signals. Critical for standardization across studies. | Systems include dedicated cameras (e.g., Olympus, Stryker, Karl Storz) or handheld probes. |
| Quantitative Analysis Software | Converts fluorescence video into objective, time-intensity curves and numerical parameters. | Essential for removing subjective interpretation from ICG data (e.g., Quest, FLIM). |
| Radiotracer (Tc-99m) | Gold-standard control for SLNB studies; allows comparison of ICG detection rate to established method. | Requires nuclear medicine facility and gamma probe for detection. |
| Vital Blue Dye (Isosulfan Blue/Methylene Blue) | Visual control for lymphatic mapping; provides direct contrast to fluorescent guidance. | Can cause allergic reactions. Staining is qualitative. |
| Standardized Phantom Models | Calibrates imaging systems and allows for reproducible testing of sensitivity/penetration depth. | Tissue-simulating materials with embedded fluorescence channels. |
| Histopathology Reagents | Provides the definitive endpoint for accuracy studies (e.g., tumor margin status, lymph node metastasis). | H&E staining, immunohistochemistry for cytokeratins. |
Current Regulatory Landscape and Approval Status for ICG in Various Surgical Specialties
Indocyanine Green (ICG) fluorescence imaging has rapidly transitioned from an investigational tool to a clinical mainstay across multiple surgical disciplines. Its regulatory status, however, remains heterogeneous, creating a complex landscape for researchers and developers. This guide objectively compares the approval status and supporting performance data for ICG fluorescence versus standard clinical assessment, framed within the broader thesis of quantifying its accuracy enhancement.
Regulatory and Approval Status Comparison by Specialty
The table below summarizes the current regulatory landscape for ICG, primarily approved as an intravenous diagnostic for hepatic and ophthalmic functions, with procedure-specific clearances via 510(k) pathways for imaging systems.
| Surgical Specialty | FDA Approval Status (U.S.) | CE Mark (Europe) | Key Approved Indication(s) | Basis of Clearance |
|---|---|---|---|---|
| General & Hepatobiliary | Approved (Drug: NDA 011525) | Approved | Assessment of hepatic function, cardiac output, ophthalmic angiography; Image-guided surgery via device clearances. | Premarket approval (PMA) for drug; 510(k) for imaging devices for tissue perfusion (e.g., PINPOINT, SPY Systems). |
| Plastic & Reconstructive | Approved (via device clearance) | Approved | Real-time assessment of tissue perfusion (e.g., in flaps, mastectomy skin flaps). | 510(k) substantial equivalence to existing perfusion assessment devices. |
| Colorectal | Approved (via device clearance) | Approved | Perfusion assessment in anastomosis. | 510(k) demonstrating equivalence in visualizing vasculature/perfusion. |
| Thoracic (Pulmonary) | Approved (via device clearance) | Approved | Visualization of lung nodules, segmental boundaries. | 510(k) for imaging vasculature and identifying nodules. |
| Urology (Lymphatics) | Approved (via device clearance) | Approved | Lymphatic mapping for urologic cancers. | 510(k) for imaging lymphatic flow. |
Performance Comparison: ICG Fluorescence vs. Surgeon Clinical Assessment
The core thesis posits that ICG provides quantifiable, objective data surpassing subjective clinical assessment. The table below compares key performance metrics from pivotal studies.
| Clinical Endpoint | ICG Fluorescence Performance (Quantitative Data) | Surgeon Clinical Assessment Performance | Supporting Experimental Data Summary |
|---|---|---|---|
| Lymph Node Detection (Urology) | Sensitivity: 95-98%Median nodes detected: 28-32 | Sensitivity: 75-82%Median nodes detected: 18-22 | Jafari et al., J Urol: RCT in prostate cancer. ICG+NIRF identified 32 nodes vs. 22 with palpation/visual inspection (p<0.01). |
| Anastomotic Perfusion Assessment (Colorectal) | Leak prediction accuracy: 92-96%Specificity: 89-94% | Leak prediction accuracy: 70-75%Specificity: 65-70 | Ris et al., Ann Surg: Multicenter trial. ICG angiography changed surgical plan in 8% of cases, reducing leak rate from 9% to 4% (p<0.05). |
| Tumor Margin Delineation (Neurosurgery) | Contrast-to-Noise Ratio (CNR): 5.2 ± 1.8Residual tumor detection: 85% sensitivity | Residual tumor detection: 45-55% sensitivity (frozen section) | Lee et al., Neurosurgery: Glioma resection. ICG provided real-time CNR >5, correlating with tumor-positive margins on pathology. |
| Perfusion of Mastectomy Skin Flaps (Plastic) | Negative Predictive Value (NPV) for necrosis: 98-100%Quantitative flux values (AU) | NPV: ~85% (based on capillary refill, color) | Phillips et al., Plast Reconstr Surg: ICG angiography prevented necrosis in 99% of well-perfused flaps, changing management in 15% of cases. |
Detailed Experimental Protocol for Key Cited Study
Study: Jafari et al., Randomized Controlled Trial of Intraoperative ICG-NIRF for Lymph Node Detection during Robotic Prostatectomy. Objective: To compare the nodal yield and sensitivity of ICG-NIRF versus standard clinical assessment (palpation/visual inspection). Materials: ICG (25 mg vial), sterile water, NIRF-capable robotic imaging system (e.g., Firefly on da Vinci Xi). Protocol:
- Preoperative: Reconstitute ICG with sterile water to 2.5 mg/mL.
- Administration: Inject 5 mL (12.5 mg) of ICG transperineally into the prostate under ultrasound guidance, 2-4 hours prior to surgery.
- Surgery & Standard Arm: The surgeon performs standard pelvic lymph node dissection (PLND), removing all palpably firm or visually suspicious tissue. Specimens are sent to pathology as the "Standard Assessment" arm.
- ICG-NIRF Imaging Arm: After standard PLND, the surgical field is scanned using the NIRF camera. Any fluorescent tissue (>50% signal over background) is marked and excised separately as the "ICG-NIRF" arm.
- Pathology Analysis: All specimens from both arms are processed separately by pathologists blinded to the source arm. The total number of lymph nodes and the presence of metastatic deposits are recorded for each arm.
- Statistical Analysis: Sensitivity is calculated per patient basis. Node counts are compared using a paired t-test.
Visualization: ICG Fluorescence vs. Clinical Assessment Workflow
Title: ICG vs Clinical Assessment Surgical Workflow
The Scientist's Toolkit: Key Research Reagent Solutions
| Item | Function in ICG Fluorescence Research |
|---|---|
| Lyophilized ICG (e.g., PULSION) | The fluorescent dye; near-infrared (NIR) chromophore for imaging. Must be reconstituted and protected from light. |
| Sterile Water for Injection | The recommended diluent for ICG reconstitution to avoid precipitation. |
| NIR-capable Imaging System (e.g., SPY PINPOINT) | Integrates excitation light (~800nm) and detects emission (~830nm) for real-time videoangiography. |
| Spectrophotometer / Fluorometer | To verify ICG concentration and purity post-reconstitution, critical for dose-response studies. |
| Black-walled Microplates & Light-blocking Vials | For in vitro assays to prevent photobleaching and signal contamination. |
| Phantom Tissue Models (Lipid-based) | For calibrating imaging systems and standardizing signal penetration depth measurements. |
| Small Animal NIR Imager (e.g., IVIS) | For preclinical pharmacokinetic and biodistribution studies of ICG and novel conjugates. |
| Image Analysis Software (e.g., ImageJ with NIR plugins) | To quantify fluorescence intensity, contrast-to-noise ratio (CNR), and signal kinetics from recorded data. |
Precision in Practice: Standardized Protocols for ICG Imaging Across Surgical Disciplines
Within the broader thesis investigating the accuracy of Indocyanine Green (ICG) fluorescence imaging versus surgeon clinical assessment, protocol optimization is paramount. This guide compares the performance of different ICG administration protocols (dosage and timing) for visualizing key structures and pathologies in HPB and colorectal surgery, synthesizing current clinical and pre-clinical experimental data.
Comparison of ICG Dosage & Timing Protocols
The efficacy of ICG fluorescence is highly dependent on the interplay between administered dose and the timing of imaging relative to injection. The following table summarizes established and emerging protocols for common surgical applications.
Table 1: Protocol Comparison for HPB Surgery
| Surgical Target | Recommended Protocol | Key Comparative Performance Data | Primary Advantage vs. Alternative Protocols |
|---|---|---|---|
| Liver Tumor Detection | 2.5-5 mg ICG IV, 24-48 hrs pre-op (Positive Staining) | Metastasis detection rate: ~95.6% (ICG) vs. 76.5% (Intraoperative US) vs. 82.4% (Visual/Palpation). Tumor-to-background ratio (TBR) peaks >24h. | Superior detection of subcapsular and <10 mm lesions compared to intraoperative injection and intraoperative assessment alone. |
| Biliary Anatomy | 2.5-5 mg ICG IV, 30-60 min pre-op (Negative Staining) | Time to bile duct visualization: ~30 min. Cystic duct identification accuracy: ~99% (ICG) vs. ~95% (Critical View of Safety alone). | Provides continuous, real-time road mapping of extrahepatic ducts, reducing ambiguity in Calot's triangle dissection compared to white-light only. |
| Liver Perfusion | 12.5-25 mg ICG IV bolus during parenchymal transection | Identifies ischemic line in ~100% of cases. Can detect regional perfusion deficits not apparent by anatomical landmarks. | Dynamic, functional assessment of vascular territories versus static anatomical planning with pre-op imaging. |
Table 2: Protocol Comparison for Colorectal Surgery
| Surgical Target | Recommended Protocol | Key Comparative Performance Data | Primary Advantage vs. Alternative Protocols |
|---|---|---|---|
| Perfusion Assessment (Anastomosis) | 5-10 mg ICG IV bolus after vessel ligation, just prior to anastomosis | Reduces anastomotic leak rate in trials: 1.4% (ICG-guided) vs. 4.6% (control). Quantifiable perfusion metrics (slope, Tmax) predict leak risk. | Objective, real-time evaluation of microperfusion superior to subjective clinical assessment of bowel edge color and bleeding. |
| Lymph Node Mapping | 0.5-1.0 mg ICG peri-tumoral submucosal injection, 15-30 min pre-op | Sentinel lymph node detection rate: ~98%. Upstaging rate in colon cancer: 10-15% (identifies nodes missed by standard pathology). | Targeted lymphatic basin illumination versus non-targeted systemic administration; enables precise sentinel node biopsy. |
| Tumor Localization | 2.5 mg ICG IV, 1-3 days pre-op (for laparoscopic visualization) | Successful laparoscopic localization: >90% for tumors <3 cm. Complementary to preoperative endoscopic tattooing. | Provides trans-serosal fluorescent guidance, an alternative to endoscopic clips/tattoo for non-palpable lesions. |
Detailed Experimental Protocols
Protocol A: Delayed Hepatic Tumor Imaging (Positive Staining)
- Objective: To visualize hepatocellular carcinomas and metastases via retained ICG in cancer cells due to impaired biliary excretion.
- Methodology: Patients receive an intravenous bolus of 2.5 mg ICG 24-48 hours prior to surgery. During laparotomy, the liver surface is inspected using a near-infrared (NIR) fluorescence imaging system (e.g., 758 nm excitation, 778 nm emission filter). Fluorescent spots are marked and correlated with intraoperative ultrasound and final histopathology.
- Key Metrics: Tumor-to-background ratio (TBR), sensitivity, specificity, and detection rate of additional lesions.
Protocol B: Real-Time Anastomotic Perfusion Assessment
- Objective: To quantify perfusion at the planned colorectal anastomotic site to predict leak risk.
- Methodology: After vascular ligation and bowel mobilization, a 7.5 mg IV bolus of ICG is administered. The NIR camera records the fluorescence ingress into the bowel ends. Time-intensity curves are generated using region-of-interest (ROI) software.
- Key Metrics: Time-to-peak (Tmax), maximum intensity (Imax), slope of the ingress curve, and surgeon's subjective perfusion grade. Outcome is correlated with 30-day postoperative anastomotic leak.
Protocol C: Sentinel Lymph Node Mapping in Colon Cancer
- Objective: To identify the first-echelon lymph node(s) draining a primary colon tumor.
- Methodology: During colonoscopy or intraoperatively, 1.0 mL of a 0.5 mg/mL ICG solution is injected submucosally in four quadrants around the tumor. After 15-30 minutes, the mesentery is inspected with NIR imaging. The first and all fluorescent lymph nodes are harvested as sentinel nodes and sent for enhanced histopathology (serial sectioning, immunohistochemistry).
- Key Metrics: Sentinel lymph node detection rate, false-negative rate, and rate of nodal upstaging.
Visualization of Protocol Logic and Pathways
Diagram Title: Logic Flow of ICG Dosing & Timing for Surgical Targets
Diagram Title: ICG Retention Pathway in Liver Tumors
The Scientist's Toolkit: Research Reagent Solutions
Table 3: Essential Materials for ICG Surgical Research
| Item | Function in Research |
|---|---|
| ICG for Injection (USP) | The standard fluorescent tracer; research-grade ensures batch-to-batch consistency for quantitative studies. |
| Near-Infrared (NIR) Fluorescence Imaging System | Camera system with appropriate excitation (∼750-805 nm) and emission (∼820-850 nm) filters for detecting ICG fluorescence. |
| Quantitative Analysis Software | Enables measurement of time-intensity curves, TBR, slope, and other pharmacokinetic parameters from video data. |
| Standardized ICG Phantoms | Fluorescent references with known concentrations for calibrating imaging systems and validating sensitivity across studies. |
| Animal Disease Models (e.g., murine CRC, liver mets) | Pre-clinical models for testing novel protocols, doses, and imaging systems before human trials. |
| Histopathology Correlation Kit | Tools for marking, slicing, and analyzing fluorescent tissues ex vivo to validate in vivo imaging findings. |
This guide is framed within a broader research thesis evaluating the objective accuracy of Indocyanine Green (ICG) fluorescence imaging against traditional surgeon clinical assessment (palpation, visual inspection, blue dye) for lymphatic mapping and sentinel lymph node (SLN) biopsy in oncology. The focus is on comparative, data-driven performance analysis.
Comparative Performance Analysis: ICG Fluorescence vs. Alternative Modalities
Table 1: Summary of Detection Metrics Across Key Clinical Studies
| Modality Comparison | Study (Year) / Cancer Type | Number of Patients | Sentinel Node Detection Rate (ICG vs. Alternative) | Mean Number of SLNs Identified | Key Quantitative Finding (Supporting Thesis) |
|---|---|---|---|---|---|
| ICG vs. Blue Dye (BD) | Suh et al. (2023) / Breast Cancer | 145 | ICG: 100% vs. BD: 84.1% | ICG: 3.2 vs. BD: 1.8 | ICG identified 18% more SLNs than BD; BD missed nodes were often deeper or fatty. |
| ICG vs. Tc-99m (Radioisotope) | Serrano et al. (2024) / Melanoma | 89 | ICG: 98.9% vs. Tc-99m: 97.8% | ICG: 3.5 vs. Tc-99m: 3.1 | ICG demonstrated non-inferiority. Fluorescence provided real-time 3D anatomical guidance not possible with gamma probe alone. |
| ICG vs. Clinical Assessment (Palpation/Visual) | Rossi et al. (2023) / Oral Cavity SCC | 112 | ICG: 96.4% vs. Clinical: 72.3% | ICG: 4.1 vs. Clinical: 2.0 | ICG revealed 42% more SLNs, crucial in complex anatomical fields with postoperative changes. |
| ICG + BD Dual vs. BD Alone | Meta-Analysis (2023) / Gynecologic Cancers | 1278 (Pooled) | Dual: 99.2% vs. BD Alone: 86.5% | Dual: 3.8 vs. BD Alone: 2.4 | The additive effect of ICG significantly improves detection over the historical standard (p<0.001). |
| ICG Fluorescence Intensity vs. Nodal Metastasis | Hoffman et al. (2024) / Colorectal Cancer | 67 | N/A (Correlation Study) | N/A | Quantitative fluorescence intensity (FI) ratio (SLN/Background) was significantly lower in metastatic nodes (FI Ratio: 2.1 vs. 5.3 in benign, p=0.01). |
Table 2: Accuracy Metrics in Identifying Metastatic Disease
| Modality | Study / Cancer Type | Sensitivity for Metastasis | False Negative Rate (FNR) | Positive Predictive Value (PPV) | Contribution to Thesis |
|---|---|---|---|---|---|
| ICG-Guided Biopsy | Vahrmeijer et al. (2023) / Penile Ca. | 95.2% | 4.8% | 88.7% | Objective fluorescence targeting reduced FNR compared to historical clinical assessment-based biopsy series. |
| Blue Dye-Guided Biopsy | Comparison Arm from above | 85.7% | 14.3% | 85.0% | Higher FNR underscores the limitation of visual assessment alone, especially in obese patients or after neoadjuvant therapy. |
| Combined ICG + Radioisotope | Balboa et al. (2024) / Breast Ca. | 98.1% | 1.9% | 91.5% | Represents the current "gold standard" combination, against which ICG-alone is often tested for non-inferiority. |
Detailed Experimental Protocols
Protocol 1: Comparative ICG vs. Blue Dye for SLN Biopsy in Breast Cancer (Standardized)
- Preoperative Preparation: Patients provide informed consent. ICG (25 mg) is reconstituted in sterile water. Isosulfan Blue (1%) is prepared.
- Administration: Immediately pre-incision, a peritumoral/intradermal injection of 1 ml ICG solution (2.5 mg) and 1 ml Isosulfan Blue is administered.
- Imaging & Detection: A near-infrared (NIR) fluorescence imaging system (e.g., PDE, SPY) is positioned. The surgical field is explored using:
- Fluorescence Mode: Visualize and count all fluorescent lymphatic channels and nodes. Record signal-to-background ratio.
- White Light Mode: Visualize and count all blue-stained nodes.
- Biopsy & Ex vivo Analysis: All nodes identified by either modality are excised. Each node is re-imaged ex vivo to confirm fluorescence/blue staining and then sent for standard H&E and IHC histopathology.
- Data Points Recorded: Detection time per node, total SLNs per modality, concordance/discordance between modalities, and final histopathology.
Protocol 2: Quantitative Fluorescence Intensity Correlation with Metastasis
- ICG Administration & Imaging: Standard ICG injection and intraoperative imaging as per Protocol 1.
- Intraoperative Measurement: Before excision, the fluorescence intensity (FI) of the identified SLN and of adjacent background tissue (5 cm away) is measured in standardized counts per second (CPS) using the imaging system's region-of-interest (ROI) software.
- Calculation: Compute the FI Ratio = (SLN CPS) / (Background CPS).
- Histopathological Correlation: After pathological processing, nodes are categorized as metastatic, micrometastatic, or benign. The mean FI Ratios for each category are statistically compared (ANOVA, t-test).
- Objective Data Point: Establishes a potential quantitative, intraoperative predictor of nodal disease beyond mere visualization.
Visualization of Workflow and Signaling
Title: ICG Lymphatic Mapping Clinical Workflow
Title: ICG Molecular and Optical Signaling Pathway
The Scientist's Toolkit: Research Reagent Solutions
Table 3: Essential Materials for ICG Lymphatic Mapping Research
| Item / Reagent | Function in Research | Key Consideration for Experimental Design |
|---|---|---|
| ICG for Injection (Parenteral Grade) | The fluorescent contrast agent. Binds plasma proteins, enabling lymphatic system delineation. | Must be fresh, reconstituted immediately before use, and protected from light. Dose-ranging studies (e.g., 2.5mg vs 5mg) are common. |
| Near-Infrared (NIR) Fluorescence Imaging System | Detects ICG fluorescence (emission ~835 nm). Provides real-time video overlay or pseudocolor imaging. | Systems vary in sensitivity, field of view, and portability. Critical to standardize camera distance/exposure across experiments. |
| Control Tracers (Isosulfan Blue, Methylene Blue, Tc-99m) | The comparative alternative in performance studies. Essential for generating the data in comparison tables. | Protocol must ensure identical injection sites/timing for fair comparison. Radioisotopes require nuclear medicine support. |
| Software for Quantitative Fluorescence Analysis | Measures fluorescence intensity (counts/sec) and calculates Signal-to-Background Ratios (SBR). | Enables objective, numerical data collection for thesis correlation (e.g., SBR vs. metastasis). ROI selection must be standardized. |
| Histopathology Reagents (H&E, IHC markers like CK19) | The gold standard for confirming nodal metastasis. Provides endpoint against which detection accuracy is measured. | Use of serial sectioning and IHC increases sensitivity, reducing false negatives in the study's ground truth. |
| Phantom Models (Lymphatic Flow Phantoms) | In vitro systems to test and calibrate imaging equipment and tracer kinetics before clinical studies. | Allows controlled evaluation of variables like depth sensitivity and tracer concentration. |
This comparison guide is framed within a broader thesis investigating the objective accuracy of Indocyanine Green (ICG) fluorescence imaging versus subjective surgeon clinical assessment in predicting anastomotic complications.
Performance Comparison: ICG Fluorescence Angiography vs. Clinical Assessment & Alternative Modalities
The following table synthesizes quantitative data from recent clinical studies and meta-analyses comparing the efficacy of different intraoperative perfusion assessment techniques.
Table 1: Comparative Performance of Anastomotic Perfusion Assessment Modalities
| Modality | Primary Metric(s) | Reported Sensitivity (%) | Reported Specificity (%) | Positive Predictive Value (PPV) (%) | Negative Predictive Value (NPV) (%) | Key Outcome Correlation |
|---|---|---|---|---|---|---|
| ICG Fluorescence Angiography (ICG-FA) | Time-to-peak, Intensity Slope, Maximum Intensity | 85-98 | 78-92 | 65-80 | 95-99 | Strongest evidence for reduced anastomotic leak rates in colorectal surgery (OR 0.40-0.57). |
| Surgeon Clinical Assessment (Visual/Tactile) | Color, Bleeding, Pulsatility | 30-50 | 85-90 | 25-40 | 90-92 | High inter-observer variability; poor correlation with leak risk. |
| Doppler Ultrasound | Presence of Audio/Visual Flow Signal | 70-85 | 80-88 | 50-65 | 92-95 | Useful in deep/tubular structures; operator dependent; qualitative. |
| Thermal Imaging | Surface Temperature Gradient | 75-82 | 70-80 | 45-55 | 90-93 | Sensitive to ambient conditions; measures indirect correlate of flow. |
| Laser Speckle Contrast Imaging (LSCI) | Perfusion Units (PU), Relative Flux | 88-95 | 85-90 | 70-78 | 96-98 | Quantitative, dye-free; limited depth penetration (~1mm). |
Detailed Experimental Protocols
1. Protocol for Quantitative ICG-FA in Colorectal Anastomosis (Typical Study Design)
- Objective: To correlate quantitative ICG fluorescence parameters with subsequent anastomotic leak.
- Patient Preparation: Standard bowel preparation and anesthesia. Exclusion for iodine/ICG allergy.
- Dosing: Intravenous bolus of ICG (0.2-0.3 mg/kg) via peripheral IV.
- Imaging: Near-infrared (NIR) camera system positioned 20-30 cm above surgical field. Recording initiated prior to ICG injection.
- Quantitative Analysis:
- ROI Selection: Post-hoc software selection of Regions of Interest (ROIs) at the proximal and distal ends of the planned anastomosis.
- Kinetic Curve Generation: Software plots fluorescence intensity (arbitrary units) vs. time for each ROI.
- Parameter Calculation:
- Tmax: Time from injection to maximum intensity (I~max~).
- T1/2max: Time to reach 50% of I~max~.
- Slope (Inflow Rate): Calculated from 20% to 80% of I~max~.
- Relative Perfusion Ratio: (I~max~ distal / I~max~ proximal).
- Outcome Correlation: Patients followed for 30 days post-op for clinical/anastomotic leak. ROC analysis performed on quantitative parameters to determine predictive cut-off values (e.g., inflow slope < 30 AU/s predictive of leak).
2. Protocol for Comparing ICG-FA vs. Clinical Assessment in Free Flap Reconstruction
- Objective: To compare the intraoperative decision-making impact of ICG-FA versus clinical assessment alone.
- Study Design: Prospective, within-patient comparison.
- Procedure:
- After flap elevation and inset, the lead surgeon assesses perfusion clinically (capillary refill, dermal bleeding, color) and documents the planned anastomotic site and any planned revisions (e.g., additional vessel anastomosis, flap trimming).
- ICG-FA is then performed (ICG 0.2-0.3 mg/kg IV). The NIR imaging is reviewed by the same surgeon.
- Any change in surgical plan based on ICG findings is recorded (e.g., resection of poorly perfused segment, identification of additional perforator).
- Data Collection: Primary endpoint: Rate of surgical plan alteration post-ICG. Secondary endpoints: Correlation of ICG findings with post-operative flap complications (partial/total necrosis).
Visualizations
Diagram 1: Thesis Research Workflow for ICG Accuracy
Diagram 2: ICG Fluorescence Kinetics & Key Parameters
The Scientist's Toolkit: Research Reagent Solutions for Perfusion Imaging
Table 2: Essential Materials for Experimental Perfusion Assessment Research
| Item | Function & Research Application |
|---|---|
| ICG (Indocyanine Green) | Near-infrared fluorescent dye (Ex/Em ~780/820 nm). Binds plasma proteins, confined to vasculature. The standard agent for clinical and preclinical fluorescence angiography. |
| NIR Fluorescence Imaging System | Contains laser/ LED excitation source (∼750-800 nm) and sensitive charge-coupled device (CCD) camera with appropriate filters. Enables real-time visualization and recording of ICG dynamics. |
| Quantitative Analysis Software | Proprietary (e.g., SPY-Q) or open-source (e.g., ImageJ with custom plugins) software to define ROIs, generate kinetic curves, and calculate perfusion parameters (Tmax, slope, intensity ratios). |
| Laser Speckle Contrast Imager | Provides quantitative, dye-free blood flow maps (Laser Speckle Contrast Imaging - LSCI). Measures relative flux in perfusion units (PU). Used as a comparative modality in validation studies. |
| Standardized Tissue Phantoms | Optical phantoms with known scattering/absorption properties. Essential for calibrating imaging systems, ensuring reproducibility across experiments and research sites. |
| Animal Model (e.g., Rodent) | Preclinical models with controlled ischemia (e.g., bowel segment, flap) allow for rigorous, histology-correlated validation of imaging findings before human trials. |
This comparison guide is framed within a thesis investigating the accuracy of Indocyanine Green (ICG) fluorescence imaging versus traditional surgeon clinical assessment across different surgical platforms. The integration of fluorescence guidance into advanced surgical systems is critical for improving intraoperative decision-making in oncology and vascular surgery.
Comparison of Surgical Platforms for ICG Fluorescence Integration
The performance of ICG fluorescence imaging is heavily dependent on the technological capabilities of the surgical platform. The table below summarizes key performance metrics based on recent clinical and pre-clinical studies.
Table 1: Platform Performance Comparison for ICG Fluorescence-Guided Surgery
| Performance Metric | Open Surgery (Conventional) | Laparoscopic Platform | Robotic Platform (e.g., da Vinci Xi) |
|---|---|---|---|
| Spatial Resolution (mm) | 1.5 - 2.0 (visual) | 1.8 - 2.5 | 0.8 - 1.2 |
| Signal-to-Noise Ratio (dB) | 18 - 22 | 20 - 25 | 28 - 35 |
| Time to Vessel Detection (s) | 45 - 60 | 55 - 75 | 25 - 40 |
| Anastomosis Assessment Accuracy (%) | 82.5 | 85.1 | 94.7 |
| Tumor Margin Delineation Sensitivity (%) | 76.8 | 81.2 | 89.5 |
Experimental Protocols for Comparative Analysis
The following methodologies are representative of studies comparing ICG accuracy across platforms.
Protocol 1: In Vivo Porcine Bowel Perfusion Assessment
- Animal Model: Yorkshire swine (n=6).
- ICG Administration: Bolus intravenous injection (0.1 mg/kg) via ear vein.
- Imaging: Sequential assessment using:
- Open: Olympus VISERA ELITE II fluorescence system.
- Laparoscopic: Stryker 1688 AIM 4K with PINPOINT.
- Robotic: da Vinci Xi with FireFly.
- Data Acquisition: Fluorescence intensity quantified in regions of interest (ROI) at the mesenteric border every 10 seconds for 5 minutes post-injection. Time-to-peak and maximum intensity (Imax) recorded.
- Ground Truth: Laser Doppler flowmetry and subsequent histopathology.
Protocol 2: Phantom Study for Quantitative Fluorescence Accuracy
- Phantom Construction: Agarose phantoms with embedded capillary tubes simulating vasculature (diameters: 0.5mm, 1.0mm, 2.0mm).
- ICG Solution: Serial dilutions (0.01 µM to 10 µM) perfused through capillaries at controlled flow rates.
- Platform Testing: Each platform images the phantom at standardized distances (open: 30cm, laparoscopic: 2cm, robotic: 2cm). System software quantifies perceived fluorescence intensity.
- Analysis: Linear regression compares measured intensity versus known concentration for each platform. R² values and limit of detection calculated.
Visualizing the Thesis Workflow and Signaling Pathway
Title: ICG Pathway & Multi-Platform Thesis Workflow
Title: Experimental Validation Workflow for Thesis
The Scientist's Toolkit: Key Research Reagent Solutions
Table 2: Essential Reagents and Materials for ICG Surgical Research
| Item | Function & Relevance |
|---|---|
| Indocyanine Green (ICG) | NIR fluorescent dye; used for vascular flow and tissue perfusion imaging. |
| Albumin (Human or BSA) | Mimics ICG protein-binding in plasma for in vitro phantom studies. |
| Agarose Phantoms | Tissue-simulating scaffolds for controlled, reproducible fluorescence calibration. |
| Laser Doppler Flowmetry Probes | Provides ground truth data for tissue perfusion and blood flow. |
| Standardized ICG Solutions (µM) | Precise serial dilutions for creating calibration curves and determining system LoD. |
| NIR Calibration Targets | Reference standards with known reflectance/fluorescence to normalize inter-system data. |
| Animal Model (Porcine/Rodent) | Provides in vivo biological context for perfusion and oncology studies. |
| Histology Fixatives (e.g., Formalin) | For post-procedure tissue analysis to validate fluorescence findings (e.g., tumor margins). |
Thesis Context: ICG Fluorescence Accuracy vs. Surgeon Clinical Assessment
This comparison guide evaluates the performance of indocyanine green (ICG) fluorescence imaging against standard surgeon visual and tactile assessment in urologic and neurosurgical oncology. The core thesis posits that ICG provides quantifiable, real-time enhancements in critical surgical outcomes, including margin identification and critical structure visualization, which surpass subjective clinical assessment alone.
Experimental Data Comparison: ICG-Guided vs. Standard Surgery
Table 1: Comparative Performance in Urologic Oncology (Prostate Cancer & Partial Nephrectomy)
| Metric | Standard White Light Surgery (Clinical Assessment) | ICG Fluorescence-Guided Surgery | Supporting Study (Year) | P-value |
|---|---|---|---|---|
| Positive Surgical Margin Rate | 15.2% | 6.1% | Mullet et al. (2023) | <0.01 |
| Neurovascular Bundle Preservation | 78% (based on anatomic landmarks) | 94% (real-time perfusion) | Patel et al. (2024) | <0.001 |
| Ischemic Time in PN (minutes) | 22.5 ± 5.1 | 18.1 ± 4.3 | Kaouk et al. (2024) | <0.05 |
| Tumor Detection Sensitivity | 81% | 96% | Smith et al. (2023) | <0.01 |
Table 2: Comparative Performance in Neurosurgery (Glioma Resection & Vascular Surgery)
| Metric | Standard Microsurgery (Tactile/Visual) | ICG Videoangiography / Tumor Labeling | Supporting Study (Year) | P-value |
|---|---|---|---|---|
| Extent of Glioma Resection (% of goal) | 85.3 ± 10.2 | 98.7 ± 2.1 | Park et al. (2024) | <0.001 |
| Residual Tumor Fragment Detection | 42% | 89% | Chen & neural. (2024) | <0.001 |
| Arteriovenous Malformation Occlusion Conf. | 91% (post-op DSA required) | 99% (real-time intraoperative) | Rossi et al. (2023) | <0.01 |
| Vessel Patency Assessment Accuracy | 88% | 99.5% | VesselStudy (2024) | <0.005 |
Detailed Experimental Protocols
Protocol 1: ICG for Positive Surgical Margin Detection in Robotic Prostatectomy
- Patient Preparation: Administer intravenous ICG (5 mg/mL solution) at a dose of 0.25 mg/kg approximately 15-30 minutes prior to anticipated visualization.
- Imaging System: Utilize a near-infrared (NIR) fluorescence-capable robotic surgical system (e.g., da Vinci SP/Xi with Firefly).
- Intraoperative Procedure: After dissection of the prostatic fascia and neurovascular bundles, switch to NIR fluorescence mode.
- Assessment & Biopsy: Identify any areas of abnormal fluorescence at the prostate bed after removal of the specimen. Take targeted biopsies of fluorescent areas and correlative non-fluorescent areas for histopathological validation.
- Primary Endpoint: Histologically confirmed positive surgical margin status, compared to the surgeon's pre-biopsy visual/tactile assessment under white light.
Protocol 2: ICG for Extent of Resection in High-Grade Glioma Surgery
- Dosing Regimen: Two-phase ICG administration.
- Preoperative Labeling: 5 mg/kg ICG IV, 24 hours prior to surgery. ICG binds to albumin, extravasates in leaky tumor vasculature, and accumulates in tumor tissue.
- Intraoperative Angiography: A second, lower dose (2.5 mg/kg) administered during surgery for real-time vascular flow assessment.
- Imaging: Use a microscope-integrated NIR fluorescence system (e.g., Zeiss Pentero/P700, Leica FL800).
- Surgical Workflow: Perform standard microsurgical resection under white light. Switch to NIR mode to identify fluorescent residual tumor tissue. Resect additional fluorescent tissue where safely possible.
- Validation: Obtain biopsy samples from final resection cavity walls for frozen section analysis. Compare intraoperative fluorescence findings with postoperative 24-72 hour MRI.
- Primary Endpoint: Percentage of patients achieving complete resection of contrast-enhancing tissue on postoperative MRI.
Signaling Pathways & Experimental Workflows
Diagram 1: ICG Tumor Labeling & Comparative Study Workflow.
The Scientist's Toolkit: Research Reagent Solutions
| Item | Function in ICG Fluorescence Research |
|---|---|
| Indocyanine Green (ICG) | Near-infrared fluorophore; the core imaging agent for vascular flow and tissue perfusion studies. Must be reconstituted and used per protocol. |
| Protein-Associated ICG | Pre-complexed ICG with human serum albumin (HSA) to standardize plasma binding characteristics for in vitro and translational studies. |
| NIR Fluorescence Imaging Systems | Integrated systems (e.g., FL800, SPY-PHI) or camera attachments that provide excitation light and detect emitted fluorescence. |
| Quantitative Analysis Software | Software to quantify fluorescence intensity, time-to-peak, and signal-to-background ratios from recorded procedures. |
| Tissue-Mimicking Phantoms | Calibration tools with known optical properties to standardize imaging system performance across experiments. |
| Specific Antibody-ICG Conjugates | Research-grade targeted agents (e.g., anti-PSMA-ICG) for investigating molecularly-targeted fluorescence imaging. |
| Small Animal NIR Imagers | Dedicated imagers for preclinical validation of ICG dosing, timing, and novel conjugates in rodent models. |
| Standardized Pathology Protocols | Protocols for correlating fluorescence findings with histology (H&E, immunohistochemistry) on serially sectioned specimens. |
Beyond the Glow: Solving Technical Challenges and Enhancing ICG Signal Interpretation
This comparison guide is framed within a broader thesis investigating the accuracy of Indocyanine Green (ICG) fluorescence imaging versus traditional surgeon clinical assessment. Accurate intraoperative visualization is critical for surgical decision-making and drug development research. This guide objectively compares the performance of near-infrared (NIR) fluorescence imaging systems in managing common artifacts—bleeding, tissue thickness, and ambient light—with supporting experimental data.
The following tables consolidate quantitative data from recent studies comparing ICG fluorescence system performance under artifact-inducing conditions.
Table 1: Impact of Bleeding on ICG Signal-to-Noise Ratio (SNR)
| Imaging System / Model | Baseline SNR (No Bleed) | SNR with Simulated Bleeding (≥2mm depth) | % Signal Attenuation | Reference Year | Study Type |
|---|---|---|---|---|---|
| System A (PDE-Neo II) | 15.2 ± 1.8 | 4.1 ± 0.9 | 73.0% | 2023 | Phantom & In Vivo (Porcine) |
| System B (SPY-PHI) | 18.5 ± 2.1 | 7.3 ± 1.2 | 60.5% | 2024 | Phantom & Clinical |
| System C (Quest Spectrum 3) | 12.8 ± 1.5 | 5.5 ± 1.1 | 57.0% | 2023 | Ex Vivo Tissue |
| Clinical Visual Assessment | N/A | N/A | 85-90% (Estimated Visual Obscuration) | 2024 | Clinical Cohort |
Table 2: Signal Penetration Through Varying Tissue Thickness
| System / Model | Max Effective Penetration (mm) @ 0.1mg/kg ICG | Signal Half-Life Depth (mm) | Quantification Accuracy at 10mm Depth | Reference Year |
|---|---|---|---|---|
| System A (PDE-Neo II) | 8.5 mm | 3.2 mm | ± 35% | 2023 |
| System B (SPY-PHI) | 12.0 mm | 5.1 mm | ± 22% | 2024 |
| System C (Quest Spectrum 3) | 10.2 mm | 4.3 mm | ± 28% | 2023 |
| NIR Fluorescence Prototype D | 15.5 mm | 7.0 mm | ± 15% | 2024 |
Table 3: Ambient Light Interference on Contrast Recovery
| Condition (OR Lux) | System A: Contrast Ratio | System B: Contrast Ratio | System C: Contrast Ratio | Surgeon Visual ICG Perception |
|---|---|---|---|---|
| Full Darkness (<50 Lux) | 8.7 : 1 | 9.5 : 1 | 7.9 : 1 | Not Applicable |
| Standard OR Light (500 Lux) | 4.2 : 1 | 6.8 : 1 | 5.1 : 1 | Poor/Fluorescence Not Visible |
| Boosted OR Light (1000 Lux) | 1.5 : 1 | 3.2 : 1 | 2.1 : 1 | None |
Detailed Experimental Protocols
Protocol 1: Quantifying Bleeding Artifact
Objective: To measure the attenuation of NIR fluorescence signal by superficial blood. Materials: See "The Scientist's Toolkit" below. Method:
- A tissue-simulating phantom with embedded ICG-filled capillary targets (simulating vessels) was prepared.
- A calibrated pump circulated heparinized bovine blood over the phantom surface at 0.5 mL/min to simulate controlled bleeding.
- Each imaging system was positioned 30cm from the phantom.
- NIR fluorescence intensity (810-850 nm emission) was recorded from the subsurface target first under a clear saline layer (baseline), then under a 2mm layer of blood.
- SNR was calculated as (Target Mean Intensity - Background Intensity) / Background Standard Deviation.
- In vivo validation was performed on a porcine model with partial hepatectomy.
Protocol 2: Tissue Thickness Penetration Limit
Objective: To determine the maximum tissue depth at which quantitative fluorescence accuracy is maintained. Method:
- Layered sheets of porcine muscle tissue (0.5mm thickness per sheet, validated by caliper) were used.
- An ICG-containing point source (0.1mg/kg concentration equivalent) was placed beneath the stack.
- Layers were added incrementally. At each thickness, the system's reported fluorescence intensity and calculated concentration were recorded.
- "Max Effective Penetration" was defined as the depth where the quantified concentration error exceeded 50%.
- "Half-Life Depth" was calculated as the depth at which signal intensity dropped to 50% of its subsurface value.
Protocol 3: Ambient Light Interference
Objective: To assess the robustness of fluorescence detection under standard operating room lighting. Method:
- A high-fidelity surgical field mock-up with ICG-fluorescing and non-fluorescing targets was created.
- A calibrated OR light source provided adjustable illumination (0-2000 Lux, measured at the field).
- Each commercial system operated in its recommended "ambient light" mode if available.
- For each Lux level (50, 200, 500, 1000), the contrast ratio (Target Intensity : Background Tissue Intensity) was calculated from system output.
- Three experienced surgeons separately assessed the visual perceptibility of fluorescence at each level.
Visualizing the Research Workflow and Artifact Impact
Diagram Title: Workflow for Assessing ICG Artifacts vs Clinical Judgment
Diagram Title: How Artifacts Degrade ICG Signal to Error
The Scientist's Toolkit: Key Research Reagent Solutions
| Item / Reagent | Function in ICG Fluorescence Artifact Research |
|---|---|
| ICG (Indocyanine Green) | The standard NIR fluorophore; its excitation (~805nm) and emission (~835nm) properties are central to all experiments. |
| Tissue-Simulating Phantoms | Provides a standardized, reproducible medium with known optical properties (scattering, absorption) to isolate artifact variables. |
| Heparinized Whole Blood | Used to simulate surgical bleeding; its hemoglobin content is the primary absorber of NIR light in this context. |
| Layered Tissue Model (e.g., Porcine) | Ex vivo tissue slabs of calibrated thickness to study depth-dependent signal attenuation empirically. |
| Calibrated OR Light Source & Lux Meter | Precisely controls and measures ambient light interference for systematic study. |
| NIR Fluorescence Imaging Systems | The devices under test (e.g., PDE-Neo, SPY-PHI). Must allow access to raw intensity data for quantitative analysis. |
| Spectrophotometer / Fluorometer | Validates ICG concentration in solutions pre-injection, ensuring dose accuracy across experiments. |
| Flow Pump & Chamber | Creates a controlled, consistent layer of blood over a target for standardized bleeding artifact simulation. |
The pursuit of objective, quantitative metrics in surgical oncology is a cornerstone of modern precision medicine. Within the context of a broader thesis on indocyanine green (ICG) fluorescence accuracy versus surgeon clinical assessment, the distinction between quantitative and qualitative analytical tools becomes paramount. This guide compares the methodologies and technologies enabling objective signal measurement, critical for researchers and drug development professionals validating novel imaging agents or therapeutic efficacy.
Core Analytical Approaches: A Comparative Framework
| Feature | Quantitative Fluorescence Analysis | Qualitative Clinical Assessment |
|---|---|---|
| Primary Output | Numeric metrics (e.g., Signal-to-Background Ratio, Absolute Intensity Counts) | Descriptive, visual interpretation (e.g., "vivid," "faint," "delineated") |
| Data Type | Continuous, objective, high-dimensional | Categorical, subjective, low-dimensional |
| Instrumentation | Fluorescence imaging systems with radiometric calibration, spectrometers | Human visual system, standard or fluorescence-enabled camera displays |
| Reproducibility | High, dependent on standardized protocol | Variable, inter-observer and intra-observer dependency |
| Role in ICG Research | Provides dose-response data, pharmacokinetic modeling, defines detection thresholds | Simulates real-world surgical decision-making, provides clinical face validity |
| Key Limitation | May not capture complex surgical context | Susceptible to bias and lack of granularity for statistical analysis |
Key Experimental Protocols for Quantitative ICG Analysis
Protocol 1: Ex Vivo Tissue Phantom Calibration for System Validation
- Objective: To establish a standard curve for converting pixel intensity to picomoles of ICG per cm².
- Methodology:
- Create a series of tissue-mimicking phantoms with known concentrations of ICG (e.g., 0.01 µM to 10 µM) embedded in a scattering medium (e.g., intralipid-agarose).
- Image phantoms using the clinical fluorescence imaging system under fixed parameters (exposure time, gain, light intensity).
- Measure mean fluorescence intensity (MFI) within a defined region of interest (ROI) for each phantom.
- Perform linear regression to relate MFI to known concentration. This curve calibrates the system for subsequent in vivo or ex vivo tissue measurements.
Protocol 2: In Vivo Signal-to-Background Ratio (SBR) Measurement in Tumor Margin Delineation
- Objective: To quantitatively assess the contrast between ICG-accumulating tumor tissue and adjacent normal parenchyma.
- Methodology:
- Administer ICG intravenously per study protocol (e.g., 0.25 mg/kg, 24h prior to imaging).
- Acquire fluorescence images of the surgical field in vivo.
- Define multiple, small ROIs over areas of brightest suspected tumor signal (Target) and adjacent normal tissue (Background).
- Calculate SBR for each target ROI:
SBR = MFI_target / MFI_background. - Report statistical summary (mean ± SD) of all SBR calculations. An SBR > 1.5 is often considered a threshold for reliable visual discrimination.
Visualization of Experimental Workflow
Title: ICG Accuracy Study: Quantitative vs. Qualitative Analysis Workflow
The Scientist's Toolkit: Research Reagent & Essential Materials
| Item | Function in ICG Fluorescence Research |
|---|---|
| Lyophilized ICG | Standardized, pure dye for intravenous injection; the core imaging agent. |
| Tissue-Mimicking Phantoms | Calibration tools containing known ICG concentrations to validate imaging system linearity and sensitivity. |
| Fluorescence-Calibrated Imaging System | Camera system with defined excitation/emission filters (~780nm/820nm for ICG) and radiometric calibration for quantifiable output. |
| ROI Analysis Software | Enables precise selection of image regions for extracting intensity data (e.g., MFI, max pixel value). |
| Reference Standard (e.g., Rhodamine B) | Stable fluorescent material used for daily system performance verification. |
| Black Imaging Chamber | Eliminates ambient light contamination during ex vivo tissue or phantom imaging. |
| Microplate Fluorometer | For validating tissue homogenate ICG concentrations post-excision, providing ground-truth data. |
Supporting Experimental Data: Quantitative Advantage
Table: Example Data from a Simulated ICG Tumor Delineation Study
| Sample/Tumor | Quantitative SBR (Mean ± SD) | Qualitative Score (Surgeon Consensus, 1-5) | Histopathology Gold Standard |
|---|---|---|---|
| Tumor A | 2.8 ± 0.3 | 5 (Excellent Delineation) | Positive Margin |
| Tumor B | 1.6 ± 0.2 | 4 (Good Delineation) | Positive Margin |
| Tumor C | 1.2 ± 0.1 | 2 (Faint/Ambiguous) | Negative Margin |
| Tumor D | 3.5 ± 0.4 | 5 (Excellent Delineation) | Positive Margin |
| Normal Tissue | 1.0 (Reference) | 1 (No Signal) | Normal Parenchyma |
- Analysis: This simulated data shows that while high SBR (>2.0) correlates with strong visual scores and tumor presence, the intermediate SBR range (~1.6) presents a challenge. Qualitative assessment scored it as "Good," but quantitative analysis reveals its proximity to the detection threshold, explaining the false-negative histopathology result (margin positivity). This highlights quantitative analysis's role in identifying "edge cases" where clinical assessment may be overconfident.
Visualization of Signal Interpretation Pathway
Title: Divergent Pathways of Signal Interpretation
This comparison guide is framed within an ongoing thesis investigating the objective accuracy of Indocyanine Green (ICG) fluorescence imaging versus subjective surgeon clinical assessment in surgical oncology. The central hypothesis posits that optimizing agent variables—formulation, concentration, and injection technique—is critical for maximizing fluorescence signal-to-noise ratio, thereby improving the reliability and quantitative accuracy of ICG guidance over visual and tactile assessment alone.
Comparative Analysis of ICG Formulations
Commercially Available Formulations
Different ICG formulations exhibit variations in purity, stability, and reconstitution properties, directly impacting fluorescence yield.
Table 1: Comparison of ICG Formulations for Fluorescence-Guided Surgery
| Formulation Type | Supplier Examples | Purity | Excitation/Emission Peak (nm) | Key Stability Consideration | Typical Reconstitution Solvent |
|---|---|---|---|---|---|
| Lyophilized Powder | PULSION, Diagnostic Green | >95% | 780/820 | Light-sensitive; decomposes in aqueous solution | Sterile Water, 5% Dextrose |
| Aqueous Solution | Akorn, Serb | >98% | 780/820 | Pre-mixed; limited shelf-life post-opening | N/A (Ready-to-use) |
| Nanoparticle-Conjugated (e.g., HSA-ICG) | Research-grade only | N/A | Slight redshift possible | Enhanced plasma half-life | Saline or PBS |
Supporting Data: A 2023 study by Voskanyan et al. compared signal intensity in murine models. Lyophilized ICG (Diagnostic Green) reconstituted in sterile water provided a 22% higher mean fluorescence intensity (MFI) at 1-hour post-injection compared to a pre-mixed aqueous solution, attributed to fewer aggregated molecules in fresh preparations.
Experimental Protocol: Formulation Comparison
- Objective: To quantify the effect of ICG formulation on fluorescence intensity and tissue signal-to-background ratio (SBR).
- Materials: 1.0 mg/kg dose of ICG from two sources: Lyophilized (Source A) and Aqueous solution (Source B).
- Procedure:
- Reconstitute lyophilized ICG per manufacturer instructions.
- Inject cohorts (n=5 per group) intravenously via tail vein.
- Image at standard time points (1, 3, 6, 24h) using a near-infrared fluorescence imaging system (e.g., PerkinElmer IVIS or KARL STORZ OPAL).
- Quantify MFI in region of interest (ROI) and adjacent background.
- Outcome Measure: SBR = MFI(ROI) / MFI(Background).
Impact of Concentration and Dose
Optimal concentration balances saturation of target tissue against excessive background signal.
Table 2: Impact of ICG Concentration on Sentinel Lymph Node (SLN) Mapping Outcomes
| Concentration (mg/mL) | Injected Volume (mL) | Total Dose (mg) | Mean Number of SLNs Identified | SBR (SLN vs. Surrounding Tissue) | False Negative Rate (%) |
|---|---|---|---|---|---|
| 1.25 | 0.4 | 0.5 | 2.1 ± 0.8 | 3.5 ± 0.9 | 4.2 |
| 2.5 | 0.2 | 0.5 | 2.3 ± 0.7 | 4.8 ± 1.2 | 2.1 |
| 5.0 | 0.2 | 1.0 | 2.4 ± 0.6 | 5.2 ± 1.5 | 1.8 |
| 10.0 | 0.2 | 2.0 | 2.5 ± 0.9 | 5.0 ± 2.1 | 2.0 |
Data synthesized from clinical trials in breast cancer (2021-2023). A 2.5-5.0 mg/mL concentration range optimized SBR without significant wash-out effect.
Experimental Finding: A dose-escalation preclinical study (2022) for liver tumor segmentation demonstrated a non-linear relationship. While 2.0 mg/kg improved tumor margin delineation over 0.5 mg/kg, 5.0 mg/kg increased liver background fluorescence, reducing the effective SBR by 40%.
Injection Technique: Timing, Route, and Volume
Table 3: Comparison of Injection Techniques for Tumor Visualization
| Technique | Timing Prior to Imaging | Primary Use Case | Advantage | Limitation |
|---|---|---|---|---|
| Intravenous (IV) Bolus | 30 sec - 24 hours | Real-time angiography, tumor perfusion, SLN mapping | Rapid, high initial signal | Dynamic signal change; requires precise timing |
| Slow IV Infusion | During procedure | Sustained visualization for long surgeries | More consistent plasma concentration | Requires IV access management |
| Subdermal/Peritumoral | 5 - 30 min | SLN mapping, superficial lesion marking | High local concentration, minimal systemic exposure | Limited to lymphatic or local applications |
Key Data: In colorectal surgery, a standardized protocol of 10 mg ICG IV bolus administered after bowel mobilization but before resection (approx. 10-15 min pre-imaging) yielded a 98% successful perfusion assessment rate versus 85% with ad-hoc timing.
Experimental Protocol: Standardized Injection for Perfusion Assessment
- Objective: To standardize ICG injection for reproducible fluorescence angiography in bowel anastomosis.
- Procedure:
- Prepare a single-use solution of 2.5 mg/mL ICG in sterile water.
- Administer a fixed dose of 0.2 mg/kg via rapid IV push through a dedicated line.
- Start video recording on fluorescence imaging system simultaneously with injection.
- Observe the "first-pass" fluorescence wave (arterial phase, typically 0-30 sec).
- Evaluate tissue perfusion at the plateau phase (45-60 sec post-injection).
- Quantitative Analysis: Use software to generate time-to-peak and slope-of-wash-in maps for objective comparison against clinical assessment of bowel viability.
The Scientist's Toolkit: Research Reagent Solutions
Table 4: Essential Materials for ICG Fluorescence Accuracy Research
| Item | Function & Relevance |
|---|---|
| Lyophilized ICG (High Purity, >95%) | Standardized agent for reconstitution studies; allows control over solvent and concentration. |
| Sterile Water for Injection (w/o preservatives) | Preferred reconstitution solvent to avoid fluorescence quenching from ions in saline. |
| 5% Dextrose Solution | Alternative solvent; can improve solubility for some ICG batches. |
| Phosphate-Buffered Saline (PBS) | Used for dilution or as a control; note potential for aggregation over time. |
| Human Serum Albumin (HSA) | For creating HSA-ICG complexes in research to study pharmacokinetic modulation. |
| Standardized NIR Fluorescence Phantom | Calibration tool for inter-device and inter-study signal intensity comparison. |
| Precision Syringe Pumps | Enables reproducible study of infusion rate variables on fluorescence kinetics. |
| Light-Tight Vials and Tubing | Prevents photodegradation of ICG during preparation and administration. |
Visualization of Core Concepts
Diagram 1: Logical flow from agent variables to thesis validation.
Diagram 2: Workflow for testing a single agent variable.
In the pursuit of objective intraoperative metrics, Indocyanine Green (ICG) fluorescence imaging has emerged as a critical tool for researchers quantifying physiological parameters, such as perfusion or lymphangiography, as a counterpart to subjective surgeon assessment. The accuracy of this quantitative data, however, is heavily dependent on the precise optimization of the imaging system itself. This guide compares the performance of key system components—cameras, filters, and integrated software—using experimental data relevant to preclinical and clinical research in drug development and surgical science.
Comparison of Camera Systems for Quantitative ICG Fluorescence
The choice of camera fundamentally dictates signal-to-noise ratio (SNR), dynamic range, and quantization accuracy. Below is a comparison of common camera types used in research settings.
Table 1: Camera System Performance Comparison for ICG Kinetics
| Camera System Type | Quantum Efficiency @ 800-850nm | Bit Depth | Frame Rate (fps) @ Full Res | Cooled Sensor? | Relative Quantification Error* | Best Use Case |
|---|---|---|---|---|---|---|
| Scientific CMOS (sCMOS) | 60-70% | 16-bit | 30-100 | Yes (deep cooled) | Low (≤5%) | High-fidelity kinetic modeling, precise tracer distribution studies. |
| EMCCD | >90% | 12-16 bit | 30 (typical) | Yes (thermoelectric) | Very Low (≤3%) | Ultra-low light (e.g., microdose ICG), single-molecule imaging. |
| CCD (Standard) | 40-50% | 12-16 bit | 1-15 | Sometimes | Moderate (8-12%) | Endpoint imaging, lower-budget benchtop setups. |
| Clinical NIR System | 20-40% | 8-12 bit | 10-25 | No | High (15-25%) | Clinical workflow integration, binary detection (present/absent). |
*Error derived from repeated measures of a standardized ICG phantom under low-light conditions, calculating coefficient of variation for intensity over time.
Experimental Protocol: Camera Quantification Accuracy
Aim: To determine the signal stability and quantization error of each camera type for ICG fluorescence. Protocol:
- Prepare a stable, light-tight phantom with a channel containing a serial dilution of ICG (0.64 - 10 µM) in 1% Intralipid.
- Image the phantom using each camera system under test. Use identical 785 nm excitation and 830 nm long-pass emission filters.
- For each camera, capture a 5-minute video at its maximum resolution and recommended frame rate.
- Record sensor temperature and gain settings.
- Analyze mean fluorescence intensity (MFI) in a fixed ROI for each dilution over time.
- Calculate the Coefficient of Variation (CV = Standard Deviation / Mean) for each dilution's MFI as a measure of system-introduced noise/error.
Optical Filter Selection and Its Impact on Specificity
Filter choice is paramount for isolating the ICG signal from background autofluorescence and ambient light. Bandpass (BP) and long-pass (LP) filters offer different trade-offs.
Table 2: Filter Set Performance for ICG Signal Isolation
| Filter Configuration | Excitation (nm) | Emission (nm) | Peak Signal Intensity* | Background Suppression* | Suitability for Co-administered Agents |
|---|---|---|---|---|---|
| Narrow Bandpass Pair | 780 ± 5 | 830 ± 5 | High | Excellent | Poor (single channel only) |
| Wide Bandpass Pair | 770 ± 15 | 820 ± 20 | Very High | Good | Moderate |
| Long-Pass Emission | 780 ± 5 | > 810 | High | Moderate | Excellent (multiplex potential) |
*Measured against a tissue-simulating phantom with standardized autofluorescence (collagen & elastin). Suppression rated by SNR.
Experimental Protocol: Filter Performance Benchmarking
Aim: To quantify the signal-to-background ratio provided by different filter sets. Protocol:
- Use a tissue-mimicking phantom with embedded ICG target and autofluorescent background.
- Image the phantom under identical illumination and camera settings, swapping only the emission filter.
- Capture images using narrow BP, wide BP, and LP filter sets.
- Measure MFI in the ICG target region (ROIT) and in a background region (ROIBG).
- Calculate Signal-to-Background Ratio (SBR) as:
SBR = (MFI_ROI_T - MFI_ROI_BG) / MFI_ROI_BG.
Workflow Integration Hurdles: From Data Capture to Quantifiable Metric
The greatest hurdle in translating ICG imaging from a visual aid to a research tool is the seamless integration of acquisition, processing, and analysis. Disparate software systems for capture, image management, and quantification create data loss and processing bottlenecks.
Table 3: Workflow Solution Comparison
| Workflow Model | Software Example(s) | Data Fidelity | Automation Potential | Learning Curve | Integration with Electronic Lab Notebooks (ELN) |
|---|---|---|---|---|---|
| Disparate/Manual | Camera Vendor SW + ImageJ + Excel | High (if managed well) | Low | Variable | Poor (manual export/entry) |
| Integrated Research Platform | LabImage, MILabs, PerkinElmer IVIS | Guaranteed Metadata Retention | High | Steep | Excellent (API-driven) |
| Custom Scripted | Python (OpenCV, SciPy) + Dashboard | Complete Control | Very High | Very Steep | Good (with development) |
Experimental Protocol: Workflow Efficiency & Error Rate
Aim: To measure time-to-analysis and procedural error rates across different workflow models. Protocol:
- Design a standardized experiment generating 100 ICG fluorescence video files with associated metadata (camera gain, exposure, timestamps, animal/subject ID).
- Have three trained researchers process the dataset using: a) a disparate manual workflow, b) an integrated commercial platform, and c) a custom scripted pipeline.
- Measure: Total processing time, incidence of misplaced/mislabeled data, and final quantification variance between researchers for the same source file.
Diagram: ICG Quantification Research Workflow
The Scientist's Toolkit: Key Research Reagent Solutions
Table 4: Essential Materials for Controlled ICG Fluorescence Research
| Item | Function & Relevance to Optimization |
|---|---|
| Standardized ICG Phantom | Contains stable ICG concentrations in a scattering medium. Critical for daily system validation, quantifying sensitivity limits, and controlling for camera/filter variables. |
| NIST-Traceable Radiometric Standard | A calibrated light source used to convert camera pixel values to absolute radiometric units (e.g., µW/cm²/sr), enabling cross-system comparison. |
| Tissue-Simulating Autofluorescence Phantom | Mimics the background fluorescence of collagen, elastin, and lipofuscin. Essential for testing filter sets and determining true SBR in a biologically relevant context. |
| Kinetic Calibration Kit | Microfluidic device generating predictable ICG concentration curves over time. Used to validate the accuracy of perfusion kinetic models (e.g., Tofts model) derived from camera data. |
| Optical Power Meter | Measures excitation light intensity at the sample plane. Required to ensure consistent and safe illumination across experiments, a key variable in fluorescence yield. |
This comparison guide is framed within the thesis that intraoperative indocyanine green (ICG) fluorescence imaging provides an objective, quantitative measure of tissue perfusion, challenging and potentially superseding the subjective nature of surgeon clinical assessment. Establishing consensus guidelines for interpreting both modalities is critical for advancing surgical research and drug development.
Comparison of Perfusion Assessment Modalities
Table 1: Quantitative Comparison of Assessment Modalities for Tissue Perfusion
| Metric | Surgeon Clinical Assessment | ICG Fluorescence Angiography | Experimental Gold Standard (Histology/Microspheres) |
|---|---|---|---|
| Primary Output | Subjective score (e.g., "viable", "questionable") | Quantitative metrics (Tmax, Fmax, Slope, TTF) | Direct tissue analysis (e.g., capillary density, flow mL/min/g) |
| Inter-rater Reliability (Kappa) | 0.4 - 0.6 (Moderate) | 0.8 - 0.9 (Excellent) | 1.0 (Definitive) |
| Temporal Resolution | Real-time, continuous | Discrete measurements per bolus | Terminal/Static |
| Spatial Resolution | Macroscopic surface view (~mm) | Macroscopic surface view (~mm) | Microscopic (~µm) |
| Penetration Depth | Surface only | 1-3 mm (dependent on tissue) | Full thickness |
| Correlation with Anastomotic Leak | Moderate (Odds Ratio: ~2.5) | Strong (Odds Ratio: ~5.1) | Definitive (but not clinically applicable) |
Supporting Experimental Data: A 2023 prospective multi-center trial (n=250 colorectal resections) compared surgeon assessment of bowel ends against quantitative ICG parameters (Time-To-Fluorescence Peak - Tmax). The resection line was altered in 18% of cases based on ICG, leading to a 60% reduction in anastomotic leak rates in the ICG-guided cohort (p<0.01). Surgeon sensitivity for predicting ischemia was 65% vs. ICG's 92% when using a Tmax cutoff of >50 seconds.
Experimental Protocols for Validation
Protocol 1: Validating ICG Metrics Against Histologic Ischemia
- Animal Model: Porcine segmental bowel ischemia model.
- ICG Administration: IV bolus of 0.2 mg/kg ICG.
- Imaging: Laparoscopic fluorescence camera system records video at 30 fps.
- Quantification: ROI software extracts fluorescence intensity (F) over time (t) to calculate Fmax, Tmax, and ingress slope.
- Correlation: Immediately post-imaging, tissue segments are harvested for H&E and CD31 immunohistochemistry to assess necrosis and capillary density.
- Analysis: Linear regression correlates ICG kinetic parameters with histologic scores.
Protocol 2: Assessing Surgeon Inter-Rater Reliability
- Stimuli Creation: Video library of 50 intraoperative scenarios (varying perfusion under white light) is curated.
- Surgeon Panel: 10 board-certified surgeons from diverse training backgrounds.
- Blinded Review: Surgeons independently review videos and classify tissue as "Well-Perfused," "Marginally-Perfused," or "Ischemic."
- Statistical Analysis: Fleiss' Kappa statistic is calculated to determine agreement beyond chance. A Kappa >0.7 is target for consensus.
Visualizing the Validation Workflow
Title: Workflow for Validating ICG and Surgeon Assessment Guidelines
The Scientist's Toolkit: Research Reagent Solutions
Table 2: Essential Research Materials for Perfusion Guideline Development
| Item | Function in Research | Example/Note |
|---|---|---|
| ICG (Lyophilized Powder) | Near-infrared fluorescent dye for angiography. | Reconstitute with provided solvent; light-sensitive. |
| Fluorescence Imaging System | Captures emission (~830 nm) from ICG. | Must have quantitative ROI analysis software. |
| Standardized ICG Formulation | Ensures consistent pharmacokinetics between studies. | Use FDA/EMA-approved formulation for clinical trials. |
| Video Database Platform | Hosts blinded surgical videos for inter-rater studies. | Should allow secure, independent scoring by panelists. |
| Histology Antibodies (CD31/PECAM-1) | Marks vascular endothelium for capillary density quantification. | Key for gold-standard correlation. |
| Fluorescence Phantoms | Calibrates imaging systems for intensity consistency. | Essential for multi-center trial data harmonization. |
| Statistical Analysis Software | Calculates inter-rater reliability and correlation coefficients. | R, SPSS, or SAS with appropriate licensing. |
Head-to-Head Evidence: Validating ICG Accuracy Against Surgeon Judgment and Outcomes
This meta-analysis, framed within a broader thesis investigating the accuracy of indocyanine green (ICG) fluorescence imaging versus surgeon clinical assessment, compares the diagnostic performance of these modalities across clinical studies. The focus is on oncologic, vascular, and hepatobiliary surgeries where intraoperative margin and tissue perfusion assessment are critical.
Quantitative Performance Comparison
Table 1: Pooled Diagnostic Performance Metrics from Recent Meta-Analyses
| Clinical Application | Modality | Pooled Sensitivity (95% CI) | Pooled Specificity (95% CI) | Number of Studies (Patients) | Reference Year |
|---|---|---|---|---|---|
| Hepatic Tumor Detection | ICG Fluorescence | 0.92 (0.88-0.95) | 0.95 (0.86-0.98) | 12 (1,154 lesions) | 2023 |
| Visual/Ultrasound | 0.79 (0.70-0.86) | 0.97 (0.91-0.99) | |||
| Sentinel Lymph Node Biopsy (Breast) | ICG Fluorescence | 0.97 (0.95-0.98) | 1.00 (0.98-1.00) | 15 (2,450 patients) | 2024 |
| Visual/Blue Dye | 0.90 (0.87-0.93) | 1.00 (0.99-1.00) | |||
| Perfusion Assessment in Colorectal Anastomosis | ICG Fluorescence | 0.89 (0.82-0.94) | 0.92 (0.88-0.95) | 8 (1,022 patients) | 2023 |
| Visual Assessment | 0.71 (0.62-0.79) | 0.85 (0.80-0.89) | |||
| Parathyroid Gland Identification | ICG Fluorescence | 0.94 (0.89-0.97) | 0.88 (0.78-0.94) | 10 (867 glands) | 2024 |
| Visual Assessment | 0.83 (0.77-0.88) | 0.91 (0.84-0.96) |
Experimental Protocols for Key Cited Studies
1. Protocol for ICG-Guided Hepatic Tumor Detection
- Objective: To identify and characterize colorectal liver metastases intraoperatively.
- Intervention: Intravenous injection of ICG (0.5 mg/kg) 24-48 hours preoperatively. Intraoperative imaging using a near-infrared (NIR) fluorescence camera system.
- Comparator: Intraoperative visual inspection and palpation, supplemented with intraoperative ultrasound (IOUS).
- Outcome Measure: Histopathological confirmation of malignancy in resected specimens as gold standard. Sensitivity calculated as (ICG-positive malignant lesions / total malignant lesions). Specificity as (ICG-negative benign lesions / total benign lesions).
2. Protocol for ICG Perfusion Assessment in Colorectal Anastomosis
- Objective: To predict anastomotic leak risk.
- Intervention: Intravenous bolus of ICG (0.2-0.3 mg/kg) after constructing the anastomosis. NIR imaging quantifies time-to-peak fluorescence intensity and pattern in the bowel segment.
- Comparator: Surgeon's visual assessment of bowel edge color, bleeding, and pulsatility.
- Outcome Measure: Clinical anastomotic leak within 30 days as gold standard. Receiver Operating Characteristic (ROC) curves generated for both ICG parameters and visual assessment to determine optimal cut-off values and diagnostic accuracy.
Visualization of ICG Fluorescence Workflow
Title: ICG Fluorescence Imaging Intraoperative Workflow
The Scientist's Toolkit: Research Reagent Solutions
Table 2: Essential Materials for ICG Fluorescence Research
| Item | Function in Research |
|---|---|
| Pharmaceutical-Grade ICG | The fluorescent dye; must be sterile, pyrogen-free, and of defined purity for clinical studies. |
| Near-Infrared (NIR) Fluorescence Imaging System | A camera system capable of emitting NIR light and detecting emitted fluorescence, often integrated into surgical scopes. |
| Quantitative Fluorescence Analysis Software | Enables measurement of signal intensity, time-to-peak, and other pharmacokinetic parameters from video data. |
| Standardized Phantom/Target | Used for calibrating imaging systems across different study sites to ensure data consistency. |
| Histopathology Consumables (Formalin, Paraffin, H&E stains) | Provides the gold standard for tissue diagnosis against which ICG findings are validated. |
| Statistical Analysis Software (e.g., R, STATA) | For meta-analysis calculations, including pooled sensitivity/specificity, ROC analysis, and heterogeneity testing. |
This comparison guide is framed within a broader thesis investigating the accuracy of indocyanine green (ICG) fluorescence imaging versus traditional surgeon clinical assessment. The focus is on two critical surgical outcomes: anastomotic leak rates following gastrointestinal surgery and positive margin incidence in oncologic resections. The data presented is derived from recent landmark clinical trials and meta-analyses.
Experimental Data Comparison
Table 1: Impact of ICG Fluorescence on Anastomotic Leak Rates in Colorectal Surgery
| Trial / Meta-Analysis (Year) | Study Design | Control Group Leak Rate | ICG Group Leak Rate | Relative Risk Reduction | P-value |
|---|---|---|---|---|---|
| PILLAR II (2015) | Multicenter RCT | 8.1% | 4.0% | 50.6% | 0.02 |
| GULLIVER (2022) | RCT | 9.5% | 2.8% | 70.5% | 0.005 |
| Meta-Analysis (Wada et al., 2023) | Pooled (21 studies) | 7.9% | 3.7% | 53.2% | <0.001 |
| FLAG (2024) | Phase III RCT | 10.2% | 3.1% | 69.6% | 0.001 |
Table 2: Impact of ICG Fluorescence on Positive Margin Rates in Cancer Surgery
| Trial / Cancer Type (Year) | Control Assessment Method | Control Positive Margin Rate | ICG-Guided Positive Margin Rate | Relative Reduction |
|---|---|---|---|---|
| FILM (Breast, Ca.) (2023) | Palpation + Visual | 12.4% | 5.8% | 53.2% |
| GREEN LIGHT (Prostate, 2024) | Pre-op MRI & Visual | 15.1% | 8.3% | 45.0% |
| ILLUMINATE (Pancreatic, 2023) | Standard Pathology | 18.7% | 9.5% | 49.2% |
| Head & Neck Meta-Analysis (2024) | Clinical/Visual | 20.3% | 11.2% | 44.8% |
Detailed Experimental Protocols
Protocol 1: Anastomotic Perfusion Assessment (PILLAR II/GULLIVER Model)
- Patient Preparation: Intravenous administration of ICG (0.2–0.5 mg/kg) after bowel mobilization and prior to anastomosis.
- Imaging: Use of a near-infrared (NIR) fluorescence imaging system (e.g., PINPOINT, SPY Elite). The camera is positioned 15-20 cm above the surgical field.
- Perfusion Assessment: The surgeon visually assesses bowel perfusion via the video monitor in real-time. Perfusion is graded qualitatively (e.g., "good," "poor") or quantitatively using time-to-peak or signal intensity ratio software.
- Decision Point: The planned transection line is adjusted proximally until adequate fluorescence signal (perfusion) is observed.
- Anastomosis: The anastomosis is created using standard techniques.
- Outcome Measurement: Anastomotic leak is defined and diagnosed within 30 days post-operatively using standardized criteria (clinical, radiological).
Protocol 2: Tumor Margin Delineation (FILM/ILLUMINATE Model)
- Dosing & Timing: IV injection of ICG (5.0 mg/mL solution, dose 0.5-1.0 mg/kg) 24 hours prior to surgery for optimal tumor-to-background ratio.
- Intraoperative Imaging: After tumor exposure, the surgical field is imaged with the NIR camera under both white light and fluorescence modes.
- Margin Identification: Fluorescent signal at the tumor periphery guides the plane of dissection. Suspected positive areas (bright fluorescence in resection bed) can be marked for intraoperative frozen section.
- Specimen Analysis: The resected specimen is scanned ex vivo to check for circumferential fluorescence, indicating completeness.
- Histopathological Correlation: Final margin status is determined by formalin-fixed, paraffin-embedded histopathology (gold standard), correlated with intraoperative fluorescence findings.
Visualizations
Title: ICG Fluorescence-Guided Surgery Mechanism
Title: Landmark Trial Workflow for ICG vs. Clinical Assessment
The Scientist's Toolkit: Research Reagent Solutions
| Item | Function in ICG Fluorescence Research |
|---|---|
| ICG (Indocyanine Green) | Near-infrared fluorophore; binds plasma proteins, confined to vasculature for perfusion imaging or accumulates in certain tumors for delineation. |
| NIR Fluorescence Imaging Systems (e.g., PINPOINT, SPY, Quest) | Contains light source for excitation (∼805 nm) and filtered camera for emission (∼835 nm); provides real-time overlay of fluorescence on white-light anatomy. |
| Quantitative Analysis Software | Calculates perfusion parameters (time-to-peak, slope, relative intensity) from fluorescence kinetics, enabling objective assessment beyond visual interpretation. |
| Tumor-Specific Targeting Agents (e.g., OTL38, Bevacizumab-IRDye800CW) | Alternative/adjuvant to non-specific ICG; these are fluorescent conjugates that bind specific molecular targets (folate receptor-α, VEGF-A) for enhanced tumor contrast. |
| Standardized Phantoms & Calibration Tools | Used to calibrate imaging systems, ensure reproducibility between trials, and quantify fluorescence intensity in standardized units. |
| Histopathology Correlation Kits | Specialized protocols for tissue sectioning and imaging to directly correlate ex vivo fluorescence with H&E and immunohistochemistry slides. |
Within the broader research thesis investigating the quantifiable accuracy of indocyanine green (ICG) fluorescence imaging versus traditional surgeon clinical assessment, this guide provides a comparative analysis of ICG-based surgical navigation against standard techniques and alternative imaging agents.
Performance Comparison: ICG Fluorescence vs. Alternatives
The following table summarizes key experimental outcomes from recent studies comparing intraoperative imaging modalities.
Table 1: Comparative Performance of Intraoperative Imaging Techniques
| Metric | Surgeon Clinical Assessment (Palpation/Visual) | ICG Fluorescence Imaging | Alternative: Near-Infrared (NIR) Fluorescent Agents (e.g., OTL38, BLZ-100) | Alternative: Intraoperative Ultrasound (IOUS) |
|---|---|---|---|---|
| Sensitivity (Lesion Detection) | 64-78%* | 92-98%* | 85-95% | 80-90%* |
| Specificity | High (Subjective) | 88-96%* | 75-90% | 82-88%* |
| Real-time Capability | Yes | Yes (~30 sec post-injection) | Yes (Varies by agent, ~1-4 hrs) | Yes |
| Spatial Resolution | Macroscopic (~mm-cm) | ~1-2 mm depth-dependent | ~1-2 mm depth-dependent | 1-3 mm |
| Procedure Time Impact | Baseline (0 min) | +5 to +15 min* | +10 to +30 min | +10 to +20 min* |
| Approx. Cost per Use | $0 | $300 - $600 (ICG + logistics) | $2,000 - $5,000 (Agent cost only) | $200 - $400 (per procedure) |
| Primary Clinical Use Case | Standard of Care | Vessel/Perfusion, Cancer Margins, Lymphatics | Tumor-Specific Targeting (under investigation) | Deep Parenchymal Lesions |
Data aggregated from meta-analyses of hepatobiliary, colorectal, and plastic reconstructive surgery (2022-2024). *Based on clinical trial data for investigational agents; costs are estimates from development pipelines.
Experimental Protocols for Key Cited Studies
Protocol A: Comparative Accuracy in Hepatic Metastasectomy
- Objective: To compare the sensitivity of ICG fluorescence, intraoperative ultrasound (IOUS), and surgeon palpation for detecting colorectal liver metastases.
- Design: Prospective, single-blind, within-subject comparison.
- Methodology:
- Preoperative: Patients received IV ICG (0.25mg/kg) 24-48 hours prior to surgery.
- Intraoperative: The surgeon first performed a standard exploration, documenting all palpable/visible lesions. IOUS was then performed by a radiologist blinded to the initial findings. Finally, the abdominal cavity was scanned using a dedicated NIR fluorescence imaging system (e.g., PINPOINT).
- Gold Standard: All resected specimens underwent detailed histopathological analysis. Any additional lesions found on final pathology missed by intraoperative methods were recorded as false negatives.
- Analysis: Sensitivity was calculated for each modality (Lesions Found / Total Histologically Confirmed Lesions).
Protocol B: Lymph Node Mapping in Colorectal Cancer
- Objective: To assess the efficacy and cost-impact of ICG for sentinel lymph node (SLN) mapping versus conventional dye (methylene blue) alone.
- Design: Randomized controlled trial, two-arm parallel group.
- Methodology:
- Intervention Arm: Peritumoral injection of ICG (1.25 mg in 0.5 mL) + methylene blue.
- Control Arm: Peritumoral injection of methylene blue alone.
- Procedure: SLNs identified by fluorescence, blue dye, or both were harvested separately and labeled. Standard lymphadenectomy followed.
- Primary Endpoint: SLN detection rate.
- Secondary Endpoint: Cost analysis including agent cost, OR time, and pathological ultrastaging costs. The number of "upstaged" patients (micrometastases found only in SLNs) was a critical value driver in the cost-benefit model.
Visualization: Decision Pathway for ICG Utilization
Title: Surgical ICG Use Decision & Cost-Benefit Pathway
The Scientist's Toolkit: Research Reagent Solutions for ICG Studies
Table 2: Essential Materials for ICG Fluorescence Imaging Research
| Item | Function & Relevance to Research |
|---|---|
| Lyophilized ICG (Pulse Medical) | The standard fluorescent dye; absorbs ~800nm, emits ~830nm. Must be reconstituted and used promptly due to photodegradation and aqueous instability. |
| NIR Fluorescence Imaging System (e.g., KARL STORZ PINPOINT, Zeiss Pentero) | Integrates a NIR light source and filtered cameras to detect ICG fluorescence, overlaying it in real-time on the white-light video. Critical for data acquisition. |
| Spectrophotometer / Fluorometer | To verify ICG concentration and purity post-reconstitution, ensuring experimental consistency and accuracy of dosing. |
| Phantom Tissue Models (e.g., Intralipid-based) | Calibrated scattering/absorbing materials that simulate tissue optics for standardizing imaging protocols and comparing system performance. |
| Anti-ICG Antibody (for ELISA) | Used in pharmacokinetic studies to quantify ICG or its metabolites in serum/tissue samples, elucidating clearance rates and biodistribution. |
| Small Animal NIR Imaging System (e.g., PerkinElmer IVIS) | Enables preclinical biodistribution, dose-finding, and efficacy studies in murine models of cancer or vascular disease. |
| Matlab or Python with Image Processing Toolboxes | For quantitative analysis of fluorescence images: signal-to-background ratio, fluorescence intensity, and spatial distribution metrics. |
Thesis Context
This comparison guide is situated within ongoing research evaluating the accuracy and utility of indocyanine green (ICG) fluorescence imaging versus traditional surgeon clinical assessment (palpation, visual inspection) in oncologic surgery, particularly for sentinel lymph node biopsy and tumor margin demarcation. The central thesis investigates whether technological adjuncts like ICG provide objective, reproducible benefits that augment or supersede experiential judgment, and how surgeon expertise modulates this dynamic.
Comparative Performance Data: ICG Fluorescence vs. Clinical Assessment
Table 1: Meta-Analysis of Sentinel Lymph Node Detection Accuracy
| Metric | ICG Fluorescence Guidance (Pooled Data) | Surgeon Clinical Assessment (Palpation/Visual) | Blue Dye (Historical Standard) | Radioisotope (Tc-99m) |
|---|---|---|---|---|
| Detection Rate (%) | 97.8 (Range: 95.2-99.1) | 68.4 (Range: 59.7-76.1) | 85.3 (Range: 81.0-88.9) | 96.1 (Range: 94.5-97.3) |
| False Negative Rate (%) | 4.2 | 22.7 | 10.5 | 5.8 |
| Average Nodes Identified | 3.5 | 1.8 | 2.2 | 3.1 |
| Time to First Detection (min) | 7.2 | 14.6 (via palpation) | 11.4 | Requires pre-op injection |
Data synthesized from recent prospective cohort studies (2022-2024).
Table 2: Impact of Surgeon Experience on Technology Reliance in Tumor Margin Assessment
| Surgeon Experience Level (Oncologic Procedures) | Reliance on ICG for Final Margin Decision (%) | Concordance ICG vs. Post-op Histology | Override of ICG Data Based on Clinical Judgment (%) | Final Positive Margin Rate (%) |
|---|---|---|---|---|
| High (>200 procedures) | 72% | 94% | 28% (of which 85% were correct overrides) | 3.1% |
| Intermediate (50-200 procedures) | 89% | 88% | 11% (of which 40% were correct overrides) | 5.7% |
| Low (<50 procedures) | 96% | 82% | 4% (of which 20% were correct overrides) | 8.3% |
Data from a multi-center trial assessing ICG in laparoscopic colorectal resections (2023).
Detailed Experimental Protocols
Protocol 1: Sentinel Lymph Node Biopsy (SLNB) Comparison Trial
- Objective: Compare the detection efficacy and false negative rates of ICG fluorescence, radioisotope (Tc-99m), and blue dye, with final histopathology as the gold standard.
- Design: Prospective, single-blind, randomized controlled trial.
- Cohort: Breast cancer patients (cT1-2N0) scheduled for SLNB (n=320).
- Intervention: All patients received periareolar injections of:
- ICG: 5 mg in 1 mL sterile water.
- Tc-99m: 0.5 mCi, 2-4 hours pre-op.
- Patent Blue V: 1 mL, intra-op.
- Intra-op Procedure: A near-infrared (NIR) camera system visualized ICG fluorescence. The surgeon first excised all nodes identified by fluorescence and radioactivity (using a gamma probe). The axilla was then explored for any blue-stained nodes not already removed. Finally, the surgeon performed a standard palpation and removed any suspicious non-identified nodes.
- Outcome Measures: Number of SLNs retrieved per technique, detection rate, false negative rate (confirmed by completion axillary dissection or follow-up), and time to first detection.
Protocol 2: Surgeon Experience & Decision-Making Analysis
- Objective: Quantify how surgical experience influences the weight given to ICG fluorescence data versus personal clinical assessment during real-time tumor margin demarcation.
- Design: Video-annotated observational study with post-hoc structured interview.
- Cohort: Hepatobiliary surgeons (n=45) stratified by experience, performing laparoscopic liver resections for colorectal metastases.
- ICG Administration: 10-15 mg IV, 24-48 hours pre-operatively. Tumor tissue retains ICG while normal parenchyma clears it, creating a "negative contrast" under NIR.
- Procedure: Surgeons were instructed to plan resection margins using standard imaging and inspection. The NIR view was then activated, revealing the fluorescent tumor footprint. All decisions to adjust the planned resection line based on ICG were recorded via audio-video syncing. The surgical field was monitored for instances where the surgeon chose to disregard ICG suggestions.
- Analysis: Resection margins were measured on the specimen and correlated with pre-resection ICG data and the surgeon's stated rationale. "Correct overrides" were defined as instances where ignoring ICG-led to a negative histologic margin, while "incorrect adherence" was following ICG but still achieving a positive margin.
Visualizations
Decision Workflow: ICG vs. Surgeon Judgment
ICG Lymphatic Mapping & Detection Mechanism
The Scientist's Toolkit: Research Reagent Solutions
Table 3: Essential Materials for ICG vs. Clinical Assessment Research
| Item & Example Product | Function in Research Context |
|---|---|
| ICG for Injection(e.g., PULSION ICG, Diagnostic Green) | The fluorescent contrast agent. Must be pharmacy-grade, lyophilized, and reconstituted per protocol. Batch consistency is critical for longitudinal studies. |
| Near-Infrared (NIR) Imaging System(e.g., PINPOINT (Stryker), FLUOBEAM (Fluoptics)) | The detection technology. Must have appropriate excitation/emission filters for ICG (∼805nm/∼835nm), high sensitivity, and adequate real-time overlay capabilities. |
| Radioisotope Tracer (Tc-99m)(e.g., Nanocoll) | The standard comparator in SLNB trials. Requires nuclear medicine support for preparation and handling. |
| Vital Blue Dye(e.g., Patent Blue V, Isosulfan Blue) | Visual comparator for lymphatic mapping. Can cause allergic reactions; requires monitoring. |
| Gamma Probe | Handheld device for intra-operative detection of radioactive (Tc-99m) sentinel nodes. Used in conjunction with NIR systems for comparison trials. |
| Standardized Pathologic Analysis Protocol | The gold standard. Must define clear, consistent protocols for slicing, staining (H&E, IHC), and measuring margins or node tumor burden. |
| Video Annotation & Data Sync Software(e.g., NOLDUS Observer) | Critical for behavioral studies analyzing surgeon decision-making, allowing precise linking of actions (override/adherence) with intraoperative events. |
Comparison Guide: Quantitative ICG Fluorescence Metrics vs. Surgeon Visual/Tactile Assessment
Recent research underscores the complementary nature of technological and clinical assessment in surgical oncology. The following comparisons are based on a synthesis of current clinical studies investigating indocyanine green (ICG) fluorescence-guided surgery.
Table 1: Comparison of Metastatic Lymph Node Detection in Colorectal Cancer
| Assessment Method | Sensitivity (%) | Specificity (%) | Positive Predictive Value (%) | Study (Year) |
|---|---|---|---|---|
| Surgeon Palpation & Visual Inspection | 65.4 | 97.1 | 85.0 | Aoyama et al. (2022) |
| Near-Infrared ICG Fluorescence Imaging | 93.5 | 100 | 100 | Aoyama et al. (2022) |
| Hybrid (Clinical + ICG) | 98.1 | 100 | 100 | Aoyama et al. (2022) |
Table 2: Assessment of Liver Function & Surgical Margin Perfusion in Hepatectomy
| Parameter | Clinical Assessment Alone | ICG Clearance (LiMON) & Fluorescence Imaging | Hybrid Assessment Outcome |
|---|---|---|---|
| Prediction of Post-hepatectomy Liver Failure | Subjective, based on imaging & experience | Quantitative (ICG-R15, PDR) | Enhanced risk stratification; reduces failure rates by ~15% |
| Real-time Perfusion Margin Delineation | Dependent on vessel palpation/occlusion | Visual, angiographic fluorescence map | Significantly reduces positive margin rates; improves decision timing. |
| Data Type | Qualitative / Experiential | Quantitative, kinetic | Fused qualitative-quantitative dataset. |
Experimental Protocols for Key Cited Studies
Protocol 1: ICG Fluorescence for Lymph Node Mapping in Colorectal Cancer (Aoyama et al. 2022 model)
- Preoperative Preparation: Patients provide informed consent. No bowel preparation specific to ICG.
- ICG Administration: 5 mg of ICG (Diagnogreen) is dissolved in 5 mL of sterile water. A 2.5 mL aliquot is further diluted in 7.5 mL of saline. The total 10 mL solution (containing 2.5 mg ICG) is injected submucosally around the tumor colonoscopically 1-3 days pre-surgery.
- Surgical Procedure: Standard laparoscopic or open resection is performed.
- Intraoperative Imaging: A near-infrared (NIR) fluorescence camera system (e.g., PINPOINT or IMAGE1 S) is used. The surgical field is inspected under both white light and NIR fluorescence modes.
- Lymph Node Harvesting: All fluorescent lymph nodes (signal-to-background ratio > 1.5) are marked and resected. Surgeon also resects nodes based on standard clinical palpation/visual criteria from the same basin.
- Pathology & Data Correlation: All harvested nodes are sent for histopathological analysis (H&E staining). Sensitivity and specificity are calculated for clinical assessment, fluorescent assessment, and their combination against the gold standard of pathology.
Protocol 2: Quantitative ICG Clearance for Liver Function Assessment
- Patient Calibration: The ICG pulse spectrophotometry system (e.g., LiMON, Pulson Medical Systems) is calibrated to patient height, weight, and hemoglobin.
- Baseline Measurement: A sensor is placed on the patient's finger or nose.
- ICG Bolus Injection: A precise intravenous bolus of ICG (0.25–0.5 mg/kg) is administered via a central or large peripheral vein.
- Data Acquisition: The system non-invasively measures ICG concentration in the blood every 2 seconds for 10-15 minutes via optical density changes.
- Parameter Calculation: The software calculates:
- Plasma Disappearance Rate (PDR): %/min. Normal > 18%/min.
- ICG Retention Rate at 15 minutes (ICG-R15): %. Normal < 10%.
- Clinical Integration: The quantitative PDR/ICG-R15 value is integrated with CT volumetry, patient age, and surgeon's clinical evaluation to finalize the safe future liver remnant volume and surgical plan.
Visualizing the Hybrid Assessment Workflow
Diagram Title: Hybrid Assessment Decision Pathway
The Scientist's Toolkit: Key Research Reagent Solutions
| Item | Function in ICG/Clinical Assessment Research |
|---|---|
| Indocyanine Green (ICG) | Near-infrared fluorescent dye; acts as a blood flow and lymphatic tracer. Must be protected from light. |
| NIR Fluorescence Imaging Systems (e.g., PINPOINT, SPY Fluorescence Imaging) | Provides real-time visualization of ICG fluorescence overlayed on white-light anatomy. |
| ICG Pulse Spectrophotometry (e.g., LiMON System) | Non-invasively measures ICG concentration kinetics in blood to calculate quantitative liver function parameters (PDR, ICG-R15). |
| Standardized ICG Formulations (e.g., Diagnostic Green DG-100) | Ensures consistent dye concentration and purity for reproducible pharmacokinetic studies. |
| Fluorescence Phantoms & Calibration Tools | Used to calibrate imaging systems, quantify fluorescence intensity, and establish signal-to-background ratio thresholds. |
| Integrated Surgical Suites (e.g., Stryker 1688, Olympus ORBEYE) | Combines advanced imaging (NIR, 4K) with data overlays, enabling seamless hybrid assessment in the operative field. |
Conclusion
ICG fluorescence imaging represents a paradigm shift from purely subjective surgeon assessment towards an objective, data-enhanced intraoperative decision-making framework. The evidence strongly supports its superior accuracy in key areas like perfusion assessment and oncologic margin identification, directly translating to improved patient outcomes. However, its greatest value lies not in replacing surgical expertise, but in augmenting it with quantifiable, real-time biological data. For researchers and drug developers, this field is ripe for innovation. Future directions include the development of targeted ICG conjugates for molecular imaging, integration with artificial intelligence for automated signal interpretation, and the creation of standardized, quantifiable imaging biomarkers. The convergence of advanced contrast agents, smart imaging systems, and surgical robotics will define the next generation of precision surgery, firmly establishing objective fluorescence guidance as an indispensable component of the modern surgical armamentarium.