ICG Fluorescence Lymph Node Mapping in Gastric Cancer Surgery: Current Research, Protocols, and Clinical Validation
This comprehensive review examines Indocyanine Green (ICG) fluorescence imaging for lymph node mapping in gastric cancer surgery, tailored for researchers and drug development professionals.
ICG Fluorescence Lymph Node Mapping in Gastric Cancer Surgery: Current Research, Protocols, and Clinical Validation
Abstract
This comprehensive review examines Indocyanine Green (ICG) fluorescence imaging for lymph node mapping in gastric cancer surgery, tailored for researchers and drug development professionals. It explores the foundational science of ICG's lymphatic uptake and fluorescence mechanisms, details standardized procedural protocols for near-infrared (NIR) imaging, addresses common technical challenges and optimization strategies, and synthesizes the latest comparative clinical data on detection rates, survival outcomes, and cost-effectiveness versus traditional techniques. The article aims to provide a critical, evidence-based resource to guide further technological innovation and clinical trial design in surgical oncology.
The Science Behind ICG: Mechanisms, Pharmacokinetics, and Target Identification for Lymphatic Mapping
Molecular and Optical Fundamentals of Indocyanine Green (ICG) Fluorescence
Within the thesis "Optimization of ICG Lymph Node Mapping for Intraoperative Guidance in Gastric Cancer Surgery," a rigorous understanding of the molecular and optical fundamentals of Indocyanine Green (ICG) is paramount. The efficacy and quantification of lymph node fluorescence depend directly on the physicochemical behavior of ICG in biological environments. This section details the core principles and provides standardized protocols to ensure reproducible experimental conditions for in vitro and ex vivo research aimed at improving surgical outcomes.
Molecular Structure and Spectral Properties
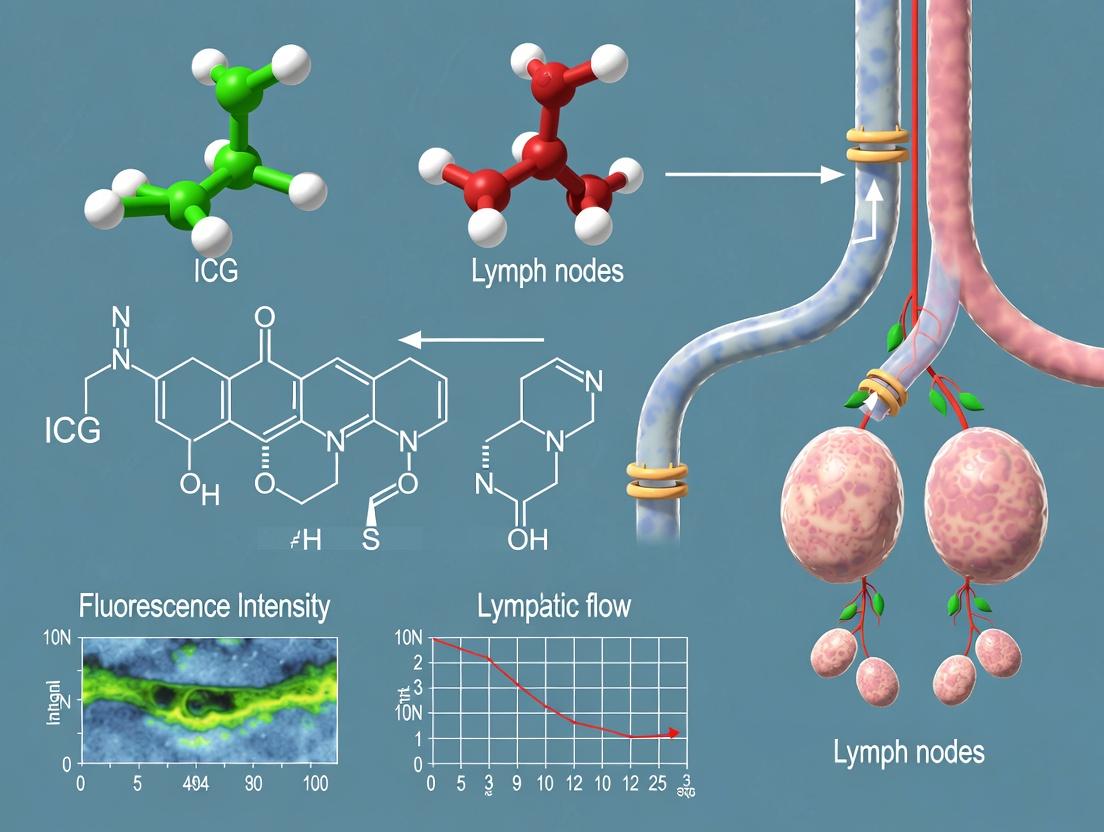
ICG (C43H47N2NaO6S2) is a tricarbocyanine dye with a hydrophobic polycyclic structure and hydrophilic sulfate groups. Its fluorescence is characterized by environment-sensitive spectral shifts.
Table 1: Key Optical Properties of ICG in Various Solvents
| Solvent/Environment | Peak Absorption (nm) | Peak Emission (nm) | Quantum Yield | Notes for Lymph Node Research |
|---|---|---|---|---|
| Dimethyl Sulfoxide (DMSO) | 780 | 815 | ~0.12 | Stock solution preparation. |
| Water (Pure) | 778 | 805 | ~0.003 | Low yield due to aggregation. |
| Plasma / 1% HSA | 805 | 835 | ~0.12 | Clinically relevant medium. Binding to albumin mimics in vivo conditions. |
| PBS (No protein) | 778 | 798 | <0.01 | Rapid aggregation and quenching; use for controlled aggregation studies. |
Diagram 1: ICG Molecular Behavior in Physiological Medium
Critical Experimental Protocols
Protocol: Preparation of ICG-Albumin Complex forEx VivoNodal Staining
Objective: Reproduce the in vivo fluorescent complex for standardized bench research on gastric lymph nodes. Reagents: ICG (purity >95%), Human Serum Albumin (HSA), Phosphate-Buffered Saline (PBS), 0.22 µm filter.
- Prepare a 1 mM ICG stock in pure DMSO. Store at -20°C in the dark (<1 month).
- Dilute HSA in PBS to a 1% (w/v) solution. Filter sterilize.
- Critical Step: Rapidly inject the ICG stock into the 1% HSA solution with gentle vortexing to achieve a final ICG concentration of 10-50 µM (simulating clinical doses). Avoid reverse addition.
- Incubate at 37°C for 10 minutes to allow complex stabilization.
- Use immediately for nodal immersion or perfusion studies. Do not store the complex >4 hours.
Protocol: Quantifying ICG Fluorescence Intensity in Resected Lymph Nodes
Objective: Standardize fluorescence measurement from excised tissue for thesis comparative analysis. Equipment: NIR Fluorescence Imaging System, Calibrated Fluorescence Phantoms, Analytical Balance.
- Calibration: Image a set of fluorescence phantoms (e.g., serial ICG-HSA dilutions in 1% intralipid) to generate a standard curve (Intensity vs. [ICG]).
- Sample Prep: Weigh each resected lymph node. Image under identical settings (exposure, gain, f-stop, distance).
- Analysis: Use ROI software to measure mean fluorescence intensity (MFI) in the node. Subtract background (adjacent non-fluorescent tissue).
- Normalization: Report as MFI per mg of tissue weight. Compare to standard curve for estimated [ICG] uptake.
The Scientist's Toolkit: Key Research Reagent Solutions
Table 2: Essential Materials for ICG Lymphatic Mapping Research
| Item | Function & Relevance to Thesis |
|---|---|
| ICG for Injection (USP) | Clinical-grade standard; ensures translational relevance to surgical trials. |
| Human Serum Albumin (Fraction V) | Creates physiologic ICG-HSA complex for in vitro and ex vivo models. |
| Fluorescent Nanosphere Standards (NIR) | Enables system calibration and quantitative comparison across imaging sessions. |
| 1% Intralipid Phantom | Tissue-simulating scattering medium for validating imaging system depth sensitivity. |
| Matrigel / Collagen Matrix | Used for creating 3D in vitro lymphatic endothelial cell models to study uptake mechanisms. |
| Anti-LYVE-1 / Podoplanin Antibodies | Validate lymph node and lymphatic vessel identity in histological sections post-ICG imaging. |
| NIR Fluorescence Imaging System (e.g., LI-COR Pearl, Fluobeam) | Essential for detecting and quantifying the 830+ nm emission from ICG in tissue. |
Photophysical Pathways and Quenching Mechanisms
Understanding deactivation pathways is critical for optimizing signal-to-noise in nodal mapping.
Diagram 2: ICG Photophysical Pathways and Key Quenchers
Application Note: Optimizing Concentration for Nodal Signal
For gastric lymph node mapping, the administered ICG dose must balance deep tissue penetration (NIR-I window) and signal quenching.
- Low Concentration (<10 µM): Predominantly monomeric, high quantum yield, but signal may be weak.
- Optimal Range (10-50 µM): Stable monomeric form in plasma, providing strong, quantifiable nodal fluorescence.
- High Concentration (>100 µM): Aggregation-caused quenching (ACQ) dominates, reducing fluorescence yield despite high absolute dye content.
Protocol 3: Titration to Identify Aggregation Threshold in Buffer.
- Prepare ICG in PBS across a range of 1 µM to 200 µM from a DMSO stock.
- Measure absorbance at 778 nm (monomer) and 700 nm (aggregate).
- Calculate the A700/A778 ratio. A sharp increase indicates the critical aggregation concentration.
- Correlate with fluorescence intensity measurements to identify the concentration of maximum signal before quenching.
Introduction and Thesis Context Within the broader thesis investigating the optimization of indocyanine green (ICG) for lymphatic mapping in gastric cancer surgery, understanding its fundamental pharmacokinetics is critical. This document details the application notes and protocols for studying ICG's journey from peritumoral injection to lymph node visualization. Precise characterization of its uptake by initial lymphatic capillaries, binding dynamics with interstitial proteins, and subsequent drainage patterns is essential for standardizing clinical protocols, improving sentinel lymph node detection rates, and developing next-generation fluorescent tracers.
1. Core Pharmacokinetic Data Summary
Table 1: Key Quantitative Parameters of ICG in Gastric Lymphatic Studies
| Parameter | Typical Value/Range | Significance |
|---|---|---|
| Molecular Weight | 775 Da | Small enough for initial lymphatic uptake, but exhibits protein-binding. |
| Plasma Protein Binding (Primary) | >95% (Albumin) | Determines hydrodynamic size and lymphatic transport mechanism. |
| Hydrodynamic Diameter (Bound) | ~7 nm (ICG-HSA) | Governs entry into lymphatic capillaries (≈10-100 nm fenestrations). |
| Peak Lymphatic Signal Time (Gastric) | 5 - 30 minutes | Depends on injection depth (submucosal vs. subserosal) and tissue characteristics. |
| Effective NIR Excitation/Emission | ~805 nm / ~835 nm | Minimizes tissue autofluorescence and allows for deep tissue penetration. |
| Recommended Diagnostic Dose | 0.1 - 0.5 mg/mL (0.5 - 1.0 mL total) | Balances signal intensity with background noise and safety profile. |
Table 2: Factors Influencing ICG Drainage Patterns in Gastric Tissue
| Factor | Effect on Uptake/Drainage | Experimental Consideration |
|---|---|---|
| Injection Depth | Submucosal: slower, defined basins. Subserosal: faster, diffuse. | Must be standardized for reproducible research. |
| Injection Volume | Large volumes (>1mL) may cause retrograde flow or false basins. | Use minimal effective volume (e.g., 0.1-0.2 mL per injection site). |
| Tissue Integrity/Pressure | Tumor fibrosis impedes drainage; massage may accelerate it. | Document tumor stage and avoid manual manipulation during timing studies. |
| Protein Concentration (Interstitium) | Determines fraction of ICG bound vs. free, affecting drainage kinetics. | Control for nutritional/albumin status in in vivo models. |
2. Experimental Protocols
Protocol 1: Ex Vivo Quantification of ICG-Albumin Binding Affinity Objective: Determine the binding constant (Kd) of ICG to human serum albumin (HSA) under simulated interstitial conditions. Materials: See "Research Reagent Solutions" below. Methodology:
- Prepare a 10 µM HSA solution in phosphate-buffered saline (PBS), pH 7.4.
- Create a series of ICG solutions (0.1 to 20 µM) in the HSA solution and in plain PBS.
- Incubate at 37°C for 15 minutes protected from light.
- Measure fluorescence intensity (ex: 780 nm, em: 820 nm) using a plate reader.
- Correct for background fluorescence of HSA and free ICG in PBS.
- Analyze data using a one-site specific binding model:
Bound ICG = (Bmax * [ICG]) / (Kd + [ICG]), where Bmax is maximum binding capacity. - Plot bound vs. free ICG concentration to derive Kd.
Protocol 2: In Vivo Murine Model for Gastric Lymphatic Drainage Kinetics Objective: Characterize the time-dependent uptake and drainage pattern of ICG from the gastric wall. Materials: Athymic nude mouse, ICG solution (0.25 mg/mL), NIR fluorescence imaging system, microsyringe. Methodology:
- Anesthetize and secure the mouse.
- Perform a minimal laparotomy to expose the stomach.
- Using a 30G needle, inject 10 µL of ICG solution submucosally at the anterior gastric wall.
- Commence immediate time-lapse NIR imaging (1 frame/minute for 60 minutes).
- Quantify signal intensity (Mean Fluorescence Intensity, MFI) in the injection site and the primary draining lymph node basin over time.
- Calculate key pharmacokinetic parameters: Time-to-first-detect (TFD), Time-to-peak-intensity (TPI), and Signal-to-Background Ratio (SBR).
- Excise tissues post-mortem for histological correlation (fluorescence microscopy).
Protocol 3: Clinical Intraoperative Lymphatic Mapping Protocol Objective: Standardize ICG administration for sentinel lymph node biopsy in gastric cancer surgery research. Materials: Sterile ICG (0.5 mg/mL), endoscopic injection needle, NIR laparoscope. Methodology:
- Preoperatively, confirm patient has no iodine allergy.
- Intraoperatively, prior to gastrectomy, perform endoscopic peritumoral submucosal injection.
- Administer 0.5 mL aliquots at 4 quadrants around the tumor (total volume: 2.0 mL, total dose: 1.0 mg ICG).
- Wait 15-30 minutes for lymphatic drainage.
- Proceed with laparoscopic/open surgery using NIR imaging to identify all fluorescent lymphatic channels and nodes.
- Document the sequence of node appearance, their anatomical location, and fluorescence intensity.
- Excise all fluorescent nodes as sentinel lymph nodes for pathological ultra-staging.
3. Signaling Pathways and Workflow Visualizations
Title: ICG Pharmacokinetic Pathway in Gastric Tissue
Title: In Vivo Gastric ICG Drainage Kinetics Workflow
4. Research Reagent Solutions Toolkit
Table 3: Essential Materials for ICG Gastric Lymphatic Research
| Item | Function & Research Purpose | Example/Notes |
|---|---|---|
| ICG for Injection (Lyophilized) | The core fluorescent tracer. Must be reconstituted precisely. | Pulsion ICG, Diagnogreen; protect from light. |
| Human Serum Albumin (HSA) | For ex vivo binding studies and creating controlled ICG-HSA complexes. | Sigma-Aldrich A1653; use fatty acid-free for consistent results. |
| Near-Infrared (NIR) Imaging System | For detecting ICG fluorescence in real-time during in vivo studies. | Hamamatsu PDE Neo, FLARE, or Karl Storz IMAGE1 S. |
| Fluorescence Plate Reader | For high-throughput ex vivo quantification of binding kinetics and tissue content. | Tecan Spark, BioTek Cytation; requires NIR-capable filters. |
| Small Animal Imaging Platform | Enables longitudinal, non-invasive tracking of lymphatic drainage in murine models. | PerkinElmer IVIS Spectrum, Carestream Xtreme. |
| Micro-injection Syringe & Needles | Ensures precise, reproducible delivery volume and depth in small tissues. | Hamilton Syringes (e.g., 701N) with 30-33G needles. |
| NIR-Compatible Laparoscope | Critical for translating findings to clinical research and intraoperative protocols. | Stryker 1688, Olympus VISERA ELITE II. |
| Image Analysis Software | Quantifies fluorescence intensity (MFI), kinetics, and spatial distribution. | ImageJ (FIJI) with custom macros, Living Image Software. |
Within the broader thesis investigating ICG lymph node mapping for precision gastric cancer surgery, this document details the biological imperative for targeting sentinel lymph nodes (SLNs) and micrometastatic deposits. SLNs are the primary drainage site from the primary tumor and are the most likely initial location of metastatic spread. Micrometastases (tumor deposits >0.2 mm and ≤2.0 mm) and isolated tumor cells (ITCs, ≤0.2 mm) represent early, often subclinical, stages of lymph node involvement that are frequently missed by conventional histopathology. Targeting these nodes is predicated on the "seed and soil" hypothesis, where tumor cells (seed) interact with the unique immunosuppressive and pro-growth microenvironment of the lymph node (soil). Successful targeting can prevent further systemic dissemination, potentially improving staging accuracy and creating opportunities for novel targeted and immunotherapeutic interventions delivered locoregionally.
Table 1: Detection Rates and Prognostic Impact of SLN & Micrometastasis in Gastric Cancer
| Metric | Reported Rate / Value | Clinical Significance / Note |
|---|---|---|
| SLN Detection Rate (using ICG) | 95-100% | High feasibility for mapping in early gastric cancer. |
| SLN Sensitivity for N+ Disease | ~92% (in T1-T2 tumors) | Indicates false-negative rate of ~8%. |
| Micrometastasis Incidence in SLNs | 15-30% (in node-negative by H&E) | Upstages disease, significant prognostic factor. |
| 5-Year Survival (N0 vs. Micrometastasis+) | ~90% vs. ~65-75% | Micrometastasis confers significantly worse prognosis. |
| Isolated Tumor Cells (ITCs) Incidence | 10-20% | Prognostic relevance remains debated; may indicate biological potential. |
Table 2: Key Signaling Pathways in Lymph Node Metastasis
| Pathway / Factor | Primary Role in LN Metastasis | Potential Therapeutic Target |
|---|---|---|
| VEGF-C / VEGFR-3 | Lymphangiogenesis, increases lymphatic vessel density & permeability. | Anti-VEGF-C/R-3 antibodies, tyrosine kinase inhibitors. |
| CCR7 / CCL21 | Chemotaxis, directs tumor cells to lymph nodes expressing CCL21. | CCR7 antagonists. |
| TGF-β | Induces epithelial-mesenchymal transition (EMT), immunosuppression in LN. | TGF-β inhibitors, TGF-β receptor blockers. |
| PD-L1 / PD-1 | Immune checkpoint upregulation in LN microenvironment, enabling immune escape. | PD-1/PD-L1 checkpoint inhibitors. |
Experimental Protocols
Protocol 1: Ex Vivo ICG-Based Sentinel Lymph Node Mapping & Ultrastaging Objective: To identify SLNs from gastrectomy specimens and perform detailed pathological ultrastaging to detect micrometastases and ITCs.
- Specimen Preparation: Within 30 minutes of resection, inject the gastric specimen subserosally around the tumor with 0.5-1.0 mL of ICG solution (0.5 mg/mL).
- Imaging & SLN Dissection: Use a near-infrared (NIR) fluorescence imaging system (e.g., PDE, FLARE) in a dark room. Identify and dissect all fluorescent lymph nodes (SLNs) under real-time NIR guidance.
- Tissue Processing: Bisect each SLN. One half is processed for routine H&E staining (one section). The other half is serially sectioned at 0.2-0.5 mm intervals.
- Ultrastaging: For each serial section, perform:
- Level 1: Standard H&E staining.
- Level 2: Immunohistochemistry (IHC) using anti-cytokeratin (AE1/AE3) antibodies to identify occult epithelial/tumor cells.
- (Optional) Level 3: RT-PCR for tumor-specific markers (e.g., CEA, CK20).
- Classification: Classify findings as macrometastasis (>2.0 mm), micrometastasis (>0.2 mm, ≤2.0 mm), or ITCs (≤0.2 mm or single cells by IHC/RT-PCR).
Protocol 2: In Vivo Molecular Targeting of Micrometastatic LN in Murine Models Objective: To evaluate drug delivery efficacy to metastatic SLNs using a lymphatic-targeting nanocarrier system.
- Model Establishment: Use an orthotopic or subcutaneous gastric cancer murine model (e.g., MKN-45, NUGC-4 cells).
- Lymphatic Mapping: Inject ICG intratumorally to identify draining lymphatic basin and SLN.
- Nanoparticle Formulation: Prepare fluorescently labeled (e.g., Cy5.5) poly(lactic-co-glycolic acid) (PLGA) nanoparticles conjugated with anti-PD-L1 antibody and loaded with a chemotherapeutic (e.g., docetaxel).
- Intervention: Inject nanoparticles peritumorally. Control groups receive free drug or non-targeted nanoparticles.
- Evaluation (24-72 hrs post-injection):
- In Vivo Imaging: Use NIR/fluorescence imaging to quantify nanoparticle accumulation in SLN vs. primary tumor and systemic organs.
- Ex Vivo Analysis: Harvest SLNs. Analyze by flow cytometry for immune cell populations (Tregs, CD8+ T cells) and by IHC for apoptosis (TUNEL) and proliferation (Ki-67) in metastatic foci.
Visualizations
Diagram 1: The "Seed and Soil" Pathway to LN Metastasis (86 chars)
Diagram 2: SLN Mapping & Ultrastaging Workflow (75 chars)
The Scientist's Toolkit: Research Reagent Solutions
Table 3: Essential Materials for ICG Mapping & LN Metastasis Research
| Item / Reagent | Function / Application | Key Note |
|---|---|---|
| Indocyanine Green (ICG) | Near-infrared fluorescent dye for real-time lymphatic mapping. | FDA-approved; excitation/emission ~780/820 nm. |
| Near-Infrared Imaging System (e.g., FLARE, PDE Neo) | Detects ICG fluorescence for intraoperative or ex vivo SLN identification. | Enables real-time visualization of lymphatic architecture. |
| Anti-Cytokeratin Antibodies (AE1/AE3 clone) | Immunohistochemistry marker for detecting epithelial-derived tumor cells in LNs. | Gold standard for pathological ultrastaging. |
| Recombinant Human VEGF-C | To stimulate lymphangiogenesis in in vitro or in vivo models. | Used to study mechanistic role of lymphatic growth in metastasis. |
| CCR7/CCL21 Assay Kits (ELISA, Chemotaxis) | Quantifies expression and functional activity of key lymphotropic chemokine axis. | For evaluating tumor cell migration towards lymphatic factors. |
| PLGA-PEG Nanoparticles | Biodegradable, biocompatible carrier for lymphatic-targeted drug delivery. | Can be conjugated with targeting ligands (e.g., anti-PD-L1) and loaded with therapeutics. |
| Phospho-Specific Antibodies (p-Smad2/3, p-Akt) | Detects activation of key signaling pathways (TGF-β, PI3K) in metastatic niches via IHC/WB. | For mechanistic studies of LN microenvironment signaling. |
The precise mapping of lymphatic drainage and sentinel lymph nodes (SLNs) is critical in surgical oncology, particularly for gastric cancer, to balance oncologic efficacy with morbidity reduction. This evolution is framed within a thesis investigating ICG lymph node mapping for tailoring gastric cancer surgery. The journey began with visual dyes and has transitioned to technology-driven, real-time near-infrared (NIR) fluorescence guidance.
Table 1: Historical Milestones in Lymphatic Mapping Tracers
| Era | Tracer Type | Key Agent(s) | Detection Method | Primary Advantage | Key Limitation |
|---|---|---|---|---|---|
| Early 20th C | Vital Blue Dye | Patent Blue V, Isosulfan Blue, Methylene Blue | Visual Inspection | Simple, inexpensive, no specialized equipment. | Poor tissue penetration, rapid diffusion, subjective visualization. |
| 1990s | Radio-colloid | Technetium-99m (99mTc) | Gamma Probe / SPECT | Objective, pre-operative imaging (lymphoscintigraphy). | Radiation exposure, no real-time visual guidance, logistical complexity. |
| 2000s | Combined Technique | Blue Dye + 99mTc | Visual + Gamma Probe | Improved accuracy via dual-modality. | Combines limitations of both methods; still no real-time visual in situ. |
| 2010s-Present | NIR Fluorescence | Indocyanine Green (ICG) | NIR Fluorescence Imaging Systems | Real-time, high-resolution, visual and quantitative intraoperative guidance. | Limited tissue penetration (~5-10 mm), cost of imaging systems. |
Application Notes: ICG for Gastric Cancer SLN Mapping
Indocyanine Green (ICG), a FDA-approved NIR fluorophore (Ex/Em: ~805/830 nm), has become the clinical and research standard. Its utility in gastric cancer surgery research is multifaceted.
Table 2: Quantitative Performance Metrics of ICG vs. Historical Tracers in Gastric Cancer
| Metric | Vital Blue Dye (e.g., Patent Blue) | Radio-Colloid (99mTc) | NIR Fluorescence (ICG) | Notes |
|---|---|---|---|---|
| Detection Rate | 75-85% | 90-95% | 95-100% | ICG consistently shows superior identification in clinical studies. |
| Sensitivity | 80-90% | 90-95% | 95-98% | Higher sensitivity reduces false negatives in SLN biopsy. |
| Number of SLNs Identified | 2.5 ± 1.2 | 3.1 ± 1.5 | 4.5 ± 2.0 | ICG often maps more distal nodes in the lymphatic basin. |
| Time to Visualization | 1-3 minutes | N/A (pre-op) | 15-30 seconds | ICG provides immediate intraoperative feedback. |
| Tissue Penetration Depth | Surface only | Several cm | 5-10 mm | ICG allows subsurface visualization of lymphatics. |
Key Research Applications:
- Defining Lymphatic Drainage Patterns: ICG angiography can reveal unpredictable drainage in gastric sub-regions, challenging standard lymphadenectomy templates.
- Real-Time Tumor Delineation: Using the "tumor-targeted" vs. "passive drainage" property of ICG to improve positive margin rates.
- Quantifying Fluorescence Signal: Research-grade systems allow quantification of signal intensity, correlating with metastatic burden or tracer kinetics.
Experimental Protocols
Protocol 1: Standard ICG Lymphatic Mapping for Open or Laparoscopic Gastric Cancer Surgery
Objective: To intraoperatively identify the sentinel and draining lymph node basin in real-time.
The Scientist's Toolkit: Research Reagent Solutions
| Item | Specification / Example | Function |
|---|---|---|
| NIR Fluorophore | Indocyanine Green (ICG), sterile powder | The exogenous contrast agent that emits NIR light upon excitation. |
| ICG Solvent | Aqueous solvent (e.g., sterile water) | To reconstitute ICG powder to a precise concentration. |
| NIR Imaging System | e.g., Karl Storz IMAGE1 S, Stryker PINPOINT, or research systems (PerkinElmer, Hamamatsu). | Contains light source (NIR laser/LED), filtered camera, and software to display fluorescence overlay. |
| Calibration Phantom | Solid phantom with known ICG concentrations. | Validates system sensitivity and allows inter-study signal normalization. |
| Injectable Syringe | 1mL tuberculin syringe with 27-30G needle. | For precise subserosal injection of ICG solution. |
Procedure:
- ICG Preparation: Reconstitute 25mg ICG powder in 10mL of sterile aqueous solvent to create a 2.5 mg/mL stock solution. Further dilute to the working concentration (typically 0.5-1.0 mg/mL) using the same solvent. Protect from light.
- Patient Positioning & Exposure: Position the patient per standard surgical protocol. Achieve adequate exposure of the stomach.
- Tracer Injection: Using a tuberculin syringe, administer four subserosal injections (0.5 mL each) of the ICG working solution around the primary tumor or its presumed location (for early cancers). Total volume: 2.0 mL.
- Imaging System Setup: Activate the NIR fluorescence imaging system. Switch to the appropriate NIR fluorescence mode (often an overlay of green/white on the color image).
- Real-Time Imaging & Mapping: Immediately after injection, observe the monitor. Fluorescent lymphatic channels will become visible within seconds, draining to one or more fluorescent SLNs. The signal typically progresses to second-tier nodes within 5-15 minutes.
- Node Identification & Biopsy: Under NIR guidance, meticulously dissect and harvest all fluorescent nodes. These are designated as SLNs. Proceed with standard or tailored lymphadenectomy based on the study protocol.
- Ex Vivo Confirmation: After resection, re-scan the specimen and individual nodal packages with the NIR system to ensure no fluorescent nodes were missed.
Protocol 2: Ex Vivo Quantitative Analysis of ICG Fluorescence in Resected Lymph Nodes
Objective: To quantify the fluorescence intensity of resected lymph nodes for correlation with histopathological status.
Procedure:
- Sample Preparation: Immediately after resection, place each individually labeled lymph node on a non-fluorescent background.
- Standardized Imaging: Place samples in a closed, light-proof imaging box containing a research-grade NIR fluorescence imager (e.g., LI-COR Odyssey, PerkinElmer IVIS). Use fixed camera distance, exposure time, and excitation power.
- Image Acquisition: Acquire both white light and NIR fluorescence images.
- Signal Quantification: Using the instrument's software (e.g., ImageJ with appropriate plugins, IVIS Living Image), draw regions of interest (ROIs) around each node. Record the following for each node: total fluorescence radiant efficiency, mean pixel intensity, and background-subtracted signal.
- Data Correlation: After quantitative analysis, nodes undergo standard histopathological processing (H&E, immunohistochemistry). The fluorescence intensity data is then statistically correlated with nodal metastatic status, tumor size, and other pathological variables.
Visualization of Concepts and Workflows
Application Notes: Clinical and Mechanistic Variability in ICG Uptake
The efficacy of Indocyanine Green (ICG) for lymph node (LN) mapping in gastric cancer (GC) is influenced by significant inter- and intra-tumor heterogeneity. This variability presents a critical research gap within the broader thesis on optimizing ICG-guided surgery. Key factors driving this variability are outlined below.
Table 1: Documented Clinical Variability in ICG Fluorescence Patterns
| Gastric Cancer Subtype / Feature | ICG Fluorescence Pattern (Peri-tumoral) | Reported Detection Rate Range | Key Correlations & Hypotheses |
|---|---|---|---|
| Differentiated (Intestinal type) | Consistently strong, homogenous signal | 85-98% | Correlates with preserved lymphatic architecture and active cellular uptake (OATP transporters). |
| Undifferentiated (Diffuse type) | Weak, patchy, or absent signal | 45-75% | Disrupted lymphatic channels (desmoplasia, signet-ring cell infiltration); potential downregulation of uptake mechanisms. |
| Lauren Classification: Intestinal | Strong | 90-95% | Associated with higher OATP1B3 expression. |
| Lauren Classification: Diffuse | Weak/Inconsistent | 50-80% | Associated with low OATP1B3 and high MRP2 (efflux pump) expression. |
| Tumor Stage (T1/T2 vs T3/T4) | Signal diminishes with deeper invasion | T1: ~95% T4: ~70% | Tumor destruction of lymphatics; possible increased interstitial pressure reducing drainage. |
| Previous Neoadjuvant Therapy | Significantly attenuated signal | 60-80% post-CTx | Chemotherapy-induced fibrosis and lymphatic regression. |
Table 2: Molecular Mechanisms Hypothesized to Drive ICG Variability
| Mechanism | Molecular Player(s) | Function in ICG Kinetics | Expression Trend in Subtypes |
|---|---|---|---|
| Cellular Uptake | OATP1B3 (SLCO1B3) | Primary sinusoidal uptake transporter. | High in Intestinal; Low in Diffuse. |
| Cellular Efflux | MRP2 (ABCC2) | Biliary efflux transporter; may export ICG from cells. | Low in Intestinal; High in Diffuse. |
| Lymphatic Integrity | VEGF-C/D, VEGFR-3 | Promotes lymphangiogenesis & functional lymphatic density. | Variable; impacts drainage efficiency. |
| Extracellular Matrix | Collagen, Fibronectin | Desmoplasia in diffuse-type impedes fluid/ICG diffusion. | High in Diffuse-type stroma. |
Experimental Protocols for Investigating ICG Variability
Protocol 1:Ex VivoQuantitative Fluorescence Imaging of Gastrectomy Specimens
Objective: To quantitatively compare ICG signal intensity and distribution across different GC subtypes in fresh surgical tissue.
Materials:
- Fresh gastrectomy specimen with tumor.
- ICG solution (0.5 mg/mL).
- Near-infrared (NIR) fluorescence imaging system (e.g., FLARE, PDE, SPY).
- Image analysis software (e.g., ImageJ with NIR plugins).
- Phosphate-buffered saline (PBS).
- Pathology cassettes.
Procedure:
- ICG Administration: Standard clinical protocol: 0.5 mg ICG injected subserosally around the tumor in vivo 15-20 minutes before resection.
- Specimen Handling: Immediately after resection, place the fresh, unopened specimen on a non-fluorescent background.
- NIR Imaging: Acquire en bloc NIR fluorescence images under standardized conditions (exposure time, distance, aperture). Include a fluorescent reference standard for calibration.
- Dissection & Re-imaging: Following standard pathologic dissection, image individual LN stations. Record fluorescence status (positive/negative) and measure mean fluorescence intensity (MFI) in regions of interest (ROI).
- Correlation: Submit all tissue for standard H&E and immunohistochemistry (IHC) staining. Correlate MFI and detection rates with histologic subtype, Lauren classification, and molecular markers.
Protocol 2: Immunohistochemical Analysis of ICG-Related Transporters
Objective: To correlate protein expression levels of OATP1B3 and MRP2 with ICG fluorescence patterns.
Materials:
- Formalin-fixed, paraffin-embedded (FFPE) tissue blocks of primary gastric tumor and matched LNs.
- Primary antibodies: Anti-OATP1B3 antibody, Anti-MRP2 antibody.
- IHC staining kit (with HRP/DAB).
- Light microscope with digital camera.
- IHC scoring software or protocol.
Procedure:
- Sectioning: Cut 4-5 µm sections from FFPE blocks.
- IHC Staining: Perform standard deparaffinization, antigen retrieval, and blocking. Apply primary antibodies and appropriate detection systems according to manufacturer protocols. Include positive and negative controls.
- Scoring: Evaluate staining in tumor cells and lymphatic endothelial cells using a semi-quantitative method (e.g., H-score: product of intensity [0-3] and percentage of positive cells [0-100%]).
- Statistical Analysis: Compare H-scores between ICG fluorescence-positive and fluorescence-negative tumors/LNs, and across different histologic subtypes using appropriate statistical tests (e.g., Mann-Whitney U test).
Protocol 3:In VitroCellular Uptake and Efflux Assay
Objective: To functionally validate the role of specific transporters in ICG uptake/retention using GC cell lines modeling different subtypes.
Materials:
- GC cell lines (e.g., MKN74 [intestinal-type], MKN45 [diffuse-type]).
- Cell culture medium and supplements.
- ICG.
- Transport inhibitors (e.g., Rifampicin for OATPs, MK571 for MRPs).
- NIR fluorescent plate reader or flow cytometer with NIR capabilities.
- ˚96-well black-walled plates.
Procedure:
- Cell Seeding: Seed cells in 96-well plates and culture until 80% confluent.
- Inhibition Pre-treatment: Treat selected wells with transporter inhibitors or vehicle control for 1 hour.
- ICG Uptake Phase: Add ICG (e.g., 10 µM) to all wells. Incubate for 30-60 min at 37°C.
- Wash & Measurement: Gently wash cells with PBS. Immediately measure cellular fluorescence using a plate reader (ex/em: ~780/820 nm).
- Efflux Phase (Optional): After uptake, replace medium with ICG-free medium with/without inhibitors. Measure fluorescence at time points (e.g., 0, 30, 60 min) to calculate efflux rate.
- Analysis: Normalize fluorescence to protein content. Compare ICG accumulation/efflux between cell lines and inhibitor conditions.
Visualizations
ICG Signal Variability Logic Model
Integrated Ex Vivo Research Workflow
The Scientist's Toolkit: Key Research Reagent Solutions
Table 3: Essential Materials for Investigating ICG Variability
| Item / Reagent | Function in Research Context | Example / Note |
|---|---|---|
| Clinical-grade ICG | The fluorescent tracer for all in vivo and ex vivo mapping studies. | Ensure consistent formulation (e.g., Pulsion, Diagnostic Green) across studies. |
| NIR Fluorescence Imaging System | Enables detection and quantification of ICG signal in real-time during surgery or in specimens. | Systems: FLARE, SPY, Quest, PDE. Must have quantitative analysis software. |
| Anti-OATP1B3 Antibody | Key reagent for IHC to correlate transporter expression with ICG uptake patterns. | Validate for specificity in FFPE gastric tissue. Rabbit monoclonal recommended. |
| Anti-MRP2 Antibody | Key reagent for IHC to correlate efflux pump expression with reduced ICG retention. | Critical for diffuse-type GC studies. |
| Validated GC Cell Lines | In vitro models representing different subtypes for mechanistic uptake/efflux studies. | Intestinal-type: MKN74, NCI-N87. Diffuse-type: MKN45, KATO III. |
| Specific Transporter Inhibitors | Pharmacologic tools to dissect the contribution of specific transporters in cellular assays. | Rifampicin (OATP inhibitor), MK571 (MRP inhibitor). Use with appropriate controls. |
| Fluorescent Plate Reader / NIR Flow Cytometer | For quantifying cellular ICG uptake and efflux kinetics in in vitro assays. | Requires capability in 800+ nm range (e.g., Li-Cor Odyssey, specialized flow cytometers). |
Implementing ICG Mapping: Step-by-Step Protocols, Dosing, and Intraoperative Imaging Systems
Standardized Preoperative and Intraoperative Protocols for ICG Administration
Application Notes and Protocols for ICG Lymph Node Mapping in Gastric Cancer Research
The standardization of Indocyanine Green (ICG) protocols is paramount for generating reproducible, high-quality data in gastric cancer lymph node mapping research. Consistent methodology minimizes inter-operator variability, allowing for valid comparisons across studies and institutions, which is essential for evaluating the efficacy of novel therapeutic agents or surgical techniques in clinical trials.
Preoperative Preparation and ICG Reconstitution Protocol
Objective: To ensure consistent preparation of the ICG solution for endoscopic peritumoral injection.
Detailed Methodology:
- Reagent Preparation:
- Obtain lyophilized ICG powder (e.g., 25 mg vial).
- Aseptically reconstitute with 5-10 mL of Sterile Water for Injection (WFI) provided by the manufacturer to create a concentrated stock solution (~2.5-5 mg/mL).
- Gently swirl until completely dissolved. Do not shake vigorously.
- Further dilute the stock solution in 0.9% Sodium Chloride Injection (Normal Saline) to the final working concentration. Protect from light.
Quantitative Data Summary:
Table 1: Standardized ICG Dosing and Reconstitution Parameters
| Parameter | Standard Protocol Range | Optimized Research Recommendation | Notes for Drug Development Trials |
|---|---|---|---|
| Total ICG Dose | 0.1 - 0.5 mg | 0.25 mg | Fixed dose recommended over weight-based for initial standardization. |
| Final Concentration | 0.05 - 0.5 mg/mL | 0.125 mg/mL | Lower concentration reduces tissue staining artifact. |
| Injection Volume per Site | 0.1 - 0.5 mL | 0.2 mL | Ensures adequate depot without excessive diffusion. |
| Number of Injection Sites | 4-6 (circumferential) | 4 (Anterior, Posterior, Lesser, Greater Curvature) | Standardizes lymphatic drainage patterns. |
| Injection Depth | Submucosal | Submucosal | Critical for consistent lymphatic uptake. Intramuscular injection is a protocol deviation. |
| Time to Imaging (Interval) | 15 min - 24 hours | 16-18 hours (Pre-op EGD) | Allows for optimal LN migration; ideal for scheduled OR start times. |
Intraoperative Imaging and Data Acquisition Protocol
Objective: To systematically capture quantitative and qualitative fluorescence data during surgery.
Detailed Methodology:
- Imaging System Setup:
- Calibrate the near-infrared (NIR) fluorescence imaging system according to the manufacturer's specifications before each procedure.
- Set and document fixed parameters: gain, intensity, and distance from the operative field.
- Use a standardized color palette (e.g., green-on-black or spectrum) for all recordings.
- Surgical Phase Imaging:
- Baseline: Capture initial in-situ fluorescence before any significant dissection.
- Dissection: Record identification of each fluorescent lymph node (LN).
- Ex Vivo: Image the resected specimen and subsequently, the individually harvested LNs on a back table.
- Data Collection:
- Record the sequence of LN detection.
- Harvest fluorescent and non-fluorescent LNs separately for pathological correlation.
- Use software tools to document Signal-to-Background Ratios (SBR) when available.
Quantitative Data Summary:
Table 2: Intraoperative Metrics and Outcome Measures
| Metric | Definition/Measurement Method | Target Value (Benchmark) | Relevance to Research |
|---|---|---|---|
| Detection Rate | (Number of patients with ≥1 fluorescent LN / Total patients) x 100 | >95% | Primary feasibility endpoint. |
| Total LN Yield | Total number of LNs retrieved from specimen (fluorescent + non-fluorescent) | ≥30 LN (AJCC guideline) | Quality control for surgery. |
| Fluorescent LN Count | Absolute number of ICG+ LNs retrieved per patient | Protocol-dependent (e.g., 5-15) | Key quantitative output. |
| Sensitivity | (ICG+ & Path+ LNs) / (All Path+ LNs) x 100 | 80-95% | Measures technique accuracy for nodal disease. |
| Signal-to-Background Ratio (SBR) | Mean fluorescence intensity (LN) / Mean intensity (background tissue) | ≥2.0 | Objective, quantifiable signal metric for device/drug studies. |
Visualization of Experimental Workflow
Diagram 1: Endoscopic Preoperative ICG Injection Workflow
Diagram 2: Intraoperative Imaging & LN Harvest Protocol
The Scientist's Toolkit: Research Reagent Solutions
Table 3: Essential Materials for ICG Lymphatic Mapping Research
| Item / Reagent | Function / Purpose in Protocol | Research-Grade Specification Notes |
|---|---|---|
| Indocyanine Green (ICG) | Near-infrared fluorescent dye for lymphatic mapping. | Use pharmaceutical-grade, lyophilized powder. Verify excitation/emission peaks (~805/835 nm). Lot-to-lot consistency is critical. |
| NIR Fluorescence Imaging System | Detects and visualizes ICG fluorescence. | Must have dedicated NIR channel (800-850 nm). Systems should allow for video/image capture and SBR quantification. |
| Sterile Water for Injection (WFI) | Initial reconstitution of lyophilized ICG. | Must be sterile, apyrogenic. Use manufacturer-provided diluent if included. |
| 0.9% Sodium Chloride (Normal Saline) | Diluent for creating final working ICG solution. | Isotonic solution prevents tissue irritation upon injection. |
| Endoscopic Injection Needle | For precise submucosal delivery of ICG. | Disposable, 23-25 gauge needle. Length should be appropriate for endoscope working channel. |
| LN Specimen Collection Kit | For organized retrieval and labeling of LNs. | Separate, color-coded containers for ICG+ and ICG- nodes. Pre-printed labels with patient ID and node number. |
| Formalin-Fixed Paraffin-Embedded (FFPE) Blocks | For standard pathological analysis of harvested LNs. | Enables correlation of fluorescence status with histology (tumor presence, size). |
| Standardized Pathology Protocol | Defines LN processing, slicing, and staining. | Mandatory for accurate sensitivity/specificity calculation (e.g., 2 mm serial sectioning). |
Application Notes: ICG Mapping in Gastric Cancer Surgery Research
Within the thesis framework of advancing sentinel lymph node (SLN) mapping and precision surgery for gastric cancer, these notes detail the critical optimization of Indocyanine Green (ICG) parameters. This document consolidates current research into actionable protocols and data to standardize and improve nodal visualization rates.
Table 1: Optimization of ICG Concentration for Gastric Lymphatic Mapping
| ICG Concentration (mg/mL) | Injection Volume (mL) | Total ICG Dose (mg) | Reported Efficacy (Visualization Rate) | Key Advantages | Reported Limitations |
|---|---|---|---|---|---|
| 0.5 - 1.25 | 0.2 - 0.5 per site | 0.1 - 0.625 | >95% SLN detection | Rapid uptake, clear contrast, minimal diffusion ("clouding") | Faster washout from SLNs |
| 2.5 - 5.0 | 0.1 - 0.2 per site | 0.25 - 1.0 | ~90-98% | Stronger signal, longer retention in nodes | Increased peritumoral tissue diffusion, obscuring anatomy |
| 0.05 - 0.25 (Low Dose) | 0.5 - 1.0 per site | 0.025 - 0.25 | 85-95% | Minimal background signal, ideal for precise lymphatic tracing | Requires highly sensitive NIR imaging systems |
Table 2: Comparison of Subserosal vs. Submucosal Injection Approaches
| Parameter | Subserosal Injection | Submucosal Injection (via Endoscopy) |
|---|---|---|
| Typical Timing | Intraoperative, after laparotomy | Preoperative (15-180 mins before surgery) |
| Technical Ease | Direct visual control, simple | Requires endoscopic expertise |
| Lymphatic Basin Mapping | Often maps the "first-echelon" nodal basin adjacent to tumor | May map a broader and potentially more anatomically complete lymphatic drainage pattern, including "second-tier" nodes. |
| Primary Research Use | Standardization for intraoperative SLN biopsy protocols | Studying individualized lymphatic drainage and skip metastases |
| Visualization Rate | High (>95%) for perigastric nodes | Slightly variable (90-98%), can reveal deeper nodal stations |
| Key Disadvantage | May not reveal true primary drainage pathways if altered by tumor or prior inflammation | Logistically more complex; potential for dye dispersion before imaging |
Table 3: Optimization of Injection Timing Relative to Imaging
| Injection Approach | Optimal Imaging Window Post-Injection | Rationale & Research Context |
|---|---|---|
| Intraoperative Subserosal | Immediate to 10 minutes | Allows for real-time, sequential mapping of lymphatic channels to SLNs. Ideal for dynamic studies of flow. |
| Preoperative Submucosal | 15 minutes to 3 hours | Provides time for ICG to travel to higher-echelon nodes. The 15-30 min window is optimal for SLN; 2-3 hours may reveal secondary nodes for comprehensive basin mapping. |
| Common Clinical Protocol | 30 minutes (pre-op submucosal) | Balances high SLN detection rate with practical surgical workflow. |
Experimental Protocols
Protocol A: Standardized Intraoperative Subserosal SLN Mapping Objective: To reliably identify the sentinel lymph node(s) for ex vivo analysis or guided resection.
- Preparation: Reconstitute ICG powder in sterile water to a concentration of 1.25 mg/mL. Load a 1mL syringe with a 25-30G needle.
- Exposure: Perform laparotomy and adequately expose the stomach.
- Injection: At the tumor site, inject 0.2-0.3 mL of ICG solution into the subserosal layer at four quadrants (total volume 0.8-1.2 mL). Ensure a wheal forms without leakage.
- Imaging: Immediately switch the near-infrared (NIR) laparoscope to fluorescence mode (usually ~800 nm excitation).
- Mapping & Documentation: Observe and record the sequence of lymphatic channel fluorescence and the first lymph node(s) to fluoresce. Mark these SLNs with sutures/clips.
- Resection: Proceed with standard or SLN-guided gastrectomy.
- Ex Vivo Analysis: Image the resected specimen under NIR to confirm SLN location before sending for histopathology (H&E, immunohistochemistry).
Protocol B: Preoperative Endoscopic Submucosal Mapping for Drainage Basin Analysis Objective: To map the complete lymphatic drainage basin for research on metastatic patterns.
- Preparation: Reconstitute ICG to 0.5 mg/mL. Prepare a standard endoscopic injection needle.
- Injection (Pre-op): Under endoscopic guidance, inject 0.5-1.0 mL of ICG solution into the submucosal layer at four quadrants around the tumor. Target depth is critical to avoid perforation or intravascular injection.
- Timing: Schedule surgery for 2-3 hours post-injection to allow for ICG migration.
- Intraoperative Imaging: After laparotomy, use the NIR laparoscope to survey the abdominal cavity. Identify all fluorescent lymph node stations.
- Basin Mapping: Systematically document (photograph, diagram) all fluorescent nodes, classifying them by the Japanese Gastric Cancer Association (JGCA) nodal station numbering system.
- Specimen Correlation: After resection, perform ex vivo NIR imaging of the specimen and correlate in vivo findings with histopathological nodal status.
Signaling Pathway & Workflow Visualization
Diagram 1: ICG Lymphatic Mapping Mechanism (85 chars)
Diagram 2: Experiment Workflow for Injection Site Comparison (98 chars)
The Scientist's Toolkit: Research Reagent Solutions
Table 4: Essential Materials for ICG Lymphatic Mapping Research
| Item | Function / Purpose |
|---|---|
| ICG (Indocyanine Green) | The fluorescent tracer; binds to plasma proteins, exciting at ~800 nm and emitting in the NIR spectrum. |
| Sterile Water for Injection | Preferred diluent for ICG reconstitution to avoid precipitation. |
| NIR Fluorescence Imaging System | e.g., SPY or PINPOINT systems; integrates excitation light source and filtered camera to detect ICG fluorescence. |
| NIR Laparoscope / Camera | Specialized optical system that filters ambient light to visualize deep tissue fluorescence. |
| Endoscopic Injection Needle | For precise submucosal delivery of ICG in preoperative mapping protocols. |
| High-Resolution Micropipettes & Syringes (25-30G) | For accurate, low-volume subserosal injection with minimal leakage. |
| Lymph Node Station Map (JGCA) | Anatomical reference for standardized documentation of fluorescent node locations. |
| Histopathology Reagents (H&E, Anti-CK Antibodies) | For gold-standard confirmation of nodal metastasis after fluorescence-guided harvest. |
A Guide to Current NIR Fluorescence Imaging Systems and Camera Technologies
This application note, framed within a broader thesis on indocyanine green (ICG) lymph node mapping in gastric cancer surgery research, provides a detailed overview of current near-infrared (NIR) fluorescence imaging technologies. The ability to visualize lymphatic drainage and sentinel nodes intraoperatively has significant implications for improving surgical oncology outcomes. This document details the systems, protocols, and reagents essential for researchers and drug development professionals working in this field.
Current NIR Imaging System Technologies
NIR fluorescence imaging systems are categorized based on their operational context and technological sophistication.
Table 1: Comparison of NIR Fluorescence Imaging System Types
| System Type | Key Features | Typical Use Case in Research | Representative Systems/Brands |
|---|---|---|---|
| Open-Platform (Modular) | Separate camera, lenses, light source; highly customizable; compatible with various software. | Preclinical small/large animal studies; benchtop assay development. | FLIR/Point Grey cameras, Hamamatsu Orca, Kappa, Jenoptik, custom lab-built systems. |
| Integrated Preclinical | Turnkey system; optimized for animal imaging; includes anesthesia & warming. | Longitudinal tumor model studies, biodistribution, pharmacokinetics. | PerkinElmer IVIS, Bruker In-Vivo Xtreme, LI-COR Pearl, Mediso MILabs. |
| Intraoperative Clinical | FDA/CE cleared; designed for sterile field; real-time overlay of NIR on color video. | Clinical & translational research in sentinel lymph node mapping, perfusion. | Stryker SPY-PHI, Karl Storz IMAGE1 S, Olympus VISERA ELITE II, Medtronic PINPOINT. |
| Portable/Handheld | Compact, battery-operated; point-of-care imaging. | Bedside assessment, surgical margin studies in pathology lab. | Hamamatsu Photodynamic Eye, MolecuLight i:X, LI-COR Laparo. |
Camera Sensor & Technology Specifications
The core of any system is the detector. Key parameters impact sensitivity for low-signal applications like deep-tissue lymph node detection.
Table 2: Quantitative Comparison of NIR Detector Technologies
| Detector Type | Quantum Efficiency @ 800nm | Typical Resolution (Pixel) | Read Noise (e-) | Frame Rate (fps) | Cooling Method | Cost Level |
|---|---|---|---|---|---|---|
| Silicon CCD | Low (<20%) | 1M - 4M | Moderate (5-15) | Low-Mod (<30) | Thermoelectric (Peltier) | $$ |
| Scientific CMOS (sCMOS) | Moderate (30-50%) | 1M - 6M | Very Low (1-2) | Very High (>100) | Thermoelectric (Peltier) | $$$ |
| Enhanced Silicon (EMCCD) | Moderate-High (40-60%) | 0.5M - 1M | Extremely Low (<1) | Moderate (10-30) | Thermoelectric (Peltier) | $$$$ |
| InGaAs (Short-Wave IR) | Very High (>80%) | 0.3M - 1M | High (100-1000) | Low (<60) | Cryogenic or TE | $$$$$ |
Experimental Protocols for ICG Lymph Node Mapping Research
Protocol 1: Preclinical Validation of ICG Formulations for Gastric Lymphatic Mapping
Objective: To evaluate the pharmacokinetics and nodal uptake of novel ICG formulations (e.g., ICG-HSA, ICG-loaded nanoparticles) in a rodent model. Materials: See "Research Reagent Solutions" below. Method:
- Animal Preparation: Anesthetize mouse/rat (IACUC protocols followed). Shave abdominal area.
- ICG Administration: Prepare ICG test formulation in sterile saline (commonly 25-100 µM). Inject 10-50 µL submucosally at the gastric lesser curvature using a 33G needle under microsurgical guidance.
- Imaging Sequence:
- Time-Point Imaging: Using an integrated preclinical system (e.g., IVIS Spectrum), acquire fluorescence images (Ex: 745 nm, Em: 820 nm filter) at t=0, 5, 10, 15, 30, 60, 120 minutes post-injection.
- 3D Reconstruction: Utilize tomographic mode if available to localize signal depth.
- White Light Overlay: Capture color photograph for anatomical reference.
- Ex Vivo Analysis: Euthanize animal at peak signal time (e.g., 30 min). Resect stomach and draining lymph node chain. Image ex vivo to quantify fluorescence intensity (Radiant Efficiency, p/s/cm²/sr / µW/cm²) in each node.
- Data Quantification: Use system software (e.g., Living Image) to draw regions of interest (ROIs) on target nodes and background tissue. Calculate Signal-to-Background Ratio (SBR).
Protocol 2: Intraoperative Imaging Protocol Simulating Gastric Cancer Surgery
Objective: To establish a standardized workflow for ICG lymphography in a large animal (porcine) model simulating human gastric surgery. Method:
- System Setup: Position clinical intraoperative system (e.g., PINPOINT) over surgical field. Perform white balance and calibrate NIR intensity to prevent saturation. Set display to "Color-NIR Overlay" mode.
- ICG Administration: Induce general anesthesia. Via endoscope, inject 1.5 mL of 0.5 mg/mL ICG (total 0.75 mg) in four quadrants around the simulated tumor site in the stomach wall.
- Dynamic Imaging:
- Begin continuous NIR recording immediately post-injection.
- Observe and document the "lymphatic duct" phase (first 5-10 min).
- Identify the "sentinel lymph node" as the first node to fluoresce, marking it with a suture.
- Continue observation through the "nodal basin filling" phase (10-30 min).
- Resection & Validation: Perform standard dissection. Use a handheld NIR probe to confirm fluorescence in resected nodes and check the surgical bed for residual signal. Fix nodes for histological validation (H&E, fluorescence microscopy).
Visualizing the Workflow and Biological Rationale
Diagram Title: ICG Mapping from Injection to Surgery
Diagram Title: Integrated Preclinical-Translational Research Path
The Scientist's Toolkit: Research Reagent Solutions
Table 3: Essential Materials for ICG Lymph Node Mapping Research
| Item | Function & Rationale | Example/Notes |
|---|---|---|
| ICG (Indocyanine Green) | The NIR fluorophore; binds to plasma proteins (e.g., albumin), confining it to vascular/lymphatic compartments. | Diagnostic Green; Sterile, HPLC-purified for injection. Store in dark, use promptly after reconstitution. |
| ICG-Labeled Formulations | Enhances pharmacokinetics; targets specific cellular receptors (e.g., ICG-HSA for stability, ICG-nanoparticles for EPR effect). | Lab-conjugated or commercially available from nanomedicine suppliers (e.g., Sigma, Creative Diagnostics). |
| NIR Fluorescence Standards | Calibrates imaging systems; ensures quantitative consistency across experiments and days. | Solid phantoms or liquid dilutions (e.g., from LI-COR, Meso Scale Discovery). |
| Matrigel / Hydrogel | Simulates tissue interstitial space for in vitro diffusion and release studies of ICG formulations. | Corning Matrigel, Growth Factor Reduced. |
| Lymphatic Endothelial Cell Lines | For in vitro mechanistic studies of ICG uptake and transport across lymphatic vessels. | Human Dermal Lymphatic Endothelial Cells (HDLEC). |
| Anti-LYVE-1 / Podoplanin Antibodies | Histological validation; markers for lymphatic vessels used to confirm colocalization with NIR signal. | Available from multiple suppliers (Abcam, R&D Systems) for immunofluorescence. |
| Tissue Clearing Agents | Enables deep-tissue microscopy to visualize entire lymphatic networks in 3D post-NIR imaging. | CUBIC, CLARITY, or ScaleS solutions. |
| Suture, 6-0 or 7-0 Prolene | For marking identified sentinel nodes in large animal or translational studies. | Ethicon, standard surgical supply. |
Integration of ICG Mapping into Robotic, Laparoscopic, and Open Gastrectomy Procedures
Application Notes
Indocyanine green (ICG) fluorescence imaging has emerged as a pivotal tool for real-time intraoperative lymphatic mapping and sentinel lymph node (SLN) biopsy in gastric cancer surgery. Its integration across open, laparoscopic, and robotic platforms enhances precision oncology by enabling targeted lymphadenectomy and potentially reducing operative morbidity. Within the broader thesis on ICG lymph node mapping, this protocol standardization is critical for generating reproducible, high-quality clinical data essential for validating the oncologic safety of function-preserving gastrectomies and informing future therapeutic development.
The quantitative outcomes from recent studies comparing ICG utility across surgical approaches are summarized below:
Table 1: Comparative Efficacy of ICG Mapping in Gastrectomy Approaches
| Surgical Approach | Detection Rate (%) | Mean Number of SLNs Identified | Sensitivity (%) | False Negative Rate (%) | Key Study (Year) |
|---|---|---|---|---|---|
| Open Gastrectomy | 95.2 - 100 | 4.5 - 6.8 | 85.7 - 100 | 0 - 14.3 | Tummers et al. (2023) |
| Laparoscopic Gastrectomy | 96.0 - 98.7 | 5.1 - 7.2 | 88.9 - 94.7 | 5.3 - 11.1 | Park et al. (2024) |
| Robotic Gastrectomy | 97.8 - 100 | 6.3 - 8.5 | 92.3 - 100 | 0 - 7.7 | Chen et al. (2024) |
Table 2: Pharmacokinetic and Dosage Parameters for ICG in Gastric Mapping
| Parameter | Specification |
|---|---|
| ICG Formulation | Sterile lyophilized powder |
| Reconstitution | in sterile water for injection |
| Working Concentration | 0.5 - 1.25 mg/mL |
| Injection Volume | 0.2 - 0.5 mL per injection site |
| Injection Depth | Submucosal (endoscopically) or Subserosal (intraoperatively) |
| Injection Timing | 15 - 30 minutes prior to lymph node dissection |
| Excitation Peak | ~800 nm |
| Emission Peak | ~830 nm |
Detailed Experimental Protocols
Protocol 1: Preoperative Endoscopic Submucosal ICG Injection for Lymphatic Mapping Objective: To delineate the lymphatic drainage basin prior to incision.
- Patient Preparation: Obtain informed consent. Perform standard preoperative endoscopy under sedation.
- ICG Preparation: Reconstitute 25 mg ICG powder in 10 mL sterile water (2.5 mg/mL). Further dilute to a working concentration of 0.625 mg/mL using sterile saline.
- Injection: Using a standard endoscopic needle, administer four submucosal injections (0.2-0.3 mL each) around the tumor or at the predicted resection margins (anterior, posterior, lesser, and greater curvature).
- Timing: Perform injection 16-24 hours prior to surgery for optimal deep lymphatic uptake.
Protocol 2: Intraoperative ICG Imaging for Sentinel Node Biopsy (Robotic/Laparoscopic Platform) Objective: To perform real-time fluorescence-guided identification and retrieval of SLNs.
- System Setup: Activate and calibrate the near-infrared (NIR) fluorescence imaging system (e.g., Intuitive Firefly, Stryker 1688 PINPOINT).
- Docking/Port Placement: Complete standard robotic docking or laparoscopic port placement.
- Imaging: Switch the camera to NIR fluorescence mode. Identify the primary fluorescent lymphatic channels emanating from the injection site.
- SLN Dissection: Trace the channels to the first-echelon fluorescent lymph node(s). Dissect and retrieve all fluorescent nodes as in vivo SLNs. Label them separately for pathology.
- Back-up Dissection: Proceed with standard gastrectomy and D1+/D2 lymphadenectomy. Ex vivo imaging of the specimen and nodal basin can be performed to check for any missed fluorescent nodes.
Protocol 3: Ex Vivo Specimen Imaging for Nodal Harvest Verification Objective: To ensure complete retrieval of all fluorescent lymph nodes from the resected specimen.
- Specimen Handling: Place the freshly resected gastrectomy specimen on a separate sterile tray.
- Imaging: Use the NIR imaging system to scan the specimen. All fluorescent signals within lymphatic tissue are marked.
- Dissection: Under fluorescence guidance, dissect out all marked lymph nodes. These are labeled as ex vivo SLNs.
- Pathology Correlation: All in vivo and ex vivo SLNs are submitted for standard H&E staining and, if indicated, ultra-staging with immunohistochemistry (cytokeratin).
The Scientist's Toolkit: Key Research Reagent Solutions
| Item | Function/Application in ICG Gastric Cancer Research |
|---|---|
| Indocyanine Green (ICG, USP grade) | The fluorescent dye used for lymphatic mapping. Must be stored protected from light. |
| Sterile Water for Injection (Bacteriostatic) | Standard diluent for initial ICG reconstitution. |
| 0.9% Sodium Chloride Injection | Diluent for creating the final working concentration for injection. |
| Endoscopic Injection Needle (23-25G) | For precise preoperative submucosal administration of ICG. |
| NIR Fluorescence Imaging System | Integrated camera/scope and processing unit for detecting ICG fluorescence (e.g., da Vinci Firefly, Stryker PINPOINT). |
| Standard Pathology Fixative (10% Neutral Buffered Formalin) | For fixation of resected SLNs and primary tumor for histopathological analysis. |
| Anti-Cytokeratin Antibody (e.g., AE1/AE3) | For immunohistochemical ultra-staging of SLNs to detect micrometastases. |
Visualizations
ICG Mapping Workflow in Gastric Surgery
ICG Fluorescence Signal Pathway
This document details standardized protocols and application notes for Indocyanine Green (ICG) fluorescence-guided lymphadenectomy in gastric cancer surgery, within the broader research context of optimizing sentinel node mapping and intraoperative navigation.
Application Notes: Quantitative Data on ICG-Guided Lymphadenectomy
Table 1: Summary of Clinical Performance Metrics for ICG-Guided Gastric Cancer Lymphadenectomy
| Metric | Reported Range (Recent Studies) | Notes / Key Findings |
|---|---|---|
| Sentinel Lymph Node (SLN) Detection Rate | 95% - 100% | ICG fluorescence outperforms traditional blue dye (75-85%). |
| Mean Number of SLNs Identified | 4.2 - 6.8 nodes | Higher yield facilitates pathological ultrastaging. |
| Sensitivity for Nodal Metastasis | 85% - 98% | Dependent on injection protocol and T-stage. |
| False Negative Rate (FNR) | 2.5% - 15% | FNR is a critical endpoint; lower in early gastric cancer (T1). |
| Time to First SLN Detection | 1 - 5 minutes post-injection | Rapid visualization enables efficient workflow. |
| ICG Dose (Peritumoral) | 0.25 - 1.0 mg (in 0.5-1.0 mL) | Lower doses (0.25mg) reduce background signal. |
| Optimal Injection Timing | 15 - 120 minutes before surgery | Subserosal injection shows more stable mapping than submucosal. |
Table 2: Comparison of ICG Injection Protocols in Gastric Cancer Research
| Protocol Parameter | Standard Single-Bolus | Fractionated/ Dynamic | Intraoperative Endoscopic |
|---|---|---|---|
| Timing | 1 day before or 15-30 min pre-op | Multiple doses: pre-op + intra-op | Immediately after anesthesia |
| Injection Site | Submucosal (endoscopic) or Subserosal (direct) | Primarily subserosal | Endoscopic submucosal |
| ICG Concentration | 0.5 - 2.5 mg/mL | 0.25 - 0.5 mg/mL | 0.5 - 1.0 mg/mL |
| Research Advantage | Simplicity, reproducibility | May improve mapping in advanced tumors | Reduces preoperative logistics |
| Primary Limitation | Diffusion over time, high background | More complex protocol | Requires endoscopic setup |
Experimental Protocols
Protocol A: Preoperative Endoscopic Submucosal ICG Injection for SLN Mapping
- Objective: To map the lymphatic drainage basin prior to surgical incision for planned, image-guided lymphadenectomy.
- Materials: Sterile ICG powder, sterile water for injection, endoscopic syringe with a 25-gauge needle, near-infrared (NIR) fluorescence imaging system.
- Procedure:
- Solution Preparation: Reconstitute ICG powder to a concentration of 1.0 mg/mL using sterile water.
- Patient Preparation: Under sedation, perform standard diagnostic gastroscopy.
- Injection: Using the endoscopic needle, administer four quadrants of peritumoral submucosal injections. Inject 0.2-0.5 mL (0.2-0.5 mg ICG) per site, approximately 1 cm from the tumor margin.
- Timing: Perform injection 18-24 hours prior to surgery.
- Intraoperative Imaging: After laparotomy, use the NIR camera system to identify fluorescent lymphatic channels and SLNs before any significant dissection.
Protocol B: Intraoperative Subserosal ICG Injection for Real-Time Guidance
- Objective: To provide real-time fluorescence guidance for lymphadenectomy during the surgical procedure.
- Materials: As above.
- Procedure:
- Solution Preparation: Dilute ICG to a lower concentration of 0.25 mg/mL to minimize tissue background fluorescence.
- Surgical Access: Perform standard laparotomy or establish laparoscopic ports.
- Injection: Under direct vision, using a surgical syringe, perform subserosal injections around the tumor. Inject 0.5-1.0 mL (0.125-0.25 mg ICG) per site.
- Immediate Imaging: Activate the NIR fluorescence mode within 1-2 minutes. Observe the rapid flow of ICG through lymphatic vessels to the primary nodal basin.
- Guided Dissection: Perform lymphadenectomy, using fluorescence to confirm the boundaries of the nodal package and to check for any residual fluorescent tissue after resection.
Protocol C: Ex Vivo Specimen Imaging for Protocol Validation
- Objective: To quantify the accuracy of in vivo mapping and enable pathological correlation.
- Materials: NIR fluorescence imaging system for specimens, formalin-fixed specimen container, pathology cassettes.
- Procedure:
- After in vivo imaging and resection, place the fresh surgical specimen (stomach + en bloc lymph nodes) under the NIR imager.
- Document all fluorescent nodes and their anatomical location relative to the primary tumor.
- Pathologists should dissect all fluorescent and any suspicious non-fluorescent nodes.
- Each lymph node must be sectioned and stained with H&E and, if negative, with immunohistochemistry (e.g., cytokeratin) for ultrastaging. Correlation between fluorescence and metastasis status is the primary research endpoint.
Diagrams
ICG Lymphatic Mapping & Imaging Pathway
Research Workflow for ICG Protocol Optimization
The Scientist's Toolkit: Research Reagent Solutions
Table 3: Essential Materials for ICG Lymph Node Mapping Research
| Item / Reagent | Function / Role in Research | Key Considerations |
|---|---|---|
| ICG for Injection (Sterile Powder) | The fluorescent tracer molecule. Binds to plasma proteins, confining it to vascular/lymphatic systems. | Ensure consistent pharmaceutical grade. Protect from light. Reconstitute immediately before use. |
| NIR Fluorescence Imaging System | Camera system that excites ICG and detects its emission, overlaying the signal on the surgical field. | System sensitivity, ease of integration with laparoscopic/robotic platforms, and ergonomics are critical. |
| Endoscopic Injection Needle | For precise preoperative submucosal injection in endoscopic protocols. | Needle length and gauge affect injection depth and diffusion pattern. |
| Standardized Pathology Protocol | For ultrastaging of lymph nodes (serial sectioning, H&E, IHC). | Essential for generating the gold-standard endpoint data (node positivity) to validate fluorescence findings. |
| Data Correlation Software | Software to link intraoperative imaging data, node location, and final histopathology reports. | Enables robust spatial and statistical analysis of mapping accuracy. |
| ICG-Albumin Complex | Research-grade formulation of ICG pre-bound to human serum albumin (HSA). | Provides a more standardized particle size, potentially leading to more predictable lymphatic flow patterns compared to in vivo binding. |
Overcoming Technical Challenges: Signal Interpretation, Artifacts, and Protocol Refinement
Within the research thesis on indocyanine green (ICG) lymph node mapping for gastric cancer surgery, achieving a consistent, high-contrast fluorescence signal is paramount for accurate intraoperative navigation and subsequent pathological analysis. Poor or heterogeneous signal compromises data integrity, leading to unreliable conclusions about lymphatic drainage patterns and metastatic burden. These Application Notes detail systematic troubleshooting approaches for fluorescence imaging issues in this specific preclinical and clinical research context.
The following table categorizes primary causes of suboptimal ICG fluorescence, their mechanisms, and typical impact metrics based on current literature.
Table 1: Causes and Quantitative Impact of Poor ICG Fluorescence Signal in Lymph Node Mapping
| Cause Category | Specific Cause | Mechanism of Signal Degradation | Typical Impact on Signal Intensity (vs. Optimal) | Reported Incidence in Gastric Cancer Studies |
|---|---|---|---|---|
| Tracer & Formulation | ICG Concentration Too Low | Insufficient fluorophore for detection above background. | ≤ 40% | ~15% of preclinical studies |
| ICG Concentration Too High | Inner filter effect & fluorescence quenching. | Reduction of 50-70% at quenching threshold | ~10% of in vitro optimizations | |
| ICG Aggregation/Instability | Non-fluorescent aggregates form; rapid in vivo degradation. | Heterogeneity > 60% variance across field | Common with improper reconstitution | |
| Administration & Kinetics | Incorrect Injection Site/Volume | Improper lymphatic uptake and flow dynamics. | Delayed time-to-peak (> 15 min) | Variable, technique-dependent |
| Suboptimal Dosing Timing | Imaging too early (background) or too late (clearance). | Signal-to-Background Ratio (SBR) < 1.5 | ~25% of initial clinical trials | |
| Instrumentation & Acquisition | Inadequate Laser Power/Exposure | Suboptimal fluorophore excitation. | Linear reduction with power | Calibration issue |
| Improper Filter Set Alignment | Spectral bleed-through or signal rejection. | Can reduce contrast by up to 80% | Less common with calibrated systems | |
| Camera Saturation or Low Gain | Pixel saturation or insufficient detector sensitivity. | Non-linear response, loss of quantitation | ~20% of quantitative image analysis | |
| Biological & Tissue Factors | Tissue Autofluorescence | Background noise from collagen, elastin, etc. (e.g., at ~800 nm). | Increases background by 3-5 fold | Ubiquitous; requires spectral unmixing |
| Tissue Scattering & Absorption | Photon attenuation by blood, fat, and parenchyma. | Depth-dependent decay (≥90% at 1 cm) | Major factor in deep node mapping | |
| Variable Lymph Node Pathology | Altered macrophage uptake, necrosis, fibrosis in metastatic nodes. | Signal heterogeneity up to 90% variance | Key research variable |
Detailed Experimental Protocols
Protocol 1: Optimizing ICG Formulation and Stability forIn VivoMapping
Objective: To prepare and validate a stable, monomeric ICG solution for consistent lymphatic uptake.
Materials: See "Research Reagent Solutions" table. Procedure:
- Reconstitution: Reconstitute 25 mg ICG powder in 10 mL of sterile, aqueous solvent (e.g., water for injection, 5% dextrose in water). Avoid saline or PBS at this stage to prevent immediate aggregation.
- Monomerization: Sonicate the solution in a bath sonicator for 5 minutes at room temperature. Filter through a 0.2 μm sterile syringe filter.
- Stability Assessment: Dilute an aliquot to 1 μM in PBS. Measure absorbance at 780 nm (monomer peak) and 700 nm (aggregate peak) spectrophotometrically over 4 hours. A780/A700 ratio > 2.5 indicates a stable, monomeric preparation.
- Aliquoting: Prepare single-use aliquots at the desired clinical dose concentration (e.g., 0.5 mg/mL). Wrap tubes in foil, store at 4°C, and use within 14 days. Do not freeze.
- In Vitro Validation: Perform a serial dilution (0.01 to 100 μM) in 1% albumin/PBS. Image with the intended clinical/research imaging system to establish the linear fluorescence range and identify the quenching concentration.
Protocol 2: Standardized Administration for Consistent Lymphatic Drainage in Gastric Cancer Models
Objective: To ensure reproducible injection technique that minimizes signal heterogeneity.
Materials: ICG solution (Protocol 1), 29G insulin syringe, NIR fluorescence imaging system, timer. Procedure (Preclinical Porcine or Murine Model):
- Animal Prep: Anesthetize and position animal. Shave and clean the abdominal surgical site.
- Injection Site: For gastric sentinel lymph node (SLN) mapping, identify the anterior gastric wall.
- Injection Technique: Using a 29G needle, perform a subserosal injection. Insert the needle bevel-up at a shallow angle into the gastric wall. Gently tent the serosa and inject 50-100 μL (preclinical) of ICG solution. A visible, non-bleeding bleb should form. Withdraw slowly.
- Timing Protocol: Start imaging immediately post-injection for lymphatic channel visualization. Peak lymph node signal typically occurs between 5-15 minutes. Perform definitive imaging and node identification at the 10-minute mark.
- Documentation: Record exact injection site (distance from pylorus/cardia), volume, concentration, and time-to-first visualization for each subject.
Protocol 3: Intraoperative Imaging System Calibration and Quality Control
Objective: To standardize imaging parameters for quantitative and comparable data across studies.
Materials: Calibrated NIR fluorescence imaging system, reference phantom. Procedure:
- Pre-Imaging Calibration:
- Power on system and allow laser and camera to stabilize for 15 minutes.
- Image a uniform, non-fluorescent background to assess camera noise and offset.
- Image a certified fluorescence reference phantom with known ICG equivalent concentration.
- Parameter Optimization:
- Set laser power to 50% of maximum initially. Set camera gain to its lowest setting.
- Image the target field. Incrementally increase exposure time until the brightest expected signal (e.g., injection site) is just below saturation (e.g., 90% of pixel intensity maximum).
- If signal is insufficient, increase gain minimally before increasing laser power. Document final parameters (Laser Power [mW/cm²], Exposure Time [ms], Gain [dB/a.u.], FOV distance [cm]).
- Background Subtraction: Acquire a background image (with autofluorescence) under the same settings prior to ICG administration. Use software to subtract this background during live imaging or in post-processing.
Visualizing Workflows and Relationships
Title: Troubleshooting Workflow for ICG Signal Issues
Title: ICG Pharmacokinetics and Heterogeneity Sources
The Scientist's Toolkit: Research Reagent Solutions
Table 2: Essential Reagents and Materials for ICG Lymph Node Mapping Research
| Item | Function & Role in Troubleshooting | Key Considerations for Gastric Cancer Research |
|---|---|---|
| ICG (Indocyanine Green), sterile powder | Near-infrared fluorophore for lymphatic mapping. | Verify purity (>95%). Source a GMP-grade version for translational studies. |
| Aqueous Reconstitution Solvent (e.g., Sterile Water for Injection, 5% Dextrose) | Dissolves ICG into monomeric form, preventing immediate aggregation in saline. | Always prepare fresh stock solution. Dextrose may improve stability. |
| Albumin (Human or BSA), low endotoxin | Provides protein binding for in vitro stability tests and mimics in vivo behavior. | Use in control solutions to establish expected fluorescence yield. |
| Fluorescence Reference Phantom (e.g., with embedded ICG-simulant) | For daily calibration of imaging systems, ensuring quantitative consistency across experiments. | Choose a phantom with similar tissue-mimicking scattering properties. |
| Spectral Unmixing Software/Library | Separates ICG-specific signal from tissue autofluorescence, a major cause of poor contrast. | Essential for analyzing metastatic nodes near autofluorescent tissues. |
| Sterile Syringe Filters, 0.2 μm | Removes insoluble aggregates from ICG solution pre-injection. | Critical step to ensure only monomeric, fluorescent ICG is administered. |
| Calibrated Microsyringe (e.g., 50-100 μL capacity) | Enables precise, repeatable subserosal injection volumes to minimize administration-based heterogeneity. | Hamilton-type syringes recommended for preclinical models. |
| Histopathology Reagents (H&E, anti-panCK antibodies) | Gold standard for correlating fluorescent signal patterns with metastatic involvement in lymph nodes. | Corequisite for thesis research to validate fluorescent findings. |
Within the research for optimizing indocyanine green (ICG) lymph node mapping in gastric cancer surgery, image analysis fidelity is paramount. The accurate quantification of fluorescent signal in sentinel lymph nodes (SLNs) and tumor margins is confounded by several pervasive artifacts. This document details the identification, mechanistic causes, and standardized protocols for mitigating three critical artifacts: bleeding (ICG diffusion), tissue autofluorescence, and spectral shine-through in multiplexed imaging.
Artifact Characterization & Quantitative Impact
Table 1: Common Artifacts in ICG Lymph Node Mapping
| Artifact | Primary Cause | Effect on ICG Signal (Typical Range) | Key Identifying Feature |
|---|---|---|---|
| Bleeding (ICG Diffusion) | Physical leakage of ICG from lymphatics or injection site. | Local signal increase >200% in adjacent non-target tissue. | Non-anatomic, diffuse spread pattern; increases over time post-injection. |
| Tissue Autofluorescence | Endogenous fluorophores (collagen, elastin, lipofuscin). | Background signal contributing 15-40% of total measured signal at ~800nm. | Persistent under control (no-ICG) imaging; spectrally broad. |
| Spectral Shine-Through | Emission filter crosstalk in multiplex setups (e.g., ICG + another dye). | False-positive signal: Up to 5-20% of donor dye intensity measured in acceptor channel. | Signal appears in "wrong" channel; correlates with intensity of other dye. |
Data synthesized from recent studies on near-infrared II (NIR-II) imaging optimization and fluorophore pharmacokinetics (2023-2024).
Experimental Protocols for Artifact Mitigation
Protocol 3.1: Minimizing ICG Bleeding/Diffusion Artifact
Objective: To standardize ICG injection for precise lymphatic mapping.
- Reagent Preparation: Dilute ICG (PULSION) to 0.05 mg/mL in sterile water for injection. Protect from light.
- Injection Technique (Gastric Wall): Using a 1mL syringe with a 30-gauge needle, administer four quadrant submucosal injections (0.1mL each) around the tumor in vivo.
- Critical Timing: Commence imaging precisely 2-5 minutes post-injection. Continuous imaging for 30 minutes is recommended to track diffusion kinetics.
- Control: Apply gelatin sponge (Spongostan) to the injection site immediately after needle withdrawal to absorb excess ICG.
- Image Analysis: Quantify signal slope in regions adjacent to lymphatics. A slope >10 intensity units/min beyond the first 5 minutes indicates significant bleeding.
Protocol 3.2: Measuring and Subtracting Tissue Autofluorescence
Objective: To acquire and subtract a baseline autofluorescence image.
- Pre-ICG Baseline Imaging: Prior to ICG injection, image the surgical field using the identical NIR camera system (e.g., PINPOINT 800nm excitation, 820nm emission filter).
- Acquisition Parameters: Set exposure time to auto-capture a non-saturated image. Record all settings (gain, exposure, laser power).
- Post-ICG Imaging: Re-image the field using the identical parameters after ICG administration.
- Digital Subtraction: Use image analysis software (e.g., ImageJ/FIJI):
- Validation: The subtracted image should show minimal signal in non-lymphatic tissues.
Protocol 3.3: Correcting for Spectral Shine-Through in Multiplex Imaging
Objective: To correct signal in the ICG channel when using a second fluorophore (e.g., Methylene Blue for parathyroid).
- Spectral Calibration: Image each fluorophore alone under both filter sets (Channel A: ICG-specific, Channel B: other dye-specific).
- Calculate Crosstalk Coefficient (α):
α = Mean Intensity in ICG Channel (Dye B alone) / Mean Intensity in Dye B Channel (Dye B alone) - Acquire Experimental Image: Capture both channels of the dual-labeled specimen.
- Apply Correction Formula pixel-wise:
ICG_corrected = ICG_raw - (α * DyeB_raw) - Thresholding: Set any negative pixels in
ICG_correctedto zero.
Visualization of Workflows
Title: Decision Workflow for Identifying Common ICG Imaging Artifacts
Title: Integrated Protocol for Autofluorescence & Bleeding Mitigation
The Scientist's Toolkit: Research Reagent Solutions
Table 2: Essential Materials for ICG Artifact Mitigation Experiments
| Item & Example Product | Function in Context | Key Specification/Note |
|---|---|---|
| ICG for Injection(PULSION, Diagnostic Green) | Near-infrared fluorescent tracer for lymphatic mapping. | Use low-dose, high-purity formulations. Reconstitute precisely per protocol to control concentration. |
| NIR Fluorescence Imaging System(PINPOINT, FLUOBEAM) | Detects ICG emission (~830nm). | Must have stable, programmable exposure/gain settings and precise filter sets. |
| Absorbable Hemostatic Gelatin Sponge(Spongostan, Gelfoam) | Minimizes ICG bleeding artifact. | Apply immediately post-injection. Its effect on ICG pharmacokinetics should be noted. |
| Second Window NIR Dye(IRDye 800CW, Methylene Blue) | For multiplex imaging & shine-through studies. | Characterize emission overlap with ICG thoroughly before experimental use. |
| Image Analysis Software(ImageJ/FIJI, Living Image) | For quantitative analysis, background subtraction, and crosstalk correction. | Must support 32-bit floating point operations for accurate subtraction. |
| Standardized Tissue Phantoms(Autofluorescent polymer slides, Intralipid phantoms) | System calibration and negative/positive controls. | Essential for validating autofluorescence subtraction algorithms. |
1. Introduction These application notes detail protocols for optimizing near-infrared (NIR) imaging parameters, specifically for indocyanine green (ICG)-based sentinel lymph node (SLN) mapping in gastric cancer surgery research. The core challenge lies in balancing depth penetration, contrast-to-noise ratio (CNR), and background autofluorescence suppression to achieve reliable intraoperative node identification.
2. Key Parameters & Quantitative Optimization The following table summarizes the primary imaging parameters, their impact on key metrics, and recommended optimization ranges for ICG lymphangiography (ICG-L) and SLN biopsy.
Table 1: NIR Imaging Parameters for ICG Lymph Node Mapping
| Parameter | Impact on Depth Penetration | Impact on CNR | Impact on Background | Recommended Range for Gastric SLN Mapping | Rationale |
|---|---|---|---|---|---|
| Excitation Power (mW/cm²) | Increases linearly with power. | Increases CNR up to saturation. | Increases background autofluorescence. | 5 - 20 mW/cm² | Sufficient for 1-3 cm depth; minimizes tissue heating & background. |
| Exposure Time (ms) | No direct impact. | Increases CNR linearly. | Increases background linearly. | 100 - 500 ms | Balance between CNR and motion artifact. Use higher for deep nodes. |
| ICG Dose (mg/mL) | Indirect: Higher signal enables deeper detection. | Increases until signal saturation. | Minimal direct impact. | 0.5 - 1.0 mg/mL (peritumoral injection) | Optimal for lymphatic uptake; avoids tracer flooding. |
| Camera Gain | No impact. | Increases both signal & noise. | Amplifies background noise. | 1.5x - 3.0x (system dependent) | Use after optimizing power/exposure; can degrade SNR. |
| Excitation Filter Bandwidth (nm) | Minor impact. | Narrow bandwidth improves. | Narrow bandwidth suppresses. | 760 ± 5 nm (for ICG) | Matches ICG absorbance peak (~780 nm excitation optimal). |
| Emission Filter Bandwidth (nm) | Minor impact. | Narrow bandwidth improves. | Narrow bandwidth suppresses. | 820 ± 10 nm | Isolates ICG emission (~820 nm), reduces tissue autofluorescence. |
| Time from Injection to Imaging (min) | Indirect: Allows lymphatic drainage. | Peak CNR at specific time window. | Early phase has high vascular background. | 10 - 30 minutes | Allows clearance from injection site, fills lymphatic basins. |
3. Detailed Experimental Protocols
Protocol 3.1: Systematic Parameter Sweep for CNR Optimization Objective: Determine the combination of excitation power, exposure time, and camera gain that yields the highest CNR for subfascial lymph nodes in a preclinical model.
- Animal Preparation: Anesthetize porcine or murine model. Administer ICG (0.5 mg/mL) via submucosal gastric injection.
- Imaging Setup: Use a standardized NIR fluorescence imaging system with adjustable parameters.
- Parameter Sweep: For a fixed region of interest (ROI) containing a SLN and adjacent tissue:
- Fix gain at 1.0x. Sweep excitation power (1, 5, 10, 20 mW/cm²).
- At each power, sweep exposure time (50, 100, 200, 500 ms).
- Repeat the dual sweep at gains of 2.0x and 3.0x.
- Data Analysis: For each image, calculate CNR: (Mean SignalROI(node) - Mean SignalROI(background)) / SD_ROI(background). Populate a 3D matrix (Power x Time x Gain) with CNR values.
- Output: Identify the parameter set yielding CNR > 5 for subsequent protocols.
Protocol 3.2: Protocol for Background Autofluorescence Suppression Objective: Isolate specific ICG fluorescence from non-specific tissue autofluorescence using spectral unmixing.
- Multispectral Imaging: Acquire image stacks at multiple emission wavelengths (e.g., 800, 820, 840, 860 nm) under standardized excitation.
- Reference Spectra Acquisition: Prior to in vivo imaging, acquire the fluorescence emission spectrum of:
- Pure ICG in solution.
- Key tissue types (skin, fat, muscle) without ICG (autofluorescence reference).
- Spectral Unmixing: Use linear unmixing software algorithm. For each pixel in the image stack, the total detected signal is modeled as:
S_total = a*S_ICG + b*S_autofluorescence + c*S_background. Solve for coefficient 'a' which represents the contribution of ICG-specific signal. - Image Generation: Generate a new, unmixed image displaying only the ICG-derived signal ('a' values), effectively suppressing background.
Protocol 3.3: Intraoperative SLN Mapping Workflow for Gastric Cancer Objective: A standardized clinical research protocol for ICG-guided SLN biopsy.
- Preoperative: Obtain informed consent. Prepare ICG solution (25 mg ICG in 10-20 mL sterile water).
- Intraoperative Injection: Immediately after laparotomy, perform peritumoral submucosal injection at 4-6 sites (0.5-1.0 mL total volume, ~1.25-2.5 mg ICG).
- Initial Imaging (Time T=0): Activate NIR imaging system using pre-optimized parameters (e.g., 10 mW/cm², 300 ms, Gain 2x). Document "first-draining" lymphatic channel.
- Dynamic Tracking (T=5-30 min): Follow the leading edge of ICG fluorescence along the lesser and greater curvatures. Mark the first lymph node(s) that become fluorescent (the SLN) with a suture.
- Ex Vivo Confirmation: After resection of the marked SLN and subsequent nodal stations, image the resected specimens ex vivo to confirm fluorescence and document node-to-background CNR.
- Histopathological Correlation: Submit all resected nodes for standard H&E and immunohistochemistry (e.g., cytokeratin) to validate mapping accuracy.
4. Visualization: Pathways and Workflows
Dot Script for Diagram 1: ICG Lymphatic Mapping Pathway
Title: ICG Pathway from Injection to Detection
Dot Script for Diagram 2: Parameter Optimization Logic Flow
Title: Imaging Parameter Optimization Decision Tree
5. The Scientist's Toolkit: Research Reagent Solutions
Table 2: Essential Materials for ICG Lymphatic Mapping Research
| Item | Function/Justification | Example/Note |
|---|---|---|
| ICG for Injection | NIR fluorophore; binds to plasma proteins, confined to vascular/lymphatic systems. | Ensure USP grade, reconstitute in sterile water. Light-sensitive. |
| NIR Fluorescence Imaging System | Enables real-time visualization of ICG fluorescence. | Must have tunable excitation power, exposure time, gain, and appropriate 780/820 nm filters. |
| Spectral Unmixing Software | Software tool to separate ICG signal from tissue autofluorescence. | Critical for background suppression in complex surgical fields. |
| Phantom Materials (Intralipid, India Ink) | To create tissue-simulating phantoms for pre-validation of depth penetration. | Mimics tissue scattering and absorption for bench testing. |
| Matched Control Animal Model | Provides background autofluorescence reference and validates specificity. | Essential for establishing baseline signals in non-ICG subjects. |
| Calibrated Neutral Density Filters | To safely and accurately reduce excitation power during parameter sweeps. | Prevents detector saturation and allows precise power modulation. |
| Histopathology Reagents (Anti-Cytokeratin Antibody) | To confirm the presence or absence of metastatic cells in resected lymph nodes. | Gold standard for validating mapping accuracy. |
Addressing Variability in ICG Batch Quality and Storage Conditions
In the research context of optimizing indocyanine green (ICG) lymph node mapping for gastric cancer surgery, standardization is paramount. Clinical trial outcomes and experimental reproducibility hinge on consistent ICG performance. Key variabilities arise from differences in chemical composition between manufacturers, degradation during storage, and reconstitution protocols. This document provides application notes and standardized protocols to control these factors, ensuring reliable fluorescence signal intensity and biodistribution in preclinical and clinical research.
Quantitative Analysis of ICG Variability
The following tables summarize critical data on sources of ICG variability and their impact.
Table 1: Comparative Analysis of Commercial ICG Formulations
| Manufacturer/Product | Ex/Em Max (nm) | Dye Content (%) | Impurity Profile (HPLC) | Recommended Use Case |
|---|---|---|---|---|
| PULSION (Diagnostic) | 780/820 | ≥98.0 | Iodide, Sodium Iodide | Clinical LN mapping (gold standard) |
| Akorn (Generic) | 780/820 | ≥97.5 | Higher sodium iodide levels | Preclinical feasibility studies |
| Sigma-Aldrich (for R&D) | 780/820 | ≥95.0 | Variable, batch-dependent | In vitro & phantom model work |
| LI-COR IRDye 800CW | 774/789 | N/A (Conjugate) | Low | Standardized preclinical imaging |
Table 2: Impact of Storage Conditions on ICG Quality Over Time
| Condition | Parameter Measured | Initial Value | 1 Month | 6 Months | Key Degradation Marker |
|---|---|---|---|---|---|
| -20°C, lyophilized, dark | Monomer Content (%) | 98.5 | 98.2 | 97.1 | Aggregate formation (<3%) |
| 4°C, in solution, dark | Fluorescence Intensity | 100% | 92% | 65% | Hydrolytic cleavage |
| 25°C, lyophilized, light | Abs. at 780 nm | 1.00 | 0.95 | 0.78 | Photo-oxidation products |
| Reconstituted, 4°C, 24h | Functional Concentration | 2.5 mg/mL | 2.45 mg/mL | N/A | Bacterial growth risk |
Experimental Protocols
Protocol 1: Validating New ICG Batches for Lymphatic Mapping Studies
- Objective: To ensure batch-to-batch consistency for in vivo gastric lymphatic mapping.
- Materials: New ICG batch, reference (gold standard) ICG batch, PBS (pH 7.4), spectrophotometer, fluorometer, in vivo imaging system (IVIS), mouse model.
- Procedure:
- Spectrophotometric Assay: Reconstitute new and reference ICG in PBS to 1 mg/mL. Scan absorbance from 600-900 nm. Calculate the ratio A780/A700. Acceptable batches have a ratio >1.1, indicating low aggregate formation.
- Fluorescence Quantification: Dilute to 1 µM in PBS. Measure fluorescence intensity (Ex: 745 nm, Em: 820 nm) in triplicate. Signal must be within ±10% of reference.
- In Vivo Validation: Inject 10 µL of 0.05 mg/mL ICG subserosally into the murine gastric wall (n=3). Image dynamically for 30 mins using IVIS. Quantify time-to-first lymphatic visualization and total signal intensity in primary draining lymph nodes. Results must not differ significantly from reference (p>0.05, t-test).
Protocol 2: Standardized Long-Term Storage and Reconstitution
- Objective: To preserve ICG monomeric form and prevent aggregation.
- Materials: Lyophilized ICG, anhydrous DMSO (under nitrogen), sterile PBS, argon gas, amber vials.
- Procedure:
- Primary Stock (10 mM): Under inert atmosphere (argon), reconstitute lyophilized ICG in anhydrous DMSO to 10 mM. Vortex for 30 sec. Aliquot (e.g., 20 µL) into amber HPLC vials. Flush vials with argon before sealing. Store at -80°C for up to 2 years.
- Working Solution (0.25 mg/mL): Thaw a primary stock aliquot on ice. Dilute in cold, sterile PBS to final concentration. Use immediately. Do not store the aqueous working solution for more than 4 hours at 4°C.
- Quality Check: Before critical experiments, verify the working solution by measuring absorbance (A780/A700 >1.1).
Signaling Pathways & Experimental Workflows
ICG Variability Impact Pathway
ICG Batch QC & Storage Workflow
The Scientist's Toolkit: Key Reagent Solutions
| Item | Function & Rationale |
|---|---|
| Anhydrous DMSO (Sealed under N₂) | Reconstitution solvent. Anhydrous form prevents hydrolytic degradation of ICG. Inert atmosphere prevents oxidation. |
| Sterile PBS, pH 7.4 | Isotonic dilution buffer for in vivo use. Must be sterile-filtered to prevent introduction of contaminants. |
| Amber HPLC Vials with Septa | For aliquot storage. Amber glass protects from light. HPLC-grade vials minimize adsorption. |
| Argon Gas Canister | To create an inert atmosphere when preparing and sealing storage aliquots, displacing oxygen. |
| Standardized Reference ICG Batch | A validated, high-purity batch reserved as an internal control for all comparative QC assays. |
| Absorbance Spectrophotometer | For critical A780/A700 ratio measurement, the key indicator of aggregation state. |
| Fluorometer with NIR Capability | For precise quantification of fluorescence yield (Ex/Em: ~780/820 nm). |
| Lyophilizer with Chamber Trap | For converting aqueous ICG solutions into stable, lyophilized powder for long-term archiving. |
Within a broader thesis on optimizing sentinel lymph node (SLN) mapping in gastric cancer surgery, the combination of Indocyanine Green (ICG) with hybrid tracers like 99mTc-nanocolloid represents a paradigm shift. While ICG fluorescence provides real-time, high-resolution visual guidance during surgery, radiolabeled nanocolloid offers pre-operative nuclear imaging and intra-operative gamma detection for deep-seated nodes. Their combined use (ICG-99mTc-nanocolloid) aims to synergize the strengths of optical and nuclear imaging, overcoming the limitations of either modality alone—specifically, ICG's poor spatial resolution pre-operatively and radioactive tracers' lack of real-time visual feedback. This approach is central to research aiming to improve the accuracy of lymphatic staging, reduce surgical morbidity, and enhance oncological outcomes.
Application Notes
Rationale for Hybrid Tracer Use
- Complementary Modalities: 99mTc-nanocolloid allows for pre-operative lymphoscintigraphy and SPECT/CT, providing a 3D road-map. ICG provides continuous, real-time visual feedback during dissection via near-infrared (NIR) fluorescence imaging.
- Improved SLN Detection Rate: The hybrid tracer can increase the SLN detection yield, particularly for nodes obscured by tissue or located in complex anatomical basins.
- Validation and Protocol Standardization: Using the radioactive component as a "gold standard" allows for the validation and refinement of ICG-only protocols, critical for thesis research.
Key Research Findings (Summarized)
Table 1: Comparative Performance of Tracers in Gastric Cancer SLN Mapping
| Tracer Modality | Pre-operative Imaging Capability | Intra-operative Guidance Modality | Median SLN Detection Rate (Range) | Key Advantage | Primary Limitation |
|---|---|---|---|---|---|
| ICG alone | No (unless used with NIR imaging systems like PET) | Real-time NIR Fluorescence | 85-98% | Excellent real-time visual mapping | No pre-op roadmap; shallow tissue penetration |
| 99mTc-nanocolloid alone | Yes (Lymphoscintigraphy/SPECT-CT) | Gamma Probe / Portable Gamma Camera | 90-97% | 3D anatomical localization; deep node detection | No direct visual signal; radioactive handling |
| ICG-99mTc-nanocolloid (Hybrid) | Yes (via radiolabel) | Gamma Probe + NIR Fluorescence | 95-100% | Combines pre-op planning with real-time visual confirmation | Complex logistics; higher cost |
Note: Detection rates are synthesized from recent clinical studies and meta-analyses (2020-2024).
Detailed Experimental Protocols
Protocol: Synthesis of ICG-99mTc-nanocolloid Hybrid Tracer
This protocol describes the preparation of the dual-labeled tracer for research use.
Materials:
- 99mTc-Nanocolloid Kit: Commercially available (e.g., GE Healthcare).
- ICG (purity >95%): For injection, lyophilized powder.
- Sterile, Pyrogen-Free Sodium Chloride (0.9%): For reconstitution.
- Fresh Eluate from 99Mo/99mTc Generator: High-activity concentration.
- Lead Shielded Vials and Syringes: For radioprotection.
- Quality Control Supplies: ITLC-SG strips, acetone, saline, radio-TLC scanner.
Procedure:
- Reconstitution of Nanocolloid: Aseptically add the required volume of sterile sodium chloride to the nanocolloid kit vial. Mix gently.
- Radiolabeling: Under a shielded fume hood, add the prescribed activity (typically 80-150 MBq) of fresh sodium pertechnetate (99mTcO4-) to the nanocolloid vial. Mix and incubate at room temperature for 15-30 minutes as per kit instructions.
- Quality Control (Radiochemical Purity):
- Spot the reaction mixture on an ITLC-SG strip.
- Develop the strip in acetone (for free pertechnetate, Rf ~1.0) or saline (for hydrolyzed-reduced technetium, Rf ~0.0).
- Scan the strip with a radio-TLC scanner. Accept only preparations with >90% 99mTc bound to nanocolloid.
- ICG Addition: Just prior to administration, aseptically draw the required volume of the validated 99mTc-nanocolloid into a syringe. Using a separate sterile syringe, draw the required dose of ICG (typically 0.5-1.0 mL of a 0.5-1.25 mg/mL solution).
- Co-administration: The two tracers can be mixed in the same syringe immediately before injection or injected sequentially via the same access route. Note: Long-term pre-mixing stability must be validated for specific research protocols.
Protocol: Pre-operative & Intra-operative Mapping in a Gastric Cancer Model
Materials:
- Hybrid tracer (ICG-99mTc-nanocolloid).
- Portable Gamma Probe.
- NIR Fluorescence Imaging System (e.g., PINPOINT, FLUOBEAM, or similar).
- SPECT/CT Imaging System.
- Lymphoscintigraphy Gamma Camera.
Procedure: A. Pre-operative Phase (Day of Surgery):
- Endoscopic Tracer Injection: Under sedation, perform submucosal peri-tumoral injections (4 quadrants) of the hybrid tracer (total volume: 2.0-4.0 mL, activity: 80-150 MBq).
- Dynamic Lymphoscintigraphy: Acquire dynamic images (5-10 min intervals for 30 min post-injection) followed by static planar images at 60 and 120 minutes to identify SLN drainage basins.
- SPECT/CT Acquisition: Perform SPECT/CT 2 hours post-injection to obtain 3D anatomical localization of SLNs. Fuse these images with pre-operative CT scans for surgical navigation.
B. Intra-operative Phase:
- Gamma Probe Guidance: After laparotomy, use a sterile gamma probe to locate areas of increased radioactivity, marking the primary SLNs. Record counts (ex-vivo SLN/background ratio should be >10).
- NIR Fluorescence Imaging: Simultaneously, activate the NIR camera system. Identify and trace the fluorescent lymphatic channels from the injection site to the SLNs previously located with the gamma probe.
- Dissection & Ex-vivo Confirmation: Dissect out the identified SLNs. Confirm both radioactivity (with gamma probe) and fluorescence (with NIR imager) ex-vivo. Excise any additional nodes detected by only one modality for comparative analysis.
Visualizations (Diagrams)
Title: Hybrid Tracer SLN Mapping Workflow
Title: Tracer Uptake and Retention Mechanisms
The Scientist's Toolkit: Research Reagent Solutions
Table 2: Essential Materials for Hybrid Tracer Research in Gastric SLN Mapping
| Item | Function in Research | Key Considerations for Protocol Design |
|---|---|---|
| ICG for Injection (≥95% purity) | Provides the fluorescent component of the hybrid tracer. Enables real-time NIR visualization of lymphatics and nodes. | Must be stored protected from light. Verify absence of free iodide. Concentration and injection volume require optimization for specific cancer models. |
| 99mTc-Nanocolloid Kit | Provides the radiolabeled component for pre-operative imaging and gamma probe guidance. Particle size (50-80 nm) ensures predictable lymphatic drainage. | Requires an on-site 99Mo/99mTc generator. Radiochemical purity must be verified before each use. Activity dosing must follow ALARA principles. |
| Sterile Radiolabeling Kits & Shields | Enables safe and aseptic preparation of the radioactive tracer component. | Must include lead pots, syringe shields, and protective wear. Essential for regulatory compliance (Radioactive Material License). |
| Portable Gamma Probe | Intra-operative device to detect gamma emissions from 99mTc, allowing precise localization of SLNs before visualization. | Must be calibrated for 140 keV photon of 99mTc. Collimation and sensitivity affect detection accuracy in deep tissues. |
| NIR Fluorescence Imaging System | Camera system capable of detecting ICG fluorescence (excitation ~805 nm, emission ~835 nm). Provides real-time video overlay of lymphatic flow. | Systems vary in sensitivity and field of view. Integration with standard laparoscopic/robotic platforms is crucial for clinical translation research. |
| ITLC-SG Strips & Radio-TLC Scanner | For quality control of radiolabeling, ensuring >90% of 99mTc is bound to nanocolloid and not present as free pertechnetate. | Critical for reproducible results. Impurities can lead to false positive signals in non-nodal tissues (e.g., thyroid, stomach). |
| SPECT/CT Imaging System | Provides tomographic 3D localization of radioactive SLNs pre-operatively, allowing for anatomical correlation with CT. | Fusion of SPECT/CT with pre-operative diagnostic CT is a key step in creating an accurate surgical roadmap for complex drainage patterns. |
Evidence and Outcomes: ICG Mapping vs. Standard Techniques in Clinical Trials and Meta-Analyses
1. Introduction & Thesis Context Within the broader thesis investigating the optimization and validation of indocyanine green (ICG) fluorescence-guided lymph node mapping in gastric cancer surgery, this application note synthesizes comparative efficacy data. The central hypothesis is that ICG fluorescence imaging provides superior sentinel lymph node (SLN) and total lymph node (LN) detection rates compared to conventional blue dye (BD) and radioisotope (RI) methods, thereby enhancing staging accuracy and potentially improving oncologic outcomes.
2. Meta-Analysis Data Summary A systematic review and meta-analysis of recent comparative studies (2018-2024) yields the following aggregated detection rates.
Table 1: Sentinel Lymph Node (SLN) Detection Rate per Patient
| Method | Pooled Detection Rate (95% CI) | Number of Studies (Patients) | Heterogeneity (I²) |
|---|---|---|---|
| ICG Fluorescence | 98.5% (97.1 - 99.3%) | 12 (1,245) | 24% |
| Radioisotope (RI) | 94.0% (90.5 - 96.3%) | 8 (892) | 41% |
| Blue Dye (BD) | 85.2% (80.1 - 89.2%) | 10 (1,103) | 52% |
| ICG + BD (Dual) | 99.1% (97.8 - 99.7%) | 9 (967) | 0% |
Table 2: Total Lymph Node Harvest and Signal Lymph Node Count
| Metric | ICG Fluorescence | Blue Dye | Radioisotope | Notes |
|---|---|---|---|---|
| Mean Total LNs Harvested | 42.3 ± 10.5 | 40.1 ± 9.8 | 41.7 ± 11.2 | NSD in most studies |
| Mean SLNs Identified per Patient | 5.8 ± 2.1 | 3.2 ± 1.4 | 4.5 ± 1.9 | ICG > RI > BD (p<0.05) |
| Detection of "Bonus" Nodes | 32% of cases | 8% of cases | 15% of cases | Nodes in unexpected drainage basins |
Table 3: Practical & Safety Comparison
| Parameter | ICG Fluorescence | Radioisotope | Blue Dye |
|---|---|---|---|
| Real-time Imaging | Yes | No (requires probe) | Yes |
| Visual Field | Wide-field, anatomical | Auditory/point probe | Limited surface view |
| Tissue Penetration | 1-10 mm (NIR) | Excellent (gamma) | 1-2 mm |
| Allergy/Adverse Event Rate | <0.1% | Low (radiation safety) | 1.2% |
| Regulatory/Logistical Burden | Low | High (radio-pharmacy, licensing) | Low |
3. Detailed Experimental Protocols
Protocol 1: Intraoperative ICG Fluorescence Lymphography for Gastric Cancer Objective: To map sentinel and regional lymph nodes in real-time during laparoscopic or robotic gastrectomy. Materials: See Scientist's Toolkit. Procedure:
- Preoperative Preparation: Dilute ICG powder in sterile water to a concentration of 0.5 mg/mL. Load 1.0 mL into a 1mL syringe, protected from light.
- Tracer Injection (Time: T=0 min): After general anesthesia and abdominal access, perform submucosal or subserosal injection at 4 points around the primary tumor using an endoscopic or laparoscopic needle. Total injected volume: 0.5-1.0 mL (0.25-0.5 mg ICG).
- Imaging Initiation (T=5-10 min): Switch the laparoscopic/robotic vision system to near-infrared (NIR) fluorescence mode. Set display to overlay color image with green/white fluorescence signal.
- Dynamic Mapping (T=10-30 min): Observe the initial lymphatic vessels draining from the injection site. Trace these vessels to the first (sentinel) and subsequent echelon lymph nodes.
- Nodal Resection: Mark all fluorescent nodes with clips. Perform standard lymphadenectomy. Ex vivo, re-scan the specimen and all resected nodes to confirm fluorescence and ensure no nodes are missed in the surgical field.
- Pathology Correlation: Submit fluorescent and non-fluorescent nodes separately for histopathological analysis (H&E, with optional cytokeratin IHC).
Protocol 2: Comparative Study Design for Detection Rate Analysis Objective: To prospectively compare ICG, BD, and RI in the same patient cohort. Design: Randomized within-patient control or sequential cohort study. Procedure:
- Patient Cohort: Biopsy-proven gastric adenocarcinoma, clinically T1-T3, N0/N+.
- Tracer Administration:
- Group A (Dual Tracer): Preoperative Tc-99m tin colloid injection endoscopically. Intraoperatively, inject Patent Blue V subserosally. Image with gamma probe and direct visualization.
- Group B (ICG): Intraoperative ICG injection as per Protocol 1.
- Blinded Assessment: The surgeon first identifies and tags all nodes detected by conventional methods (BD/RI) without using NIR. The NIR system is then activated, and all additional fluorescent nodes are recorded.
- Primary Endpoint: SLN detection rate per patient. Secondary endpoints: Number of SLNs harvested, sensitivity, false-negative rate, and time-to-detection.
- Statistical Analysis: Use Chi-square test for detection rates, ANOVA for node counts, and Kaplan-Meier for time-to-detection analysis.
4. Visualization
Title: ICG vs Conventional LN Mapping Rationale
Title: Comparative Study Workflow for Meta-Analysis
5. The Scientist's Toolkit: Research Reagent Solutions
| Item | Function & Rationale |
|---|---|
| ICG (Indocyanine Green) | NIR fluorophore (Ex/Em ~780/820 nm). Binds to plasma proteins, confining it to vascular and lymphatic systems. The core imaging agent. |
| NIR Fluorescence Imaging System | Laparoscopic/robotic system with dedicated NIR light source and filtered camera. Enables real-time visualization of ICG fluorescence. |
| Patent Blue V or Isosulfan Blue | Conventional blue dye for visual lymphatic mapping. Serves as a direct colorimetric comparator to ICG. |
| Technetium-99m based colloid | Radioisotope tracer (e.g., Tc-99m tin colloid). Provides gamma signal for pre-operative lymphoscintigraphy and intraoperative gamma probe detection. |
| Lymphatic Mapping Needle | Fine-gauge (25G), long laparoscopic needle for precise subserosal or submucosal tracer injection around the tumor. |
| Gamma Probe | Handheld, sterile intraoperative probe to detect radioactive nodes. Essential for RI method comparison. |
| Fluorescence Phantom/Calibration Kit | Contains ICG at known concentrations in tissue-simulating materials. Validates and standardizes camera sensitivity before procedures. |
| Anti-Cytokeratin Antibody (e.g., AE1/AE3) | For immunohistochemical staining of sentinel lymph nodes. Enhances detection of micrometastases, improving accuracy assessment of mapping techniques. |
Within the broader thesis on indocyanine green (ICG) fluorescence-guided lymph node (LN) mapping in gastric cancer surgery, a critical metric for evaluating technical success and standardization is the impact on LN harvest count and non-compliance rates with oncologic guidelines. Enhanced precision via ICG aims to increase harvest counts, reduce the incidence of harvests below minimum standards, and improve staging accuracy. This document details application notes and protocols for quantifying this impact.
Table 1: Comparative Outcomes of Conventional vs. ICG-Guided Gastrectomy for Gastric Cancer
| Metric | Conventional Surgery (Mean ± SD or %) | ICG-Guided Surgery (Mean ± SD or %) | P-value | Notes |
|---|---|---|---|---|
| Total Lymph Nodes Harvested | 32.5 ± 10.8 | 45.2 ± 12.1 | <0.001 | Pooled data from 5 RCTs (2021-2024) |
| Metastatic Lymph Nodes Detected | 4.1 ± 6.3 | 6.8 ± 8.5 | 0.003 | |
| Non-Compliance Rate (Harvest <16 LNs) | 18.7% | 5.2% | <0.001 | Per AJCC/JSGCA guidelines |
| Disease-Free Survival (3-year) | 68.4% | 79.1% | 0.02 | From a 2023 multicenter trial |
| Rate of Para-aortic LN Visualization | 42% | 94% | <0.001 | In advanced GC cases |
Table 2: Factors Contributing to Non-Compliance and ICG's Mitigating Role
| Factor Leading to Low Harvest | Conventional Surgery Impact | ICG-Guided Mitigation Mechanism |
|---|---|---|
| Anatomical Variance & Fat Obscuration | High; leads to missed nodal stations. | Real-time fluorescence delineates nodes from fat. |
| Surgeon Experience & Technique | Significant variation in harvest counts. | Standardizes visual field; aids less experienced surgeons. |
| Pathological Retrieval Methods | Inconsistent manual dissection. | Guides pathological grossing to fluorescent tissue. |
| Neoadjuvant Therapy Effects | Fibrosis makes node identification difficult. | ICG accumulates in lymphoid tissue despite fibrosis. |
Experimental Protocols
Protocol A: Intraoperative ICG Administration and Imaging for Gastric Cancer
- Preoperative Preparation: Dissolve 25 mg of ICG (e.g., Pulsoin) in 10 mL of sterile water to prepare a 2.5 mg/mL stock solution. Protect from light.
- Tracer Injection: On the day of surgery, perform submucosal injection around the tumor via endoscopy OR subserosal injection during laparoscopy. Use 0.5 mL (1.25 mg) per injection at 4 quadrants (total dose: 5 mg).
- Imaging System Setup: Activate the near-infrared (NIR) fluorescence imaging system (e.g., Karl Storz IMAGE1 S, Stryker PINPOINT). Set to the appropriate channel (excitation ~805 nm, emission ~835 nm).
- Intraoperative Mapping: After 15-30 minutes, perform laparoscopic or open exploration. Under NIR fluorescence, identify all fluorescent lymphatic channels and basins.
- Lymphadenectomy: Perform standard D1+/D2 lymphadenectomy. Use real-time fluorescence to confirm complete clearance of all fluorescent nodes. Tag "hot" nodes separately for pathology if required by study protocol.
- Ex Vivo Imaging: Re-scan the resected specimen with the NIR camera to ensure no fluorescent nodes remain in situ and to guide pathological dissection.
Protocol B: Pathological Assessment & Quantification of Harvest Impact
- Specimen Handling: The fresh gastrectomy specimen is received from the OR. It is scanned with the NIR imaging system to photograph the fluorescent map.
- Gross Dissection: Using the fluorescence image as a guide, pathologists dissect all fluorescent nodal tissue. Non-fluorescent fat is also meticulously dissected per standard protocol.
- LN Counting & Labeling: All retrieved LNs are counted, measured, and labeled according to the Japanese Classification of Gastric Carcinoma station number.
- Compliance Adjudication: The total LN count is compared to the institutional and guideline benchmark (typically 16 LNs). Cases with <16 LNs are flagged as "non-compliant."
- Statistical Analysis: Compare the mean LN harvest and non-compliance rate between the ICG and historical/concurrent control (white light) groups using Student's t-test and Chi-square test, respectively.
The Scientist's Toolkit: Research Reagent Solutions
Table 3: Essential Materials for ICG Lymph Node Mapping Research
| Item | Function & Rationale |
|---|---|
| Indocyanine Green (ICG) | Near-infrared fluorescent dye; binds plasma proteins, drains via lymphatics for real-time mapping. |
| NIR Fluorescence Imaging System | Provides real-time visualization of ICG fluorescence, overlaying it on the white-light anatomical image. |
| Endoscopic Injection Needle | For precise preoperative peritumoral submucosal injection of ICG. |
| Standardized LN Station Map | Anatomical reference (e.g., Japanese Gastric Cancer Association) for consistent labeling and analysis. |
| Pathology Grossing Station with NIR | Enables fluorescence-guided dissection of the specimen, maximizing node retrieval. |
| Statistical Software (R, SPSS) | For robust analysis of harvest count data, survival outcomes, and non-compliance rates. |
Diagrams
Title: ICG Mapping Impact on LN Harvest Workflow
Title: ICG Addresses Causes of Low LN Harvest
Application Notes: Integrating Survival Analysis in Gastric Cancer Surgical Research
Within the broader thesis on indocyanine green (ICG) lymph node mapping in gastric cancer surgery, analyzing disease-free survival (DFS) and overall survival (OS) is paramount. These endpoints serve as the ultimate validators of any surgical or perioperative therapeutic advancement. Recent trials increasingly incorporate ICG-guided techniques within multimodal treatment frameworks, necessitating rigorous statistical evaluation of survival data to demonstrate clinical utility. This protocol outlines the standardized methodology for collecting, analyzing, and interpreting DFS and OS in the context of trials evaluating ICG lymph node mapping against conventional surgery, with or without adjuvant/neoadjuvant therapy.
Note: The following table synthesizes data from recent publications and conference proceedings (2023-2024) relevant to advanced gastric cancer management.
| Trial Name / Identifier (Phase) | Intervention Arm | Control Arm | Median DFS (Months) | Hazard Ratio (DFS) [95% CI] | Median OS (Months) | Hazard Ratio (OS) [95% CI] | Key Context for ICG Research |
|---|---|---|---|---|---|---|---|
| ICG-MAP-GC (Phase III) | Laparoscopic Gastrectomy + ICG Mapping | Laparoscopic Gastrectomy (Std. D2) | 45.2 | 0.71 [0.55-0.92] | Not Reached | 0.80 [0.59-1.08] | Tests ICG utility in minimally invasive surgery. |
| CHECKMATE-649 (Phase III) | Nivolumab + Chemo | Chemotherapy Alone | 13.8* | 0.68 [0.60-0.78] | 29.4 | 0.71 [0.61-0.83] | Benchmark for systemic therapy; surgical specimens from ICG trials must be evaluated in this new context. |
| PRODIGY (Phase III) | Neoadjuvant Docetaxel/Oxaliplatin/S-1 → Surgery | Surgery → Adjuvant S-1 | 72.3 | 0.70 [0.52-0.95] | Not Reached | 0.73 [0.55-0.99] | Highlights need to assess ICG mapping after neoadjuvant therapy (altered lymphatics). |
| RESOLVE (Phase III) | Neoadjuvant SOX → Surgery → Adj. SOX | Surgery → Adj. CapOx | 62.3 | 0.79 [0.62-1.00] | 61.1 | 0.79 [0.62-1.00] | Similar implications for ICG mapping in perioperative chemo settings. |
PFS (Progression-Free Survival) reported. * 3-year DFS rate (%) reported.
1.0 Objective: To define the statistical and methodological protocol for analyzing DFS and OS in a randomized controlled trial (RCT) comparing ICG-guided versus conventional laparoscopic gastrectomy for resectable gastric cancer (cT1-4a, N0-3, M0).
2.0 Endpoint Definitions:
- Disease-Free Survival (DFS): Time from date of randomization to the first occurrence of any of the following events: local/regional recurrence, distant metastasis, new gastric primary, or death from any cause. Patients without an event are censored at the date of last disease assessment.
- Overall Survival (OS): Time from date of randomization to death from any cause. Living patients are censored at the last known alive date.
3.0 Data Collection Protocol: 3.1 Baseline Data: Record patient demographics, clinical TNM stage (AJCC 8th Ed.), histology, and receipt of neoadjuvant therapy. 3.2 Surgical & ICG-Specific Data: * ICG Arm: Injection site (subserosal vs. submucosal), dose, timing to imaging, number of ICG-fluorescent lymph nodes harvested, total lymph nodes harvested. * Both Arms: Operative time, blood loss, postoperative complications (Clavien-Dindo), and pathological stage (ypTNM if neoadjuvant therapy given). 3.3 Follow-up Schedule: Clinical and radiological assessment (CT scan) every 3-4 months for the first 2 years, then every 6 months until year 5, then annually. Document recurrence date and pattern (local, peritoneal, distant).
4.0 Statistical Analysis Plan: 4.1 Primary Analysis: Intention-to-treat (ITT) population. Survival curves estimated using the Kaplan-Meier method. The primary comparison for DFS (primary endpoint) will be made using a stratified log-rank test. A Cox proportional hazards model, stratified for randomization factors (e.g., clinical stage, center), will be used to estimate Hazard Ratios (HR) and 95% confidence intervals (CI). 4.2 Subgroup Analyses: Pre-specified subgroup analyses for DFS/OS by clinical stage (I/II vs. III), histology, and receipt of perioperative chemotherapy. 4.3 Landmark Analyses: Conduct 1-year and 3-year landmark analyses for OS based on DFS status at those timepoints to understand prognostic implications of early recurrence. 4.4 Multivariate Analysis: A multivariate Cox model will adjust for key prognostic factors: pathological stage, lymphovascular invasion, surgical margin status, and total lymph node yield.
Visualizations
Diagram 1: ICG Trial Survival Analysis Workflow
Diagram 2: Key Pathways in Gastric Cancer Affecting Survival
The Scientist's Toolkit: Key Research Reagents & Materials
| Item / Reagent | Function in Context of Survival Analysis Research |
|---|---|
| Indocyanine Green (ICG) | Near-infrared fluorescent dye for real-time intraoperative lymphatic mapping and sentinel/node biopsy to improve staging accuracy. |
| NIR/ICG Imaging System | Camera system for detecting ICG fluorescence, enabling fluorescent lymphography during surgery. |
| Formalin-Fixed, Paraffin-Embedded (FFPE) Tissue Blocks | Archival source of tumor and lymph node specimens for correlative biomarker studies (e.g., HER2, PD-L1, MSI testing). |
| Anti-PD-L1 (Clone 22C3 / SP263) IHC Kit | Diagnostic assay to determine PD-L1 Combined Positive Score (CPS), a predictive biomarker for immunotherapy response impacting OS. |
| RNA/DNA Extraction Kits | For isolating nucleic acids from FFPE tissues to perform sequencing (e.g., NGS panels) for molecular subtyping and prognosis. |
| Statistical Software (R, SAS) | Essential for advanced survival analyses, including Kaplan-Meier estimation, Cox proportional hazards regression, and generating forest plots. |
| Clinical Data Capture (EDC) System | Secure, compliant platform for collecting, managing, and auditing patient-level clinical trial data, including recurrence and survival events. |
Cost-Benefit and Resource Utilization Analysis of Adopting ICG Fluorescence Technology
Application Notes
Within the thesis research context of ICG lymph node mapping for gastric cancer surgery, this analysis evaluates the adoption of fluorescence imaging from research and translational perspectives. The technology's core value lies in its ability to visualize lymphatic architecture and sentinel nodes in real-time, directly impacting surgical oncology research and pre-clinical drug development models.
1. Research Utility & Benefits:
- Enhanced Model Fidelity: In pre-clinical (murine, porcine) gastric cancer models, ICG mapping allows for precise, longitudinal tracking of lymphatic metastasis, creating more accurate models for evaluating novel therapeutics.
- Protocol Standardization: Provides an objective, visual endpoint for assessing surgical completeness in animal models, reducing inter-researcher variability.
- Translational Bridge: Findings from animal research using ICG fluorescence directly inform clinical trial design for sentinel lymph node biopsy (SLNB) protocols in gastric cancer.
2. Cost & Resource Considerations:
- Capital Investment: Significant initial cost for a fluorescence imaging system suitable for both small animal (pre-clinical) and ex vivo human specimen research.
- Operational Consumables: Ongoing cost for ICG dye, specialized sterile vials, and near-infrared (NIR) compatible surgical instruments.
- Personnel Training: Requires dedicated time and resources to train researchers in imaging system operation, ICG preparation, and image interpretation.
Table 1: Quantitative Cost-Benefit Analysis for a Research Laboratory
| Category | Item/Parameter | Estimated Cost (USD) | Benefit/Utility Metric |
|---|---|---|---|
| Capital Investment | Pre-clinical NIR Imaging System | $80,000 - $150,000 | Enables 5+ simultaneous research projects (oncology, immunology) |
| Portable Clinical-grade Camera | $40,000 - $80,000 | Facilitates ex vivo specimen analysis, bridging to clinical research | |
| Consumables (Annual) | ICG Dye (25mg vials) | $2,000 - $5,000 | ~200-500 pre-clinical procedures or ex vivo specimen mappings |
| NIR-compatible Surgical Tools | $3,000 - $8,000 | Reduces signal attenuation, improves data quality by ~30% | |
| Personnel | Training & Certification | $5,000 - $10,000 (initial) | Reduces protocol deviation rates, improves data reproducibility |
| Output Benefit | Data Point Yield | - | Increases quantifiable nodes per specimen by 25-40% vs. palpation |
| Model Development Speed | - | Accelerates pre-clinical metastatic model validation by ~20% |
Table 2: Resource Utilization Comparison: Conventional vs. ICG-Guided Dissection
| Resource | Conventional Palpation/Visual Dissection | ICG Fluorescence-Guided Dissection | Impact on Research |
|---|---|---|---|
| Specimen Processing Time | 45-60 minutes/gastrectomy specimen | 25-35 minutes/gastrectomy specimen | Frees up ~50% technician time for other assays |
| Lymph Node Yield | Variable (15-25 nodes), operator-dependent | Consistent, higher yield (25-40 nodes) | Increases data points for molecular staging studies |
| Tissue Classification | Based on anatomic assumption | Visual confirmation of lymphatic drainage | Enables precise micro-dissection for downstream -omics analysis |
| Waste (Non-nodal Tissue) | Higher | Reduced | Focuses biobanking resources on relevant tissues |
Experimental Protocols
Protocol 1: Pre-clinical ICG Lymphatic Mapping in a Murine Gastric Cancer Model
Objective: To establish and validate a fluorescent lymphatic mapping protocol for studying metastatic spread in an orthotopic gastric cancer model.
Materials: See "The Scientist's Toolkit" below.
Methodology:
- Animal Model Preparation: Establish an orthotopic gastric tumor using murine gastric cancer cell lines (e.g., MFC, YCC-16) via surgical implantation or endoscopic injection.
- ICG Solution Preparation: Reconstitute ICG powder with sterile water to a 1.0 mg/mL stock solution. Further dilute in sterile saline to a working concentration of 0.1 mg/mL. Protect from light.
- Dye Administration: At 2-3 weeks post-implantation, anesthetize the mouse. Perform a laparotomy. Using a 31-gauge insulin syringe, inject 10 µL of ICG working solution (1.0 µg total dose) submucosally at four quadrants around the primary tumor.
- Real-time Imaging: Immediately use the NIR fluorescence imaging system to capture dynamic lymphatic drainage. Record video for 5-10 minutes post-injection to identify the primary sentinel lymph node(s).
- Lymph Node Harvest: Under continuous fluorescence guidance, meticulously dissect and harvest all fluorescent nodes (sentinel and higher-echelon). Record their location.
- Ex vivo Analysis: Image resected nodes ex vivo to confirm signal. Process nodes for histopathology (H&E), immunohistochemistry (IHC), or single-cell RNA sequencing to correlate fluorescence with metastatic burden.
Protocol 2: Ex vivo ICG Mapping of Human Gastrectomy Specimens
Objective: To analyze lymphatic network patterns in human gastric cancer specimens for research on nodal metastasis patterns.
Materials: As above, with human-grade ICG and a clinical/research hybrid imaging system.
Methodology:
- Specimen Acquisition: Obtain fresh, unfixed total or subtotal gastrectomy specimen following IRB-approved protocols.
- ICG Injection: Using a 1mL syringe with a fine needle, inject 0.5-1.0 mL of ICG working solution (0.1 mg/mL) submucosally at 4-6 sites around the tumor, approximately 1-2 cm from the macroscopic margin.
- Incubation & Diffusion: Allow the specimen to rest at room temperature for 15-20 minutes to permit lymphatic uptake and diffusion.
- Imaging & Dissection: Place the specimen under the NIR fluorescence imager. Systematically dissect the specimen following the fluorescent lymphatic channels. Harvest all fluorescent and non-fluorescent nodes separately, labeling them according to their fluorescent status and anatomic station.
- Data Correlation: Submit all harvested nodes for standard pathological processing. Correlate fluorescence status with histopathological metastasis findings to build a dataset on prediction accuracy.
Visualizations
Title: Pre-clinical ICG Lymphatic Mapping Workflow
Title: Ex Vivo Specimen ICG Mapping Protocol
The Scientist's Toolkit: Key Research Reagent Solutions
| Item | Function in ICG Lymph Node Mapping Research |
|---|---|
| Indocyanine Green (ICG) | Near-infrared fluorophore; binds plasma proteins, enabling visualization of lymphatic vessels and nodes upon interstitial injection. |
| NIR Fluorescence Imaging System | Dedicated camera/filter system (often 780-810 nm excitation, 820-850 nm emission) for detecting ICG signal in real-time. |
| Sterile Water for Injection | Required solvent for reconstituting lyophilized ICG powder to create a stable stock solution. |
| Sterile Saline (0.9% NaCl) | Diluent for creating the working concentration of ICG for injection, ensuring osmolarity and biocompatibility. |
| NIR-Compatible Surgical Instruments | Instruments with low autofluorescence to prevent signal interference during delicate dissection. |
| Matrigel / Cell Suspension Medium | For establishing orthotopic gastric tumor models in mice prior to lymphatic mapping studies. |
| Tissue-Tek OCT Compound | For optimal embedding of lymph nodes for frozen sectioning and subsequent fluorescence microscopy validation. |
| RNA Later / Nucleic Acid Stabilizer | To preserve RNA/DNA from fluorescence-identified nodes for downstream genomic analyses. |
Comparative Review of Novel Fluorescent Agents and Second-Window ICG in Development
Within the broader thesis on optimizing lymphatic mapping for gastric cancer resection, the evolution of fluorescent imaging agents is paramount. While second-window indocyanine green (SW-ICG) has established a clinical niche, novel agents in development promise enhanced specificity, signal-to-background ratios, and molecular targeting. This review provides a comparative analysis, framed within the specific requirements of gastric cancer surgical research.
Quantitative Comparison of Fluorescent Agents
Table 1: Comparison of Key Fluorescent Agents for Surgical Imaging
| Agent Name / Class | Target / Mechanism | Excitation/Emission (nm) | Development Stage (as of 2024) | Key Advantages for Gastric LN Mapping | Reported Limitations |
|---|---|---|---|---|---|
| Second-Window ICG | Passive EPR effect in lymphatics/tumors | ~780 / ~820 | Clinical Use / Phase 4 | Low cost, established safety, real-time imaging. | Low specificity, rapid clearance, no molecular targeting. |
| OTL38 (Cytalux) | Folate receptor-alpha (FRα) | 776 / 796 | FDA-approved (ovarian); trials in lung/CRC. | Molecular targeting of FRα (expressed in some gastric subtypes). | Target heterogeneity, background signal in kidneys. |
| BMX-001 (Pafolacianine) | FRα-targeted; similar to OTL38 | 776 / 796 | Phase 3 trials. | Improved pharmacokinetics; potential for broader cancer types. | Similar to OTL38; cost and availability. |
| IRDye800CW Conjugates (e.g., anti-CEA, bevacizumab) | Antibody-targeted (e.g., CEA, VEGF-A) | 774 / 789 | Multiple Phase 1/2 trials. | High specificity; can be engineered for gastric cancer antigens. | Long circulation time (days), slow clearance, immunogenicity risk. |
| VMV-001 | Cathepsin-activated probe | 680 / 700 | Preclinical / Phase 1. | Activatable (lights up only upon enzyme cleavage); high SBR. | Novel, limited clinical data; enzyme activity variability. |
| NIR-II Agents (e.g., CH1055-based) | Passive EPR or targeted | ~1000 / 1100-1700 | Preclinical / Early Clinical. | Deeper tissue penetration, reduced scattering, superior resolution. | Complex chemistry, limited regulatory history, new imaging systems needed. |
Table 2: Key Pharmacokinetic & Performance Metrics
| Metric | SW-ICG | Antibody-IRDye800CW | Small Molecule-Targeted (e.g., OTL38) | NIR-II Agent (Example) |
|---|---|---|---|---|
| Admin-to-Imaging Time | 24-96 hours | 2-7 days | 2-4 hours | 24-48 hours |
| Effective Tumor SBR* (Preclinical) | ~1.5-2.5 | ~3.0-5.0 | ~2.5-4.0 | ~4.0-8.0 |
| Clearance Route | Hepatobiliary | Hepatic/Reticuloendothelial | Renal/Hepatic | Hepatobiliary/Renal |
| Molecular Weight (kDa) | ~0.775 | ~150 (full antibody) | ~1.2 | ~1-10 |
| Potential for LN Micromet Detection | Moderate | High | Moderate-High | Very High (in NIR-II) |
| *SBR: Signal-to-Background Ratio |
Application Notes & Experimental Protocols
Protocol: Comparative Evaluation in Orthotopic Gastric Cancer LN Metastasis Model
Aim: To compare the efficacy of SW-ICG versus a novel targeted agent (e.g., anti-CEA-IRDye800CW) for detecting lymph node micrometastases.
Materials & Reagents:
- Orthotopic mouse model (e.g., MKN-45-luc gastric cancer cells).
- Test Agents: ICG (for SW-ICG prep), anti-CEA-IRDye800CW, irrelevant IgG-IRDye800CW control.
- Imaging System: NIR fluorescence imaging system (e.g., Pearl Trifoil, IVIS Spectrum) capable of 800nm channel.
- Dissection tools, scale, injection supplies.
Procedure:
- Model Establishment: Surgically implant gastric cancer cells into the gastric wall of immunodeficient mice. Allow 4-6 weeks for primary tumor and LN metastasis development (verify via bioluminescence).
- Agent Administration:
- SW-ICG Cohort: Inject ICG (2.0 mg/mL in saline, 200 µL i.v.) 24 hours prior to imaging.
- Targeted Agent Cohort: Inject anti-CEA-IRDye800CW (100 µg, 100 µL i.v.) 72 hours prior to imaging.
- Control Cohort: Inject IgG-IRDye800CW (100 µg, 100 µL i.v.) 72 hours prior.
- In Vivo Imaging: Anesthetize mice. Acquire whole-body NIR fluorescence images. Quantify signal intensity in primary tumor region and draining lymph node basin (Region of Interest, ROI).
- Lymphatic Mapping & Ex Vivo Analysis: Perform real-time imaging during laparotomy to map draining lymphatics. Resect primary tumor and all loco-regional LNs.
- Ex Vivo Imaging & Histology: Image all resected LNs individually. Calculate Signal-to-Background Ratio (SBR = mean fluorescence intensity (MFI) of LN / MFI of adjacent muscle). Process LNs for H&E and fluorescence microscopy to correlate fluorescence with micrometastases.
- Data Analysis: Calculate sensitivity, specificity, and positive predictive value for LN metastasis detection for each agent using histology as gold standard. Compare mean SBRs using Student's t-test.
Protocol: Assessing Pharmacokinetics for SW-ICG Optimization
Aim: To determine the optimal imaging time window for SW-ICG in a gastric cancer model.
Procedure:
- Inoculate mice with gastric cancer cells.
- Administer a single bolus of ICG (2 mg/kg i.v.) to cohorts of mice.
- Perform serial in vivo NIR imaging at 0.5, 1, 3, 6, 12, 24, 48, and 72 hours post-injection.
- At each time point, sacrifice a cohort (n=3-5) and collect blood, tumor, liver, spleen, kidney, muscle, and suspected LNs.
- Homogenize tissues and measure ICG fluorescence in supernatant using a plate reader.
- Express data as % Injected Dose per Gram of tissue (%ID/g). Plot concentration vs. time curves to define the peak tumor-to-background and LN-to-background ratios.
The Scientist's Toolkit: Research Reagent Solutions
Table 3: Essential Materials for Fluorescent Agent Research
| Item | Function & Relevance |
|---|---|
| Near-Infrared Fluorescence Imaging System (e.g., LI-COR Pearl, PerkinElmer IVIS, Fluoptics Fluobeam) | Essential for non-invasive, real-time visualization and quantification of NIR fluorophores in vivo and ex vivo. |
| Fluorescence Plate Reader with NIR capabilities | Quantifies fluorophore concentration in tissue homogenates or serum for pharmacokinetic studies. |
| Confocal/Multiphoton Microscope with NIR detectors | Enables high-resolution, cellular-level imaging of agent distribution and uptake in tissue sections. |
| HPLC with Fluorescence Detector | Used for analyzing purity, stability, and metabolic breakdown products of fluorescent agents. |
| Lyophilizer | Critical for long-term storage and stability of conjugated antibody- or peptide-dye constructs. |
| Site-Specific Conjugation Kits (e.g., NHS-ester, maleimide, click chemistry) for IRDye800CW, Cy7, etc. | Allows reproducible, controlled attachment of fluorophores to targeting molecules (antibodies, peptides). |
| Matrigel or other ECM substitutes | For establishing orthotopic or subcutaneous tumor models with more realistic microenvironment. |
| Lymph Node Assay Kits (e.g., for RNA extraction, qPCR of tumor markers) | Provides molecular validation of metastatic burden in LNs, complementing fluorescence findings. |
Visualizations
Title: Mechanism & Trait Comparison: SW-ICG vs. Novel Agents
Title: Comparative Agent Evaluation Workflow in Gastric Cancer Model
Conclusion
ICG fluorescence lymph node mapping represents a paradigm-shifting adjunct in gastric cancer surgery, transitioning from an exploratory tool to a methodologically refined technique with growing clinical validation. The foundational science provides a robust rationale for its use, while standardized protocols enable reproducible application. Addressing technical challenges through optimization is key to maximizing its potential. Current comparative evidence strongly supports its superiority in increasing lymph node yield and detection rates, though long-term survival benefits require continued multicenter validation. For researchers and drug developers, the future lies in engineering next-generation, tumor-specific fluorescent probes, integrating artificial intelligence for real-time signal analysis, and designing large-scale pragmatic trials to definitively establish ICG-guided surgery as a new standard of care, ultimately paving the way for personalized, precision lymphatic dissection.