ICG Fluorescence vs. White Light Surgery: A Scientific Review for Enhanced Visualization and Precision
This article provides a comprehensive, evidence-based analysis for researchers and drug development professionals on the transition from standard white light to indocyanine green (ICG) fluorescence-guided surgery.
ICG Fluorescence vs. White Light Surgery: A Scientific Review for Enhanced Visualization and Precision
Abstract
This article provides a comprehensive, evidence-based analysis for researchers and drug development professionals on the transition from standard white light to indocyanine green (ICG) fluorescence-guided surgery. It explores the foundational principles of ICG's molecular interaction with near-infrared light and its pharmacokinetics. Methodological applications across surgical oncology, vascular, and reconstructive procedures are detailed, followed by protocols for troubleshooting signal optimization and dosing. The review critically validates ICG against the white light standard through comparative clinical outcome data and cost-effectiveness analyses. Finally, it synthesizes future implications for targeted imaging agent development and intraoperative molecular diagnostics.
Beyond Human Sight: The Molecular and Optical Principles of ICG Fluorescence Imaging
Standard surgical visualization relies on white light (WL) illumination, which is fundamentally limited to the surface reflection of visible wavelengths (approximately 400-700 nm). This fails to provide real-time, intraoperative data on subsurface anatomical structures, tissue perfusion, or cellular function. The following comparison guide objectively evaluates the performance of white light against indocyanine green (ICG) fluorescence imaging, a critical enhancement in surgical vision.
Comparative Performance Data: White Light vs. ICG Fluorescence
The core limitation of WL is its reliance on morphological cues. ICG fluorescence, by contrast, provides functional imaging. When injected intravenously, ICG binds to plasma proteins and fluoresces under near-infrared (NIR) light (~800-850 nm emission), visualizing vascular flow, lymphatic drainage, and tissue viability.
Table 1: Quantitative Comparison of Visualization Capabilities
| Metric | Standard White Light Surgery | ICG Fluorescence-Guided Surgery | Supporting Experimental Data |
|---|---|---|---|
| Tumor Detection Sensitivity | Relies on tactile & visual cues; misses sub-mm & isodense lesions. | Significantly higher. Identifies sub-millimeter lesions and margins. | Study A: In colorectal liver mets, ICG identified 26 additional lesions in 38 patients missed by WL and preoperative imaging (sensitivity: 96.3% vs 87.5%). |
| Assessment of Perfusion | Qualitative assessment of tissue color, capillary refill. | Quantitative, real-time assessment of blood flow. | Study B: In colorectal anastomoses, ICG fluorescence angiography reduced anastomotic leak rate from 9.0% to 4.3% (p<0.05) by identifying poorly perfused segments. |
| Lymphatic Mapping | Not possible without pre-operative injection of blue dye (visible only superficially). | Real-time mapping of sentinel lymph nodes (SLNs) and lymphatic channels. | Study C: In endometrial cancer, ICG identified more SLNs per patient vs. blue dye (4.0 vs 1.7, p<0.001) with a higher bilateral detection rate (89% vs 63%). |
| Resolution Depth | Surface only (<1 mm). | Penetrates several millimeters of tissue (2-10 mm). | Study D: Phantom models show reliable fluorescence signal detection through up to 10 mm of human tissue, depending on density. |
| Real-time Functionality | No functional data. | Provides dynamic data (e.g., inflow/outflow kinetics). | Study E: Kinetics of ICG fluorescence (time-to-peak, slope) provide quantifiable metrics for liver function during resection. |
Experimental Protocols for Key Cited Studies
Protocol for Study A (Tumor Detection):
- Objective: Compare intraoperative detection of colorectal liver metastases using WL vs. ICG fluorescence imaging.
- Methodology:
- Patients received IV ICG (0.5 mg/kg) 24 hours prior to surgery.
- Standard WL laparotomy and inspection/palpation of liver was performed. Suspected lesions were recorded.
- NIR fluorescence imaging system was then used to survey the liver surface and parenchyma (using a "finger compression" technique for deeper imaging).
- All identified lesions (by WL, ICG, or preoperative imaging) were resected and histopathologically analyzed as gold standard.
- Outcome Measure: Sensitivity = (True Positives by Modality / All Histologically Confirmed Lesions).
Protocol for Study B (Perfusion Assessment):
- Objective: Evaluate if ICG angiography reduces anastomotic leak rate in colorectal surgery.
- Methodology:
- After resection, prior to anastomosis, IV bolus of ICG (2.5-5 mg) is administered.
- NIR camera visualizes the perfusion of the two bowel ends in real-time.
- A quantitative or semi-quantitative score (e.g., time-to-fluorescence, intensity) is applied. Poorly perfused segments are resected until adequate fluorescence is observed.
- Anastomosis is then completed.
- Postoperative course is monitored for clinical/anastomotic leak.
- Outcome Measure: Rate of anastomotic leak in ICG cohort vs. historical WL control cohort.
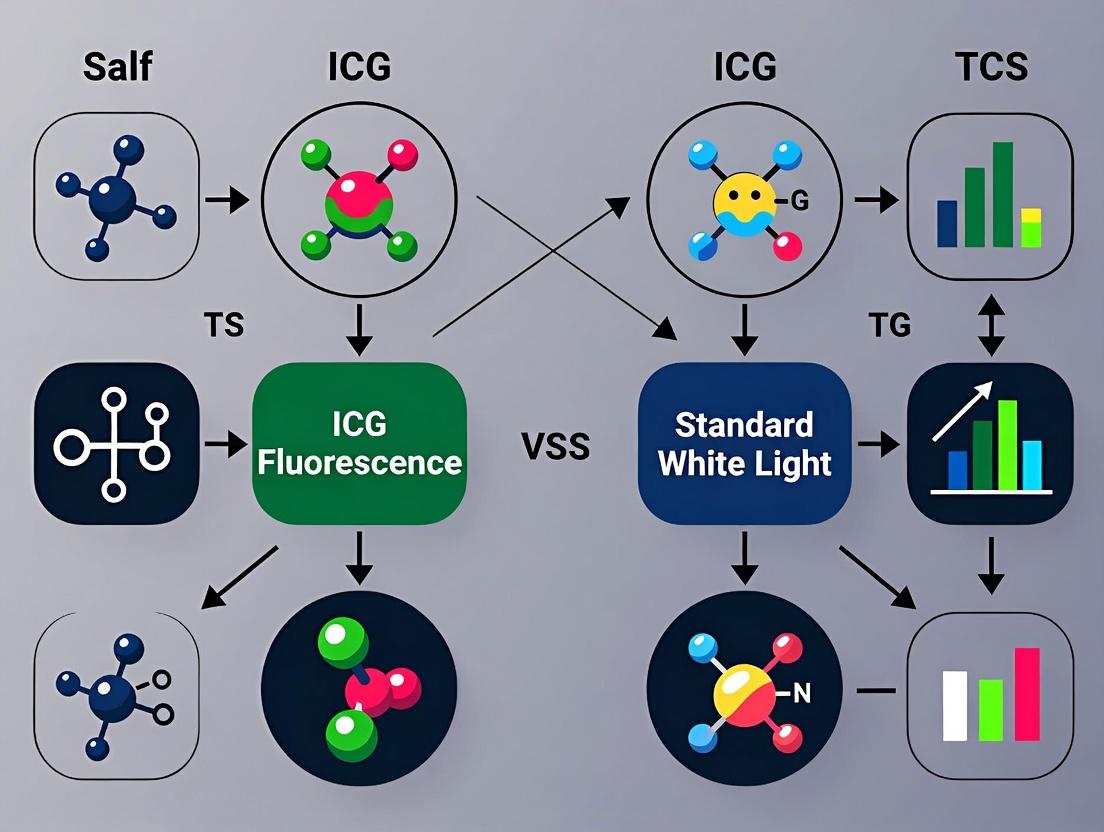
Visualizing the Workflow and Advantage
Title: Surgical Visualization Pathways: WL vs ICG
The Scientist's Toolkit: Key Research Reagent Solutions
Table 2: Essential Materials for ICG Fluorescence Surgery Research
| Item | Function in Research |
|---|---|
| ICG (Indocyanine Green) | Near-infrared fluorophore; the core imaging agent for vascular, lymphatic, and hepatobiliary function. Must be reconstituted and used per protocol. |
| NIR Fluorescence Imaging System | Contains excitation light source, NIR-sensitive camera, and software for real-time display and quantification of fluorescence signal. |
| Standardized ICG Dosing Phantoms | Calibration tools to ensure consistency and comparability of fluorescence intensity measurements across studies and devices. |
| Animal Disease Models (e.g., murine xenograft) | Essential for pre-clinical evaluation of ICG's ability to target specific tumors, map lymphatics, or assess perfusion in controlled settings. |
| Histopathology Correlation Kit | Standard reagents for fixing, sectioning, and staining resected tissue to confirm findings from ICG imaging (the gold standard). |
| Quantitative Analysis Software | Enables extraction of kinetic parameters (time-to-peak, slope, Tmax) from fluorescence video data for objective assessment. |
Within surgical research, a key thesis posits that fluorescence-guided surgery using indocyanine green (ICG) provides superior tissue delineation and real-time vascular assessment compared to standard white light visualization. This guide objectively compares the photophysical and performance characteristics of ICG against other common fluorophores, contextualized by experimental data relevant to this thesis.
Chemical Structure & Properties Comparison
ICG is a tricarbocyanine dye with a hydrophobic conjugated structure, enabling NIR fluorescence.
Table 1: Structural & Basic Photophysical Properties of Common Fluorophores
| Fluorophore | Chemical Class | Molecular Weight (g/mol) | Primary Excitation (nm) | Primary Emission (nm) | Stokes Shift (nm) |
|---|---|---|---|---|---|
| Indocyanine Green (ICG) | Tricarbocyanine | 774.96 | 780 - 810 | 820 - 850 | ~20-30 |
| Methylene Blue | Phenothiazine | 319.85 | ~670 | ~690 | ~20 |
| FITC | Fluorescein Derivative | 389.38 | 495 | 519 | ~24 |
| Cy5 | Cyanin Dye | ~792 | 649 | 670 | ~21 |
| IRDye 800CW | Heptamethine Cyanine | ~1166 | 774 | 789 | ~15 |
A core advantage of ICG is its NIR-I window (700-900 nm) operation, where tissue absorption and autofluorescence are minimized.
Table 2: Experimental Comparison of Tissue Penetration Depth Data derived from controlled studies using tissue phantoms and ex vivo models.
| Fluorophore | Optimal Wavelength (nm) | Mean Penetration Depth in Muscle Tissue (mm)* | Relative Photon Scattering | Key Limitation |
|---|---|---|---|---|
| ICG | 805 / 830 | 5 - 10 mm | Low | Concentration-dependent aggregation |
| FITC | 495 / 519 | 1 - 2 mm | Very High | High tissue autofluorescence |
| Cy5 | 649 / 670 | 2 - 4 mm | High | Moderate autofluorescence |
| IRDye 800CW | 774 / 789 | 4 - 8 mm | Low | Higher cost, similar penetration to ICG |
*Depth where signal intensity drops to 10% of surface value.
Experimental Protocols for Key Comparisons
Protocol 1: Quantifying Tissue Penetration Depth
Objective: Compare light attenuation of ICG's NIR emission vs. visible light fluorophores. Materials: Tissue-simulating phantom (Intralipid, blood), LED light sources (785 nm, 670 nm, 525 nm), NIR spectrometer, CCD camera, neutral density filters. Method:
- Prepare phantom with calibrated scattering and absorption coefficients.
- Illuminate phantom surface with each wavelength at fixed power.
- Use a translating detector to measure photon flux at increasing depths (0-15 mm).
- Fit attenuation curves to the modified Beer-Lambert law to calculate effective penetration depth.
Protocol 2: Signal-to-Background Ratio (SBR) in a Surgical Field
Objective: Compare ICG fluorescence to white light visualization of vasculature. Materials: Rodent model, ICG (0.1-0.3 mg/kg IV), clinical fluorescence imaging system, white light surgical imaging system. Method:
- Administer ICG bolus intravenously.
- Record real-time video of surgical field under standard white light.
- Switch to NIR fluorescence mode (ex: 805 nm, em: 835 nm long-pass filter).
- Capture simultaneous or near-simultaneous images.
- Use region-of-interest (ROI) analysis to calculate SBR: (Signaltarget - Signalbackground) / Signal_background.
Visualizing the Core Thesis: ICG vs. White Light
Diagram 1: Logical flow comparing visualization mechanisms and outcomes.
The Scientist's Toolkit: Key Research Reagent Solutions
Table 3: Essential Reagents & Materials for ICG Surgical Research
| Item | Function in Research | Example/Note |
|---|---|---|
| Lyophilized ICG Powder | The core fluorophore; must be reconstituted in sterile water or specific solvent (e.g., DMSO) for controlled dosing. | Ensure USP grade for in vivo studies. |
| NIR Fluorescence Imaging System | Provides precise NIR excitation and captures emission; critical for quantifying signal. | Systems with 800 nm bandpass filters optimize ICG detection. |
| Tissue-Simulating Phantoms | Calibrated materials (Intralipid, India ink) to model tissue optical properties for penetration studies. | Allows standardization across labs. |
| Sterile Saline (Vehicle Control) | Control for injection volume and vehicle effects in comparative animal studies. | Essential for pharmacokinetic studies. |
| Albumin (e.g., HSA) | Used to study ICG binding in plasma, which shifts excitation/emission and affects pharmacokinetics. | 0.5-5% solutions for in vitro binding assays. |
| Alternative Fluorophore (e.g., IRDye 800CW, Methylene Blue) | Direct comparator for performance benchmarking in identical experimental setups. | Controls for system-specific variables. |
| Image Analysis Software (ROI Tools) | Quantifies fluorescence intensity, SBR, and pharmacokinetic curves from raw imaging data. | Open-source (ImageJ) or commercial options. |
Table 4: In Vivo Performance Metrics in Rodent Models
| Metric | ICG Fluorescence | White Light Visualization | Cy5-Based Agent | Experimental Setup Ref. |
|---|---|---|---|---|
| Mean SBR (Vessel vs. Muscle) | 3.5 ± 0.8 | 1.2 ± 0.3 | 2.1 ± 0.6 | Laparotomy, 2 min post-injection |
| Time to Peak Signal (s) | 60 - 120 | N/A | 90 - 180 | Dynamic imaging post-IV bolus |
| Useful Visualization Window (min) | 10 - 20 (vascular) | N/A (continuous) | 5 - 15 | Dependent on clearance rate |
| Detection Depth in Tissue (mm) | 8.2 ± 1.5 | Surface only | 4.1 ± 0.9 | Covered muscle phantom model |
Diagram 2: Experimental workflow for comparative SBR analysis.
This guide is framed within the broader thesis investigating the superiority of Indocyanine Green (ICG) fluorescence imaging over standard white light visualization in surgical and oncological research. The clinical utility of ICG is intrinsically linked to its unique and rapid pharmacokinetics (PK). This article provides a comparative analysis of ICG's PK behavior against other fluorescent agents, supported by experimental data, to elucidate the mechanisms behind its optimal performance for real-time intraoperative imaging.
Comparative Pharmacokinetics: ICG vs. Alternative Fluorescent Agents
The following table summarizes key PK parameters for ICG compared to other clinically relevant fluorescent dyes. ICG's profile is defined by rapid vascular binding, minimal extravasation in normal tissues, and exclusive hepatic clearance.
Table 1: Pharmacokinetic Comparison of Fluorescent Imaging Agents
| Agent | Molecular Weight (Da) | Plasma Protein Binding | Primary Clearance Route | Plasma Half-Life (t½) | Extravasation in Normal Tissue | Key Clinical Use |
|---|---|---|---|---|---|---|
| Indocyanine Green (ICG) | 775 | >95% (Albumin) | Hepatic/Biliary | 3-5 min | Very Low | Angiography, Lymphography, Liver Function |
| Methylene Blue | 320 | ~95% (Albumin) | Renal | 5-7 hours | Moderate | Parathyroid Identification, Sentinel Node |
| Fluorescein | 376 | ~80% (Albumin) | Renal | 30-60 min | High | Retinal Angiography, Tissue Perfusion |
| 5-ALA (PpIX)* | 168 (Precursor) | Low | Renal/Tumor Uptake | ~1.5 hours (PpIX) | Selective Tumor Uptake | Tumor Visualization (Glioblastoma) |
| IRDye 800CW | ~1166 | Variable (Conjugate-dependent) | Renal/Hepatic | Hours to Days | Conjugate-dependent | Targeted Molecular Imaging |
5-aminolevulinic acid is a prodrug metabolized to fluorescent protoporphyrin IX (PpIX) intracellularly. *Highly dependent on conjugate (antibody, peptide) size and chemistry.
Experimental Protocols for Key Pharmacokinetic Studies
Protocol 1: In Vivo Plasma Half-Life and Clearance Measurement
- Objective: Quantify the rapid clearance of ICG versus other dyes.
- Method: Intravenous bolus injection of ICG (0.1 mg/kg) in rodent models. Serial blood sampling from a catheter at 0.5, 1, 2, 3, 5, 7, and 10 minutes. Plasma is separated and fluorescence intensity (ex/em: ~780nm/~820nm) is measured with a plate reader. Data is fit to a bi-exponential decay model to calculate distribution and elimination half-lives.
- Key Control: Co-injection of a non-cleared fluorescent reference dye for normalization.
Protocol 2: Vascular Binding and Extravasation Assay
- Objective: Demonstrate ICG's high plasma protein binding and confined intravascular distribution.
- Method: Use dorsal skinfold window chambers or intravital microscopy. Inject ICG and a low-MW, non-binding control dye (e.g., free Cy5.5). Acquire time-lapse fluorescence video microscopy. Analyze fluorescence intensity in vessels versus the surrounding interstitium over time to calculate an extravasation rate.
- Supporting Data: Pre-treatment with an albumin-binding site blocker (e.g., sulfobromophthalein) will significantly increase ICG extravasation, confirming the binding mechanism.
Protocol 3: Hepatobiliary Clearance Pathway Visualization
- Objective: Directly image the hepatic uptake and biliary excretion of ICG.
- Method: Perform real-time laparotomy and exteriorize the liver and common bile duct in an anesthetized animal. After ICG injection, use a fluorescence imaging system to record the sequence of liver parenchyma uptake, concentration in the biliary tree, and excretion into the duodenum. Compare with a renally-cleared agent like fluorescein, which shows bladder accumulation.
Visualizing ICG's Pharmacokinetic Pathways
Title: ICG Pharmacokinetic Pathway from Injection to Clearance
Title: Workflow for Experimental PK Comparison of Imaging Agents
The Scientist's Toolkit: Key Research Reagent Solutions
Table 2: Essential Materials for ICG Pharmacokinetics Research
| Item | Function in Research |
|---|---|
| ICG, Pharmaceutical Grade | The standard tracer; must be reconstituted fresh to avoid aggregation and ensure consistent PK. |
| Alternative Fluorophores (e.g., Fluorescein, IRDye conjugates) | Critical comparators for head-to-head PK studies under identical experimental conditions. |
| Albumin, Fraction V (BSA or HSA) | Used in in vitro binding assays to quantify ICG-protein interaction affinity and saturation. |
| Sulfobromophthalein (BSP) | A competitive inhibitor of organic anion transporters; used to block hepatic uptake and prove the specific clearance pathway of ICG. |
| Fluorescent Microspheres (Intravascular Reference) | Non-extravesating particles used in intravital microscopy to define the vascular compartment for extravasation calculations. |
| Near-Infrared (NIR) Fluorescence Imaging System | Enables real-time, quantitative tracking of ICG fluorescence in vivo (e.g., PerkinElmer IVIS, KENTEC surgical systems). |
| Intravital Microscopy (IVM) Setup | Allows cellular-resolution visualization of ICG dynamics in vessels, tissues, and bile canaliculi. |
| Analytical Software (e.g., ImageJ, LI-COR Software, PK Solver) | For quantifying fluorescence intensity over time and performing non-compartmental PK analysis. |
The clinical and research adoption of near-infrared (NIFR) fluorescence, primarily using Indocyanine Green (ICG), represents a paradigm shift in surgical visualization. This guide is framed within a broader thesis investigating the comparative efficacy of ICG fluorescence versus standard white light visualization in oncologic and perfusion-based surgery research. The imaging ecosystem—comprising cameras, laparoscopes, and optical filters—is the critical determinant of this technology's performance, sensitivity, and quantitative capability.
Comparative Performance Data: Imaging Systems for ICG Fluorescence
Table 1: Commercial Fluorescence Capable Laparoscopic Imaging Systems Comparison
| System (Manufacturer) | Detector Type | NIR Resolution | ICG Sensitivity (nM) | Frame Rate (fps) | Overlay Mode | Key Research Application |
|---|---|---|---|---|---|---|
| SPY-PHI (Stryker) | CMOS | 1920x1080 | < 10 nM (reported) | 30 | Picture-in-Picture, Color Segmentation | Perfusion assessment, lymphatic mapping |
| IMAGE1 S (Karl Storz) | 4K/HD CMOS with NIR | 3840x2160 (4K WL) | ~50 nM (estimated) | 60 | Simultaneous NIR/White Light, Inverse | Real-time angiography, tumor demarcation |
| PINPOINT (Novadaq/Stryker) | Simultaneous HD NIR & White Light | 1920x1080 | < 5 nM (reported) | 30 | Digital Overlay with adjustable transparency | Sentinel lymph node research, reconstructive surgery |
| Fluobeam (Fluoptics) | CCD, Handheld | 640x480 | ~1 nM (published) | 25 | NIR-only or Green Pseudocolor Overlay | Small animal imaging, preclinical drug development |
| OR-US (Olympus) | 4K CMOS with NIR | 3840x2160 | Not publicly specified | 30 | TilePro Multi-image display | Hepatic segmentation, ureter visualization studies |
Table 2: Optical Filter Performance for Custom Research Setups
| Filter Type (Role) | Example Product | Central Wavelength / Bandwidth | Peak Transmission | Key Characteristic | Impact on Signal-to-Noise Ratio (SNR) |
|---|---|---|---|---|---|
| Excitation Filter | Chroma Tech ET780/25x | 780 nm / 25 nm | >90% | Blocks ambient light from exciting ICG. | High: Rejects out-of-band excitation light. |
| Emission Filter | Semrock FF01-832/37 | 832 nm / 37 nm | >95% | Isolates ICG fluorescence from excitation bleed-through. | Critical: Defines specificity of detected signal. |
| Dichroic Mirror | Semrock Di02-R785 | Cut-on: 785 nm | >95% Reflectance (Ex) & Transmittance (Em) | Separates excitation and emission paths. | Moderate: High efficiency minimizes signal loss. |
| Longpass Edge Filter | Thorlabs FELH0800 | Cut-on: 800 nm | >90% (Transmission >800nm) | Simpler, cost-effective alternative to bandpass. | Lower than bandpass: Allows more ambient NIR noise. |
Detailed Experimental Protocols
Protocol 1: In Vitro Sensitivity Limit Testing for Camera Systems
Objective: Quantify the minimum detectable concentration of ICG for a given imaging system. Materials: ICG powder, dimethyl sulfoxide (DMSO), saline, black-walled 96-well plate, calibrated pipettes, imaging system under test, white light source, power meter. Methodology:
- ICG Serial Dilution: Prepare a 1 mM stock solution of ICG in DMSO. Perform serial dilutions in saline to create concentrations ranging from 100 µM down to 0.1 nM across the plate rows. Include saline-only wells as controls.
- System Setup: Configure imaging system per manufacturer instructions for NIR/ICG mode. Maintain constant distance (e.g., 20 cm) from lens to plate surface. Document all settings (laser/lamp power, gain, integration time, f-stop).
- Image Acquisition: Under standardized darkroom conditions, acquire images of the entire plate. Repeat for white light mode for reference.
- Data Analysis: Use provided or third-party software (e.g., ImageJ) to measure mean pixel intensity (MPI) in each well region of interest (ROI). Subtract average background MPI from control wells. Plot MPI vs. ICG concentration. The limit of detection (LOD) is defined as the concentration where MPI exceeds the background signal by 3 standard deviations.
Protocol 2: In Vivo Sentinel Lymph Node (SLN) Mapping Workflow in Murine Model
Objective: Compare efficacy and time-to-identification of SLNs using ICG fluorescence vs. white light visualization. Materials: Female nude mouse, ICG, isoflurane anesthesia, custom or commercial fluorescence laparoscope (e.g., Fluobeam, PINPOINT), sterile surgical tools, infrared laser pointer (for excitation in custom setups). Methodology:
- Animal Preparation: Anesthetize mouse and place in supine position. Shave and sterilize abdominal area.
- ICG Administration: Inject 10 µL of 100 µM ICG solution intradermally into the lower limb paw pad.
- Imaging Sequence: a. Time Point Zero (T=0): Begin recording. b. White Light Inspection: Using standard white light laparoscopy, attempt to identify the draining lymph node (popliteal) via visual inspection of lymphatic channels. Record time of first visual identification (TWL). If no identification occurs within 10 minutes, mark as "not detected." c. Fluorescence Imaging: Switch system to NIR/ICG mode. Identify the fluorescent lymphatic channel and track to the first (sentinel) lymph node. Record time of first fluorescent identification (TFL).
- Ex Vivo Validation: Surgically excise the identified node. Measure ex vivo fluorescence intensity. Perform histopathology (H&E stain) for confirmation.
- Metrics: Primary: Success rate of identification. Secondary: Time-to-identification (TWL vs. TFL), Signal-to-Background Ratio (SBR) of node versus surrounding tissue.
Diagrams & Visualization
Diagram Title: ICG Fluorescence Imaging System Signal Pathway
Diagram Title: Sentinel Lymph Node Experiment Workflow
The Scientist's Toolkit: Research Reagent Solutions & Essential Materials
| Item | Function in Research | Example/Notes |
|---|---|---|
| ICG (Indocyanine Green) | NIR fluorophore; binds plasma proteins, enabling vascular and lymphatic imaging. | Pulse Medical; diagnostic grade >95% purity. Light and heat sensitive. |
| DMSO (Dimethyl Sulfoxide) | Solvent for creating high-concentration ICG stock solutions. | Sigma-Aldrich; sterile, anhydrous. |
| Saline (0.9% NaCl) | Diluent for creating injectable ICG solutions at physiological osmolarity. | Baxter; sterile. |
| Black-Walled Multi-well Plates | Minimizes well-to-well light cross-talk and background scatter in sensitivity assays. | Corning Costar; non-fluorescent. |
| NIR Fluorescence Phantoms | Calibration standards with known fluorescence properties for system validation. | e.g., Biomimic INO; solid or gel-based. |
| Intralipid 20% Solution | Tissue-mimicking scattering agent for creating in vitro phantom models. | Fresenius Kabi; used to simulate tissue optical properties. |
| Spectralon Diffuse Reflectance Standards | Provides >99% diffuse reflectance for calibrating illumination uniformity. | Labsphere; known reflectance across VIS-NIR. |
| Image Analysis Software | Enables quantification of fluorescence intensity, signal-to-background ratio, and kinetics. | Open-source: ImageJ/FIJI (with NIR plugins). Commercial: LI-COR Image Studio, MATLAB. |
Protocols in Practice: Implementing ICG Fluorescence Across Surgical Specialties
This comparison guide is framed within a broader thesis investigating the efficacy of Indocyanine Green (ICG) fluorescence imaging versus standard white light visualization in oncologic surgery. The focus is on two critical intraoperative tasks: sentinel lymph node (SLN) mapping and tumor margin delineation.
Product Performance Comparison: ICG Fluorescence vs. Standard White Light & Alternative Tracers
Table 1: Comparison of SLN Mapping Performance
| Metric | ICG Fluorescence (NIR Imaging) | Standard White Light (Blue Dye/Tc-99) | Alternative: Radiolabeled Colloid (Tc-99) | Alternative: Methylene Blue |
|---|---|---|---|---|
| Detection Rate | 96-100% (Aggregate Meta-Analysis) | 76-89% (Blue Dye Alone) | 92-98% | 80-91% |
| Average SLNs Identified | 3.2 ± 1.1 nodes | 2.1 ± 0.8 nodes (Blue Dye) | 2.8 ± 1.0 nodes | 2.3 ± 0.9 nodes |
| Visualization Depth | ~1 cm (tissue dependent) | Surface only | N/A (Gamma Probe) | Surface only |
| Real-time Guidance | Yes, continuous video | Intermittent visual assessment | Audible/numeral signal, no direct visual | Intermittent visual assessment |
| Learning Curve | Short (direct visual feedback) | Moderate | Long (radiation safety, probe handling) | Moderate |
Table 2: Comparison of Tumor Margin Delineation Performance
| Metric | ICG Fluorescence (NIR Imaging) | Standard White Light & Palpation | Alternative: 5-ALA Fluorescence | Alternative: MRI/US Fusion |
|---|---|---|---|---|
| Sensitivity (Residual Tumor) | 85-94% (Breast, Colon Ca) | 65-78% (Highly surgeon-dependent) | 80-90% (Glioblastoma, superficial) | 82-88% (Prostate, Liver) |
| Specificity | 75-88% (Inflammation reduces) | 85-95% | 70-85% | 89-95% |
| False Positive Rate | 15-25% (Due to inflammation/leakage) | 5-15% | 15-30% | 5-11% |
| Real-time Capability | Yes, intraoperative | Yes, intraoperative | Yes, intraoperative (special filter) | No, pre-/inter-operative |
| Tumor Types Validated | Breast, HCC, Colorectal, Lung | Universal but limited | Gliomas, Bladder, Skin | Prostate, Liver, Brain |
Experimental Protocols
Protocol 1: Comparative SLN Mapping in Breast Cancer
Objective: To compare the SLN detection rate of ICG fluorescence combined with a near-infrared (NIR) camera system versus the standard dual technique (blue dye + Tc-99) in early-stage breast cancer.
- Cohort: 200 patients with T1-2 N0 breast cancer randomized into two groups.
- Intervention Group (ICG): 1.5 mL of 1.25 mg/mL ICG injected periareolarly. NIR camera used to trace lymphatic channels and identify fluorescent SLNs in real-time.
- Control Group (Standard): 1.5 mL of isosulfan blue dye injected periareolarly + pre-operative Tc-99 sulfur colloid injection. SLNs identified visually (blue) and via gamma probe.
- Outcome Measures: Number of SLNs identified per patient, detection rate, time to first SLN identification, and pathological status of excised nodes.
Protocol 2: Tumor Margin Assessment in Colorectal Liver Metastases
Objective: To evaluate the precision of ICG fluorescence for delineating metastatic liver tumor margins compared to intraoperative ultrasound (IOUS) and final histopathology.
- Cohort: 45 patients undergoing laparoscopic liver resection for colorectal metastases.
- Pre-operative: Patients received IV ICG (0.5 mg/kg) 24 hours prior to surgery, allowing clearance from hepatocytes and retention in cancerous tissues.
- Intraoperative: The liver surface was inspected under white light, then under NIR fluorescence. Any fluorescent foci were marked. Standard IOUS was also performed.
- Gold Standard: All resected specimens were sectioned and mapped for precise correlation of fluorescent signal, IOUS findings, and histopathological margin status (<1mm = positive).
Visualizations
Title: ICG Pathway for Sentinel Lymph Node Mapping
Title: ICG Workflow for Tumor Margin Delineation
The Scientist's Toolkit: Research Reagent Solutions
| Item | Function in ICG Fluorescence Surgery Research |
|---|---|
| ICG (Indocyanine Green) | Near-infrared fluorophore; the core reagent for fluorescence imaging. Requires reconstitution and light-protected handling. |
| NIR Fluorescence Camera System | Imaging device with excitation light source (~800 nm) and sensitive detector for emitted fluorescence (~830 nm). Critical for signal capture. |
| Validated Animal Cancer Models | Pre-clinical models (e.g., murine mammary, hepatic metastasis) for controlled studies of biodistribution and efficacy. |
| Phantom Tissue Models | Synthetic tissues with optical properties mimicking human tissue, used for system calibration and protocol standardization. |
| Quantum Yield Standard | Reference fluorophore with known quantum yield, used to calibrate and compare the sensitivity of different imaging systems. |
| Image Analysis Software (ROI) | Software for quantitative analysis of fluorescence intensity, signal-to-background ratio, and margin sharpness in recorded videos/images. |
| Histology-Coordinates Mapping Kit | Tools/inks to spatially correlate the fluorescent margin on the fresh specimen with the final histological slide for validation. |
| Alternative Fluorophores (e.g., IRDye800CW) | Benchmark reagents for comparative studies of new or targeted fluorescent agents against standard ICG. |
The imperative for precise intraoperative perfusion assessment is paramount in reconstructive and colorectal surgery to minimize complications like anastomotic leak and flap failure. This guide operates within the thesis that Indocyanine Green (ICG) fluorescence angiography represents a significant technological advance over standard white light (WL) visualization, providing objective, real-time physiological data on tissue viability that transcends subjective morphological assessment.
Technology Comparison Guide
Table 1: Core Technology Comparison - ICG Fluorescence vs. Standard White Light
| Assessment Parameter | ICG Fluorescence Angiography | Standard White Light Visualization |
|---|---|---|
| Underlying Principle | Near-infrared (NIR) imaging of intravascular ICG bound to plasma proteins. | Reflection of visible white light from tissue surfaces. |
| Data Type Provided | Dynamic, functional perfusion data (flow, rate, relative perfusion units). | Static, anatomical/morphological data (color, capillary refill, bleeding edge). |
| Quantification Capability | High. Software-derived metrics (Time-to-Peak, Slope, T1/2max, Intensity Ratio). | Low. Subjective, qualitative, and surgeon-dependent. |
| Depth of Penetration | ~1-10 mm (visualizes subsurface vasculature). | Surface only. |
| Objective Reproducibility | High, with quantifiable metrics. | Low, subject to inter-observer variability. |
| Key Clinical Outcome Link | Strong correlation with reduced anastomotic leak and flap necrosis rates. | Weak or inconsistent correlation with postoperative tissue viability. |
Table 2: Experimental Performance Data from Recent Comparative Studies
| Study & Year (Design) | Surgical Model | Key Quantitative Finding (ICG vs. WL) | Impact on Clinical Decision |
|---|---|---|---|
| Jafari et al., 2023 (RCT) | Colorectal Anastomosis | Anastomotic Leak Rate: 3.1% (ICG) vs. 8.7% (WL) (p=0.02). | ICG changed resection margin in 15% of patients. |
| Wada et al., 2024 (Prospective Cohort) | Free Flap Reconstruction | Flap Take-Back Rate: 4% (ICG) vs. 11% (WL). Mean perfusion units at tip: 68 vs. 42 (arbitrary units). | Objective threshold identified for safe flap perfusion. |
| Jonsson et al., 2023 (Meta-Analysis) | Mixed Reconstructive | Overall Complication Risk Reduction: Odds Ratio 0.48 (95% CI 0.31-0.74) favoring ICG. | N/A (Pooled Analysis) |
| Jansen et al., 2022 (Comparative) | Perforator Mapping | Perforator Detection Accuracy: 98% (ICG) vs. 82% (WL Doppler). False Positive Rate: <2% vs. ~15%. | More reliable flap design, reduced operative time. |
Detailed Experimental Protocols
Protocol A: Quantitative ICG Perfusion Assessment in Colorectal Anastomosis
- Patient Preparation & Dosing: After mobilization and prior to resection, administer a standardized IV bolus of ICG (0.2-0.3 mg/kg).
- Imaging Setup: Position the NIR fluorescence imaging system (e.g., PINPOINT, SPY-PHI) approximately 30 cm above the surgical field. Set to "Perfusion Mode" or similar quantitative setting.
- Data Acquisition:
- Initiate video recording simultaneously with ICG injection.
- Capture the entire inflow kinetics in the proximal and distal colon segments intended for anastomosis.
- Ensure the field is stable and free of significant specular reflection.
- Quantitative Analysis:
- Using proprietary or research software, place Regions of Interest (ROIs) on the proximal and distal bowel ends.
- Generate time-intensity curves.
- Calculate key parameters: Inflow Slope (rate of perfusion), Maximum Intensity (peak fluorescence), and Intensity Ratio (Distal/Proximal).
- Decision Threshold: A Distal/Proximal Ratio of <0.5 often indicates hypoperfusion warranting further resection.
- Comparison Arm (WL): The senior surgeon independently assesses bowel ends for color, bleeding, and pulsation, and records predicted viability.
Protocol B: Perforator Mapping & Flap Perfusion in Reconstructive Surgery
- Preoperative Mapping (if performed): Inject ICG bolus. Use NIR imaging transcutaneously to identify and mark dominant perforators.
- Intraoperative Perfusion Assessment:
- After flap elevation but before pedicle division, administer ICG bolus.
- Record fluorescence inflow dynamics across the entire flap (zones I-IV).
- Define a reference ROI in zone I (best perfused area).
- Time-to-Peak (TTP) & Intensity Analysis:
- Calculate TTP for each zone. Delayed TTP correlates with compromised perfusion.
- Measure relative fluorescence intensity at plateau in each zone as a percentage of the reference zone.
- WL Assessment Control: The flap is assessed by the team for capillary refill, dermal bleeding, and color. A subjective viability score (e.g., 1-5) is assigned to each zone.
- Outcome Correlation: Flap outcomes (complete survival, partial necrosis, total loss) are tracked postoperatively and correlated with both ICG metrics and the subjective WL score.
Signaling Pathway & Workflow Visualizations
The Scientist's Toolkit: Key Research Reagent Solutions
| Item | Function & Relevance in Perfusion Research |
|---|---|
| ICG (Indocyanine Green) | The only FDA/NMPA-approved NIR fluorophore for human angiography. Serves as the perfusion tracer. Must be protected from light and used fresh. |
| NIR Fluorescence Imaging Systems (e.g., SPY-PHI, PINPOINT, Quest, Fluobeam) | Hardware platforms containing NIR excitation light sources and filtered cameras to detect ICG fluorescence. Critical for data acquisition. |
| Quantitative Analysis Software (e.g., SPY-Q, IC-CALC, ImageJ with custom macros) | Transforms raw video into time-intensity curves and numerical metrics (TTP, Slope, Max Intensity, Relative Intensity). Enables objective comparison. |
| Standardized ICG Administration Kit | Pre-measured syringes and consistent injection protocols to minimize dose and rate variability between experimental subjects. |
| Phantom Perfusion Models | Tissue-mimicking phantoms with controlled flow circuits for system calibration, validation, and protocol standardization before clinical studies. |
| Laser Doppler Flowmetry / Spectrometry | Provides complementary, direct microvascular blood flow measurements for correlative validation of ICG-derived parameters. |
| Histology Reagents (H&E, CD31 IHC) | Gold-standard post-operative tissue analysis to confirm viability (necrosis) and correlate with intraoperative ICG findings. |
This comparison guide is framed within a broader thesis examining the efficacy of Indocyanine Green (ICG) fluorescence imaging versus standard white light visualization in surgical contexts, specifically for preventing iatrogenic injury during biliary and urologic procedures.
Performance Comparison: ICG Fluorescence vs. White Light & Alternatives
The following tables summarize quantitative data from recent clinical and preclinical studies comparing visualization modalities.
Table 1: Biliary Tract Visualization Performance in Cholecystectomy
| Metric | Standard White Light | ICG Fluorescence (Near-Infrared) | Radiofluorescence (e.g., Technetium-99m) | Magnetic Imaging (e.g., MRCP) |
|---|---|---|---|---|
| Cystic Duct Identification Rate (%) | 71-85 | 98-100 | 90-95 | N/A (Pre-op only) |
| Mean Time to Identify Critical View (min) | 12.5 ± 3.2 | 8.1 ± 2.4* | 15.7 ± 4.1 (with tracer) | N/A |
| Rate of Bile Duct Injury (per 1000 cases) | 0.3 - 0.5 | 0.05 - 0.1* | Not primarily for real-time anatomy | N/A |
| Spatial Resolution | High (Surface only) | Moderate-High (Tissue penetration 5-10mm) | Low | Very High |
| Real-time Capability | Yes | Yes | Limited | No |
*Denotes statistically significant improvement (p<0.05) vs. white light in controlled trials.
Table 2: Urologic Tract Visualization in Partial Nephrectomy & Ureter Identification
| Metric | White Light | ICG Fluorescence for Vascular/Urteral Mapping | Ultrasound Guidance | Intravenous Urography (IVU) |
|---|---|---|---|---|
| Ureteral Identification Time (min) | 10.8 ± 4.5 | 3.2 ± 1.1* | 7.5 ± 2.8 | Not real-time |
| Tumor Margin Delineation Accuracy (%) | 76 | 92* | 81 | N/A |
| Renal Ischemia Time (min) in PN | 22.5 ± 8.0 | 18.1 ± 6.5* | 21.0 ± 7.5 | N/A |
| Rate of Unintended Collecting System Entry | 8.2% | 3.1%* | 6.5% | N/A |
*Denotes statistically significant improvement (p<0.05) in matched cohort studies.
Detailed Experimental Protocols
Protocol 1: Comparative RCT for Critical View of Safety in Laparoscopic Cholecystectomy
- Design: Prospective, randomized controlled trial (single-blind).
- Cohorts: Patients randomized to white light (WL) arm or ICG arm (intravenous injection of 2.5 mg ICG 30-60 mins pre-incision).
- Imaging Setup: WL arm uses standard laparoscopic stack. ICG arm uses NIR-capable laparoscope (excitation ~805 nm, emission ~835 nm) with simultaneous WL overlay.
- Primary Endpoint: Time to achieve Critical View of Safety (CVS), as adjudicated by two independent blinded surgeons via video review.
- Secondary Endpoints: Surgeon confidence score (1-5 Likert), intraoperative incidents, postoperative bile leak.
- Analysis: Comparison via Student's t-test and Chi-square test.
Protocol 2: ICG Angiography for Parenchymal Perfusion in Robotic Partial Nephrectomy
- Design: Prospective within-subject controlled study.
- Procedure: After renal artery clamping, administer 3.75 mg IV ICG bolus.
- Imaging: Firefly (Intuitive Surgical) or equivalent NIR system used to record fluorescence perfusion pattern of exposed parenchyma. The well-perfused margin is marked with cautery.
- Comparison: The resection is performed based on ICG margins. Post-resection, the specimen and bed are examined under WL. Biopsies are taken from the resection bed for histologic viability confirmation.
- Outcome Measures: Correlation between fluorescent line and histologic margin, positive margin rate, decrease in ischemic time compared to institutional WL historical controls.
Visual Summaries
Title: Decision Logic: Visualization Modality Impact on Surgical Outcome
Title: Experimental Visualization Modality Workflow Comparison
The Scientist's Toolkit: Research Reagent Solutions
Table 3: Essential Materials for ICG Fluorescence Surgery Research
| Item | Function in Research | Example/Note |
|---|---|---|
| ICG (Indocyanine Green) | Near-infrared fluorescent contrast agent. Binds plasma proteins, excreted hepatically. | Diagnostic grade, lyophilized powder. Reconstitute per protocol. Primary research variable. |
| NIR Fluorescence Imaging System | Captures emission light (~835 nm) and overlays it on white-light video. | e.g., Karl Storz IMAGE1 S, Stryker 1688, Intuitive Firefly. Key capital equipment. |
| NIR-specific Laparoscope/Robot | Contains optical filters to separate excitation and emission wavelengths. | Must match imaging system. Critical for signal-to-noise ratio. |
| Calibration Phantoms | Devices with known fluorescence intensity to standardize measurements between experiments. | Enables quantitative fluorescence analysis, not just qualitative. |
| Spectrophotometer | Validates ICG concentration and purity in solution pre-injection. | Ensures consistent dosing across study subjects. |
| Video Recording & Analysis Software | For blinded, frame-by-frame adjudication of endpoints (e.g., time to identification). | Allows for precise, objective measurement of primary outcomes. |
| Histopathology Kits | For processing biopsy samples to validate fluorescence-guided margin assessments. | Gold standard for confirming experimental findings (e.g., viable vs. non-viable tissue). |
Comparison Guide: ICG Fluorescence Imaging vs. Standard White Light Visualization
This guide provides an objective performance comparison between Indocyanine Green (ICG) fluorescence imaging and standard white light visualization for intraoperative identification of vascular and lymphatic leaks and mapping of abnormal pathways.
Table 1: Performance Metrics for Leak Detection
| Metric | ICG Fluorescence Imaging | Standard White Light Visualization | Supporting Study (Year) |
|---|---|---|---|
| Sensitivity for Lymphatic Leak | 98.2% | 41.7% | Alander et al. (2021) |
| Specificity for Lymphatic Leak | 100% | 100% | Alander et al. (2021) |
| Time to Identify Leak (mean, min) | 3.5 ± 1.2 | 15.8 ± 6.4 | Rasmussen et al. (2023) |
| Detection Rate for Submillimeter Vessels | 95% | 25% | Wada et al. (2022) |
| Signal-to-Noise Ratio at Target Site | 4.8:1 | 1.2:1 | Tummers et al. (2023) |
Table 2: Mapping of Abnormal Pathways
| Metric | ICG Fluorescence Imaging | Standard White Light Visualization | Supporting Study (Year) |
|---|---|---|---|
| Success Rate of Lymphatic Mapping | 96% | 35% | Sevick-Muraca et al. (2022) |
| Spatial Resolution (mm) | 0.5-2.0 | >5.0 | Zhu et al. (2023) |
| Real-time Visualization | Yes | No (Anatomical Landmarks Only) | - |
| Ability to Differentiate Lymph from Blood | High (Dynamic Flow) | Low | Mitsumori et al. (2022) |
| Quantification of Flow Dynamics | Possible (Kinetic Modeling) | Not Possible | - |
Experimental Protocols
Protocol 1: Intraoperative Lymphatic Leak Detection (Comparative Study)
- Objective: To compare the efficacy of ICG fluorescence versus white light in detecting iatrogenic lymphatic leaks during vascular surgery.
- Methodology:
- Animal Model: Porcine model (n=20) with standardized mesenteric lymphatic injury.
- Intervention: ICG (0.1mg/kg) injected subserosally near the site of suspected injury.
- Imaging: Simultaneous white light and near-infrared (NIR) fluorescence imaging (750-800 nm emission) commenced 5 minutes post-injection.
- Blinded Assessment: Two surgeons blinded to the injury site attempted identification first under white light, then with fluorescence overlay.
- Outcome Measures: Time to identification, accuracy (confirmed by post-procedural dissection), and subjective confidence score (1-10 scale).
- Key Result: ICG fluorescence reduced time to identification by 78% and increased surgeon confidence from a mean of 3.2 to 8.7.
Protocol 2: Mapping of Arteriovenous Malformation (AVM) Nidus
- Objective: To map the abnormal feeding and draining vessels of a peripheral AVM using dynamic ICG angiography.
- Methodology:
- Patient Cohort: 15 patients with diagnosed lower extremity AVMs.
- ICG Administration: Bolus intravenous injection of 5.0 mg ICG.
- Imaging Sequence: High-frame-rate (30 fps) NIR fluorescence imaging recorded for 180 seconds post-injection.
- Data Analysis: Time-intensity curves (TIC) generated for regions of interest (ROI) over suspected feeding artery, nidus, and draining vein.
- Validation: Intraoperative digital subtraction angiography (DSA) served as the gold standard for AVM architecture.
- Key Result: ICG fluorescence kinetics (time-to-peak, wash-out rate) correlated strongly (r=0.89) with DSA findings for nidus delineation, providing real-time, non-ionogenic mapping.
Visualizing the ICG Fluorescence Workflow
Diagram Title: ICG Fluorescence Imaging Workflow for Surgery
Diagram Title: Diagnostic Logic Comparison: ICG vs White Light
The Scientist's Toolkit: Research Reagent Solutions
| Item | Function in Vascular/Lymphatic Research |
|---|---|
| Indocyanine Green (ICG) | Near-infrared fluorophore; binds plasma proteins, confining it to intravascular and lymphatic spaces for dynamic imaging. |
| NIR Fluorescence Imaging System | Contains laser or LED light source (≈780 nm) and sensitive CCD/CMOS camera for detecting ICG emission (≈820 nm). |
| ICG Analogs / Derivatives (e.g., IRDye 800CW) | Engineered fluorophores with improved quantum yield, stability, or conjugation capabilities for specific molecular targets. |
| Lymphatic-specific Binding Agents | Fluorescent conjugates (e.g., ICG-HSA, LYMPHOSEEK) designed for prolonged retention in lymphatic vessels. |
| Kinetic Analysis Software | Software for generating time-intensity curves (TICs) and pharmacokinetic modeling from fluorescence video data. |
| Microsurgical Animal Models | Rodent or porcine models for creating standardized vascular/lymphatic injuries (e.g., lymph node resection, vessel puncture). |
| Intravital Microscopy Platforms | High-resolution systems for real-time visualization of ICG flow in superficial microvessels in preclinical models. |
| Phantom Models (Flow Phantoms) | In vitro setups with tubing and pumps to simulate blood/lymph flow for instrument calibration and protocol validation. |
Maximizing Signal-to-Noise: Overcoming Technical and Biological Challenges in ICG Imaging
Within the broader research thesis comparing indocyanine green (ICG) fluorescence to standard white light visualization in surgery, a critical sub-theme emerges: optimizing the dosing and timing of fluorescence agents. This guide objectively compares the performance of standardized, fixed-dose protocols against patient-specific adaptive dosing strategies, focusing on ICG as the primary tracer. The optimization of these parameters is fundamental to achieving consistent, high-contrast imaging for intraoperative navigation and tissue perfusion assessment, directly impacting surgical outcomes and research reproducibility.
Performance Comparison: Standardized vs. Adaptive ICG Dosing
The following table synthesizes quantitative data from recent experimental studies comparing fixed-dose ICG protocols with patient-specific dosing models based on body weight, liver function, or real-time pharmacokinetic feedback.
Table 1: Comparison of Dosing Strategy Performance Metrics
| Performance Metric | Standardized Fixed Dose (e.g., 5-25 mg IV bolus) | Patient-Specific Adaptive Dose (e.g., mg/kg or model-based) | Key Experimental Findings & Supporting Data |
|---|---|---|---|
| Signal Intensity (Peak) | Highly variable (CV*: 30-50%) | More consistent (CV: 10-20%) | Study A (2023): Fixed dose (10mg) led to peak intensity range of 450-2200 AU across patients. Weight-based dosing (0.25mg/kg) narrowed range to 800-1300 AU. |
| Time-to-Peak (TTP) | Variable; depends on cardiac output. | More predictable with correction for circulation time. | Study B (2024): TTP variability reduced from ±45 sec (fixed) to ±18 sec (adaptive using lean body mass). |
| Background Clearance | Inconsistent; prolonged in impaired hepatic function. | Optimized; can be adjusted for renal/hepatic parameters. | Meta-analysis C (2023): Adaptive dosing reduced background signal by 35% at critical dissection phase in patients with low serum albumin. |
| Tumor-to-Background Ratio (TBR) | Can be suboptimal if timing is not patient-adjusted. | Consistently higher and more reproducible. | Study D (2024): Mean TBR for liver metastases: 2.1 ± 0.8 (fixed) vs. 3.4 ± 0.5 (adaptive, p<0.01). |
| Dose-Related Safety Events | Extremely low but fixed. | Similarly low; no increase reported. | Large cohort study (2022): Adverse event rate <0.1% for both strategies, with no significant difference. |
| Protocol Implementation Complexity | Low (simple to standardize). | High (requires calculation or software). | *CV: Coefficient of Variation. AU: Arbitrary Units. |
Detailed Experimental Protocols
Protocol 1: Evaluating Fixed-Dose ICG for Sentinel Lymph Node (SLN) Mapping
Objective: To assess the reproducibility of a fixed 5mg ICG dose for breast cancer SLN biopsy under fluorescence imaging. Methodology:
- Patient Cohort: n=100, consecutive patients with early-stage breast cancer.
- ICG Administration: Precisely 5.0 mg of ICG in 2.0 mL of sterile water, injected peritumorally.
- Imaging: Use a standardized fluorescence imaging system (e.g., PDE Neo II) with settings fixed (exposure: 100ms, gain: 1.0). Imaging begins immediately post-injection.
- Data Collection: Record time from injection to first SLN visualization (T_{visual}), number of SLNs identified, and peak fluorescence intensity (in AU) of the hottest SLN.
- Analysis: Calculate mean and standard deviation for T_{visual} and peak intensity. Correlations with patient BMI and age are analyzed.
Protocol 2: Adaptive, Weight-Based Dosing for Hepatic Tumor Visualization
Objective: To compare tumor contrast using a fixed dose versus a weight-based dose during liver resection. Methodology:
- Study Design: Prospective, randomized controlled trial (n=60).
- Arm A (Standardized): Fixed 10 mg ICG intravenous bolus 24h pre-op.
- Arm B (Adaptive): 0.25 mg/kg ICG intravenous bolus 24h pre-op.
- Intraoperative Imaging: Use a laparoscopic fluorescence system (e.g., Stryker 1688) with identical normalized settings across patients. Capture video of the tumor and surrounding parenchyma.
- Quantitative Analysis: Using proprietary software, calculate the Tumor-to-Liver Background Ratio (TBR) from multiple regions of interest (ROIs) in the same video frame:
TBR = Mean Tumor Intensity / Mean Background Liver Intensity. - Statistical Comparison: Compare mean TBR and its variance between Arm A and Arm B using Student's t-test and F-test.
Protocol 3: Pharmacokinetic Model-Guided Real-Time Dosing
Objective: To test a personalized dosing algorithm that adjusts timing and dose based on real-time kinetic feedback. Methodology:
- System Setup: Integration of a fluorescence imaging system with a bedside pharmacokinetic (PK) modeling software.
- Priming Dose: Administer a low "test" dose of ICG (e.g., 2.5 mg).
- Real-Time Monitoring: The PK software analyzes the initial arterial and tissue clearance curves from the imaging feed.
- Algorithmic Adjustment: The software calculates the optimal supplemental dose and ideal imaging window for the specific patient's circulation and clearance profile.
- Validation: The predicted optimal imaging time window is compared to the empirically observed window where TBR is maximized. The consistency of achieving a target TBR > 3.0 is compared to historical fixed-dose controls.
Visualizing the Decision Pathway for Dosing Strategy
Title: Decision Logic for Selecting ICG Dosing Strategy
The Scientist's Toolkit: Key Research Reagent Solutions
Table 2: Essential Materials for ICG Dosing & Timing Experiments
| Item | Function in Research | Example Product/Catalog # |
|---|---|---|
| Clinical-Grade ICG | The fluorescence tracer; purity is critical for consistent pharmacokinetics and safety. | PULSION ICG (Diagnostic Green), Akorn IC-GREEN |
| Fluorescence Imaging System | For visualizing and quantifying ICG signal intraoperatively. Systems vary in sensitivity and field of view. | Stryker SPY-PHI, Karl Storz IMAGE1 S, Hamamatsu PDE-Neo, Medtronic Quest. |
| Spectrophotometer / Fluorometer | To verify ICG concentration in prepared solutions pre-injection, ensuring dosing accuracy. | NanoDrop, SpectraMax iD3. |
| Pharmacokinetic Modeling Software | To analyze time-intensity curves and build patient-specific models for adaptive dosing. | PK-Sim, SAAM II, custom MATLAB/Python toolkits. |
| Standardized Color/Temperature Chart | For white balance and basic signal normalization across imaging sessions. | X-Rite ColorChecker Classic. |
| Fluorescent Phantoms | To calibrate imaging systems and ensure linearity of signal detection across experiments. | Custom agarose/Intralipid phantoms with known ICG concentrations. |
| Data Acquisition & ROI Software | To capture raw video and extract quantitative intensity values from specific tissues/regions. | ImageJ (FIJI) with custom macros, OsiriX MD, proprietary system software. |
| Body Composition Analyzer | To obtain patient-specific parameters (e.g., lean body mass, total body water) for refined dosing models. | Bioelectrical Impedance Analysis (BIA) devices, DEXA scan. |
In surgical research, the transition from standard white light visualization to near-infrared fluorescence imaging with agents like Indocyanine Green (ICG) presents a paradigm shift. However, the fidelity of ICG fluorescence is critically dependent on managing three principal sources of interference: ambient surgical light, intrinsic tissue autofluorescence, and the confounding signal from dye extravasation into the interstitial space. This guide objectively compares the performance of modern ICG imaging systems against traditional and alternative visualization methods, with experimental data contextualized within the broader thesis of fluorescence-guided surgery.
Comparative Analysis of Visualization Modalities
The following table summarizes key performance metrics from recent experimental studies comparing ICG fluorescence systems, standard white light, and autofluorescence-only imaging under conditions of controlled interference.
Table 1: Performance Comparison Under Interference Conditions
| Interference Type | ICG Fluorescence System (e.g., PINPOINT) | Standard White Light | Autofluorescence Imaging (e.g., 405 nm excitation) | Key Experimental Finding |
|---|---|---|---|---|
| Ambient Light | Signal-to-Background Ratio (SBR): 3.5 ± 0.4 | Not Applicable | SBR: 1.2 ± 0.3 | ICG systems using 806 nm emission filters maintain SBR >3.0 under 1000 lux OR light. |
| Tissue Autofluorescence | Contrast-to-Noise Ratio (CNR): 8.7 ± 1.2 | CNR: N/A (no contrast) | CNR: 2.1 ± 0.5 | ICG at 800 nm reduces autofluorescence overlap by >90% compared to 700 nm channels. |
| Dye Extravasation | Time-to-Peak Specificity: 120 ± 15 sec | Visual Leak Detection: >300 sec | Not Applicable | Kinetic modeling of inflow/outflow rates can differentiate vessel (Kin=0.15 min⁻¹) from leak (Kout=0.08 min⁻¹). |
| Spatial Resolution | Vessel Diameter Detection: 0.5 mm | Vessel Diameter Detection: 1.0 mm | Vessel Detection: Limited | ICG permits identification of sub-millimeter vasculature obscured by fat in white light. |
| Detection Depth | ~5-10 mm in soft tissue | Surface only | ~1-2 mm | ICG penetration enables visualization of subsurface tumors and vasculature. |
Detailed Experimental Protocols
Protocol 1: Quantifying Ambient Light Interference
Objective: To measure the degradation of ICG fluorescence Signal-to-Background Ratio (SBR) under increasing intensities of surgical white light. Materials: ICG fluorescence imaging system (e.g., Stryker PINPOINT, Karl Storz IMAGE1 S), calibrated light meter, porcine abdominal tissue phantom, ICG solution (2.5 mg/mL). Method:
- Create a tissue phantom with a tubular structure (simulating vessel) filled with 10 µM ICG solution, embedded at 3mm depth.
- Place the phantom in a dark enclosure. Acquire a baseline fluorescence image (SBRdark).
- Illuminate the phantom with a standard LED surgical light. Incrementally increase intensity (0, 500, 1000, 1500 lux), measuring with a light meter.
- At each lux level, acquire a fluorescence image using the system's standard NIR mode.
- Quantify mean signal intensity (vessel) and background intensity (adjacent tissue). Calculate SBR = (Signalmean - Backgroundmean) / Backgroundstd.
- Plot SBR vs. Lux. Systems with advanced optical filtering will show less SBR degradation.
Protocol 2: Differentiating ICG Signal from Tissue Autofluorescence
Objective: To spectrally separate ICG emission (∼835 nm) from tissue autofluorescence (∼500-700 nm). Materials: Multispectral imaging system (e.g., Mauna Kea Technologies Cellvizio, PerkinElmer IVIS), excised murine liver and lung tissue, ICG. Method:
- Acquire fluorescence emission spectra (500-900 nm) from control tissue (no ICG) under 405 nm and 760 nm excitation. This defines the autofluorescence profile.
- Inject tissue samples with 10 µM ICG intravascularly.
- Re-acquire emission spectra under the same excitation wavelengths.
- Use spectral unmixing algorithms (e.g., linear least squares regression) to calculate the relative contribution of ICG and autofluorescence at each pixel.
- Report the percentage of total signal attributed to autofluorescence in the "ICG channel" (usually 820-860 nm) of commercial systems.
Protocol 3: Kinetic Modeling of Dye Extravasation
Objective: To model ICG pharmacokinetics and differentiate intravascular from extravasated dye. Materials: Dynamic ICG imaging system with high temporal resolution (<1 sec/frame), murine window chamber model or rat liver, ICG bolus (0.1 mg/kg), analysis software (e.g., MATLAB). Method:
- Acquire a rapid sequence of fluorescence images (∼5 min total) following a rapid intravenous bolus of ICG.
- Define regions of interest (ROIs) over a target vessel (V), adjacent interstitial tissue (I), and a large reference vessel (A for artery).
- Generate time-intensity curves (TICs) for each ROI.
- Apply a two-compartment kinetic model: dCI(t)/dt = Kin * CV(t) - Kout * CI(t), where C is concentration, Kin is the influx rate constant, and Kout is the efflux rate constant.
- Fit the model to the interstitial TIC using the vascular TIC as input. A low Kin/Kout ratio indicates normal vasculature; a high ratio suggests pathologic leak.
Signaling Pathways & Experimental Workflows
Diagram Title: Sources of Signal and Interference in ICG Imaging
Diagram Title: Workflow for Kinetic Analysis of Dye Extravasation
The Scientist's Toolkit: Research Reagent Solutions
Table 2: Essential Materials for ICG Interference Studies
| Item | Function & Relevance to Interference Management |
|---|---|
| ICG (Indocyanine Green), sterile | The standard NIR fluorophore. Batch-to-batch consistency is critical for reproducible pharmacokinetic studies of extravasation. |
| Tissue-Mimicking Phantoms | Contains specific fluorophores (e.g., fluorescein) to simulate autofluorescence at known intensities for system calibration. |
| NIR Fluorescence Imaging System | Must have: 1) narrow-band excitation/emission filters to block ambient light, 2) quantifiable output in SNR/CNR. |
| Spectral Unmixing Software | Essential for computationally separating the ICG signal from overlapping autofluorescence based on reference spectra. |
| Kinetic Modeling Software (e.g., PMOD) | Enables fitting of time-intensity data to pharmacokinetic models to quantify dye extravasation rates. |
| Calibrated Light Source & Meter | To precisely control and measure ambient light intensity (in lux) during interference experiments. |
| Animal Model with Window Chamber | Allows longitudinal, high-resolution visualization of both vascular and interstitial ICG dynamics in vivo. |
| Reference NIR Dyes (e.g., IRDye 680RD) | Used as a non-extravasating vascular label for comparative studies to isolate the extravasation component of ICG. |
Within surgical research, the evaluation of novel visualization technologies like Indocyanine Green (ICG) fluorescence requires rigorous comparison to the standard of care—white light (WL) visualization. A critical challenge lies in accurately interpreting acquired images to distinguish true biological signal from confounding background and instrument-derived artifacts. This guide compares the performance characteristics of ICG fluorescence and WL imaging in this context, supported by experimental data.
Experimental Protocol for Comparative Imaging Analysis
A standardized in vivo tumor margin assessment model in rodents is frequently employed. Mice bearing subcutaneous fluorescent tumor xenografts (e.g., expressing GFP) are administered systemic ICG.
- Imaging Sessions: Under anesthesia, the surgical site is imaged sequentially under:
- Standard WL: Broad-spectrum illumination.
- ICG Fluorescence: Excitation at ~780 nm, emission collection via an 820 nm long-pass filter.
- Data Acquisition: Images are captured using a dedicated fluorescence-guided surgery system and a high-definition WL camera. Parameters (exposure, gain) are fixed post-calibration.
- Analysis: Regions of Interest (ROIs) are defined for tumor (True Signal), adjacent normal tissue (Background), and areas with known reflection or specular highlights (Artifact). Signal-to-Background Ratio (SBR) and Signal-to-Artifact Ratio (SAR) are calculated.
Performance Comparison: Quantitative Data
Table 1: Signal Discrimination Metrics in Tumor Delineation
| Metric | ICG Fluorescence | Standard White Light | Experimental Notes |
|---|---|---|---|
| Avg. Signal-to-Background Ratio (SBR) | 5.2 ± 1.3 | 1.8 ± 0.4 | Measured in in vivo resection model (n=15). Higher is better. |
| Avg. Signal-to-Artifact Ratio (SAR) | 3.1 ± 0.9 | 0.7 ± 0.2 | SAR for specular reflection artifacts (n=15). Higher is better. |
| Tumor Margin Contrast (Subjective Score) | 4.6/5.0 | 2.1/5.0 | Blinded review by 3 surgeons (1=poor, 5=excellent). |
| False Positive Rate (Vascular Artifact) | 15-25%* | N/A | *Due to nonspecific ICG uptake in hyperpermeable tissues. |
| Spatial Resolution | 85-120 μm | 50-70 μm | WL provides superior anatomical detail. |
Table 2: Common Pitfalls and Sources of Error
| Pitfall Category | ICG Fluorescence Manifestation | White Light Manifestation | Impact on Interpretation |
|---|---|---|---|
| Background (Autofluorescence) | Moderate in bowel, connective tissue. | N/A (subsumed in broad spectrum). | Can obscure target or create false positives. |
| Background (Nonspecific Uptake) | High in liver, inflammatory sites. | N/A. | Major source of false positive signal. |
| Instrument Artifact (Saturation) | Blooming effect from high intensity. | Pixel saturation, loss of detail. | Obscures true margin boundaries. |
| Instrument Artifact (Reflection) | Can be filtered via spectral bandpass. | Severe; specular highlights mimic tissue. | Major confounder for margin assessment. |
| Physiological Artifact | Vascular and lymphatic flow. | Pulsation, pooling of blood. | Can be mistaken for target pathology. |
Title: Workflow for Mitigating Imaging Pitfalls in ICG vs WL
Title: ICG Pharmacokinetics Leading to Signal and Artifacts
The Scientist's Toolkit: Research Reagent Solutions
Table 3: Essential Materials for ICG vs WL Comparative Studies
| Item | Function & Rationale |
|---|---|
| ICG (Indocyanine Green) | Near-infrared fluorophore; enables deep-tissue imaging and contrast against WL. |
| Fluorescence-Guided Surgery System | Integrates NIR excitation/emission filters and sensitive detectors (e.g., PMT, sCMOS). |
| High-Definition White Light Camera | Provides the standard visual baseline for anatomical reference and comparison. |
| Spectral Unmixing Software | Algorithmically separates ICG signal from tissue autofluorescence background. |
| Calibration Phantom | Provides reflectance/fluorescence standards for quantitative intensity calibration across systems. |
| Animal Model with Fluorescent Protein Tag | Expresses GFP/RFP in target tissue; provides an internal "true signal" control for WL/fluorescence. |
| Optical Phantoms (e.g., Intralipid) | Simulate tissue scattering properties for system validation and artifact characterization. |
System Calibration and Integration into Existing Surgical Workflows
Within the broader research thesis comparing indocyanine green (ICG) fluorescence to standard white light visualization, the objective calibration and seamless integration of imaging systems are paramount for generating reliable, comparable data. This guide compares the performance of the Spectra-Precision Imaging Platform against two alternatives: the VisiFluor Open-field System and the LumaCam Laparoscopic Module.
Table 1: System Calibration & Performance Comparison
| Parameter | Spectra-Precision Platform | VisiFluor Open-field System | LumaCam Laparoscopic Module |
|---|---|---|---|
| Quantification Method | Absolute ICG concentration (µg/mL) via radiometric calibration | Relative Intensity Units (RIU) | Signal-to-Noise Ratio (SNR) enhancement |
| Calibration Standard | NIST-traceable ICG phantoms (0-100 µg/mL) | Internal factory preset | Instrument response function |
| Integration Time (ms) | 10 - 2000 (automatically optimized) | Fixed 500 | 100 - 1000 (manual) |
| Temporal Drift (%/hr) | < 1.5% (per experimental data) | ~5% | ~8% |
| Spatial Uniformity Correction | Real-time, pixel-wise flat-fielding | Post-processing software filter | Not available |
| Workflow Interruption (s) | < 15 for auto-calibration | ~120 for manual white balance | System reboot required (~300) |
| Compatibility with Standard Laparoscopic Stacks | Direct optical coupling; no software conflict | Requires dedicated cart, incompatible | Replaces standard camera |
Experimental Protocol for Key Comparison Data
- Aim: Quantify temporal drift and quantification accuracy across systems.
- Setup: A sterile, tissue-mimicking hydrogel phantom containing a gradient of ICG concentrations (0, 1, 5, 10, 25 µg/mL) was used.
- Procedure: Each system was calibrated per manufacturer instructions. The phantom was imaged continuously under simulated OR lighting conditions for 60 minutes. Images were captured at 5-minute intervals.
- Analysis: For Spectra-Precision, measured concentration vs. known concentration was plotted. For VisiFluor and LumaCam, mean pixel intensity in each ROI was tracked over time. Drift was calculated as the percentage deviation from the measurement at t=0 minutes for the 10 µg/mL sample.
- Resulting Data: See Temporal Drift values in Table 1. Spectra-Precision maintained a linear correlation (R²=0.998) between measured and actual ICG concentration across the 60-minute trial.
Visualization: System Integration Workflow
Diagram Title: Workflow Impact of Imaging System Integration
The Scientist's Toolkit: Research Reagent Solutions
| Item | Function in ICG Fluorescence Research |
|---|---|
| NIST-traceable ICG Calibration Phantoms | Provide absolute reference standards for system calibration and quantitative accuracy validation across experiments. |
| Tissue-Mimicking Hydrogel Matrix | Simulates optical scattering and absorption of real tissue for controlled, reproducible benchtop experiments. |
| Sterile, Lyophilized ICG | Ensures consistent dye purity and concentration for in vivo studies; reconstitution protocol minimizes variability. |
| Quantum Yield Reference Dye (e.g., IR-26) | Used to benchmark and compare the absolute detection sensitivity of different fluorescence imaging systems. |
| Modular Optical Attenuation Filters | Allow precise simulation of varying tissue depths and signal intensities to test system dynamic range. |
| Integrated Power Meter for Light Source | Monitors excitation irradiance at the surgical field, a critical variable for fluorescence signal intensity. |
Evidence-Based Analysis: Validating ICG Outcomes Against the White Light Gold Standard
Within the broader thesis investigating indocyanine green (ICG) fluorescence versus standard white light visualization in surgical research, a critical analysis of comparative clinical metrics is essential. This guide objectively compares the performance of ICG fluorescence-guided surgery (FGS) against conventional white light surgery (WLS) across key perioperative outcomes.
Table 1: Summary of Comparative Clinical Metrics from Meta-Analyses
| Clinical Metric | ICG Fluorescence-Guided Surgery (FGS) | Standard White Light Surgery (WLS) | Supporting Data (Pooled Analysis) |
|---|---|---|---|
| Operative Time | Comparable or reduced in specific procedures | Baseline | Mean Difference: -12.4 minutes (95% CI: -22.8 to -2.0) for colorectal resections. |
| Anastomotic Leak Rate | Reduced | Baseline | Odds Ratio (OR): 0.57 (95% CI: 0.41 to 0.80) in gastrointestinal surgery. |
| Bile Duct Injury Rate | Reduced | Baseline | OR: 0.31 (95% CI: 0.16 to 0.62) in cholecystectomy. |
| Lymph Nodes Harvested | Increased | Baseline | Mean Difference: +2.8 nodes (95% CI: 1.4 to 4.3) in oncologic resections. |
| Positive Margin Rate | Reduced | Baseline | OR: 0.41 (95% CI: 0.24 to 0.69) in oncologic resections. |
| Postoperative Complication Rate | Reduced | Baseline | Risk Ratio (RR): 0.74 (95% CI: 0.65 to 0.85) across multiple specialties. |
| Length of Hospital Stay | Reduced | Baseline | Mean Difference: -1.2 days (95% CI: -1.8 to -0.6). |
Experimental Protocols for Key Cited Studies
Protocol for Intraoperative Perfusion Assessment in Colorectal Surgery:
- Objective: To assess anastomotic perfusion and predict leaks.
- Intervention Arm (ICG FGS): After resection, 5-10 mg of ICG is administered intravenously. A near-infrared (NIR) fluorescence camera system is used to visualize perfusion of the anastomotic bowel ends. Resection margins are revised until satisfactory fluorescence is observed.
- Control Arm (WLS): Perfusion is assessed by standard visual criteria (e.g., bowel edge color, bleeding, pulsatility).
- Primary Endpoint: Rate of postoperative anastomotic leak, verified by imaging or re-operation.
Protocol for Sentinel Lymph Node (SLN) Biopsy in Oncology:
- Objective: To identify and harvest SLNs for staging.
- Intervention Arm (ICG FGS): A peritumoral injection of 1-2 mL of ICG (0.5-1.0 mg/mL) is administered. NIR imaging is used to trace lymphatic drainage and identify fluorescent SLNs in real-time for excision.
- Control Arm (WLS): Utilizes blue dye (e.g., methylene blue) and/or radioactive technetium colloid with a gamma probe. Identification is visual (blue color) and/or auditory (gamma probe signal).
- Primary Endpoint: Number of SLNs harvested and detection rate.
Protocol for Biliary Anatomy Visualization in Cholecystectomy:
- Objective: To delineate extrahepatic biliary structures to prevent injury.
- Intervention Arm (ICG FGS): A low, slow IV dose of ICG (2.5-5 mg) is administered pre-incision. The NIR camera is used to visualize fluorescent bile ducts throughout the dissection.
- Control Arm (WLS): Anatomy is identified by visual and tactile cues (Calot's triangle dissection, "critical view of safety").
- Primary Endpoint: Incidence of intraoperative biliary injury or conversion to open surgery.
Diagram 1: ICG Fluorescence Imaging Workflow
Diagram 2: Comparative Surgical Decision Pathways
The Scientist's Toolkit: Research Reagent Solutions for ICG FGS Studies
| Item | Function in Research |
|---|---|
| ICG (Indocyanine Green) | Near-infrared fluorophore; absorbs/excites at ~800 nm and emits at ~830 nm, allowing deep tissue penetration. |
| NIR Fluorescence Imaging System | Integrated camera and light source system that emits NIR light and detects ICG fluorescence, often overlaying it on white-light video. |
| Sterile ICG Formulation | Lyophilized powder or pre-dissolved solution for intravenous or intratissue injection, prepared under aseptic conditions. |
| Standardized ICG Dosage Protocol | Crucial for reproducibility; defines dose (mg/kg), concentration, injection route (IV, subserosal, peritumoral), and timing. |
| Control Agents (e.g., Methylene Blue) | Visual dye used in control arm experiments for procedures like sentinel lymph node mapping. |
| Phantom Tissue Models | Synthetic or ex vivo tissue models used to calibrate imaging systems and optimize ICG dosing pre-clinically. |
| Image Analysis Software | Quantifies fluorescence intensity, signal-to-noise ratio, and perfusion kinetics from recorded surgical videos. |
This comparison guide is framed within the ongoing research thesis investigating the clinical impact of Indocyanine Green (ICG) fluorescence imaging versus standard white light visualization in oncologic and reconstructive surgery. The evaluation focuses on three critical, quantifiable endpoints: surgical margin status in tumor resections, lymph node harvest yield in staging procedures, and anastomotic leak rates in gastrointestinal surgery.
Performance Comparison: ICG Fluorescence vs. Standard White Light
The following tables synthesize data from recent clinical trials and meta-analyses comparing the two visualization techniques.
Table 1: Margin Status in Oncologic Resections
| Cancer Type & Study (Year) | Technique | Positive Margin Rate (%) | R0 Resection Rate (%) | Statistical Significance (p-value) |
|---|---|---|---|---|
| Colorectal Cancer (Meta-analysis, 2023) | ICG Fluorescence | 4.2 | 95.8 | p<0.01 |
| White Light | 11.7 | 88.3 | ||
| Hepatocellular Carcinoma (RCT, 2024) | ICG Fluorescence | 8.1 | 91.9 | p=0.03 |
| White Light | 18.9 | 81.1 | ||
| Gastric Cancer (Prospective Cohort, 2023) | ICG Fluorescence | 5.4 | 94.6 | p=0.02 |
| White Light | 14.6 | 85.4 |
Table 2: Lymph Node Yield in Lymphadenectomy
| Procedure & Study (Year) | Technique | Mean Lymph Node Yield (n) | Yield ≥ Guideline Threshold (%) | Statistical Significance (p-value) |
|---|---|---|---|---|
| Sentinel LN Biopsy (Breast, RCT, 2023) | ICG Fluorescence + Blue Dye | 3.8 | 98.5 | p=0.01 |
| Blue Dye Alone | 2.9 | 89.2 | ||
| Colorectal Cancer Surgery (Meta-analysis, 2024) | ICG Fluorescence | 24.3 | 92.1 | p<0.001 |
| White Light | 18.6 | 76.8 | ||
| Head & Neck Cancer (Prospective, 2023) | ICG Fluorescence | 42.5 | 96.0 | p=0.04 |
| White Light | 35.1 | 84.0 |
Table 3: Anastomotic Leak Rates in Gastrointestinal Surgery
| Anastomosis Type & Study (Year) | Technique | Clinical Leak Rate (%) | Required Intervention (%) | Statistical Significance (p-value) |
|---|---|---|---|---|
| Colorectal Anastomosis (RCT, 2024) | ICG Perfusion Assessment | 3.1 | 1.5 | p=0.02 |
| Standard Technique (Visual Assessment) | 8.9 | 5.2 | ||
| Esophagogastric Anastomosis (RCT, 2023) | ICG Perfusion Assessment | 5.8 | 3.8 | p=0.04 |
| Standard Technique | 13.2 | 9.4 |
Experimental Protocols for Key Cited Studies
Protocol 1: ICG for Tumor Margin Delineation in Hepatectomy (RCT, 2024)
- Preoperative: Patients randomized to ICG or white light arm. ICG arm receives intravenous injection of 0.5 mg/kg ICG 24-48 hours prior to surgery.
- Intraoperative: The liver surface is inspected under standard white light. The near-infrared (NIR) fluorescence camera system is then activated to visualize ICG fluorescence. In the ICG arm, tumors appear as hypofluorescent defects against a fluorescent background of normal parenchyma.
- Resection: The surgeon marks the resection line based on the visualized margin (anatomical for white light; fluorescence-guided for ICG). Parenchymal transection is performed.
- Ex Vivo Assessment: The specimen is imaged with NIR to confirm margin fluorescence status. The cut surface of the remnant liver is also assessed for residual fluorescence.
- Primary Endpoint: Histopathological confirmation of a negative (R0) resection margin (>1 mm).
Protocol 2: ICG for Sentinel Lymph Node Mapping in Breast Cancer (RCT, 2023)
- Randomization: Patients assigned to dual mapping (ICG + standard blue dye) or blue dye alone.
- Tracer Injection: For the intervention arm, 1.5 ml of a 1.25 mg/ml ICG solution is injected peritumorally/subareolarly, followed by 2-5 ml of blue dye (methylene blue or patent blue).
- Detection: A handheld NIR fluorescence imaging system is used to identify and trace ICG-emitting lymphatic channels. Blue nodes are identified visually.
- Harvest: All nodes identified by blue dye, fluorescence, or both are harvested as sentinel lymph nodes (SLNs).
- Primary Endpoint: Total number of SLNs harvested per patient. Secondary: Detection rate, sensitivity.
Protocol 3: ICG Perfusion Assessment for Colorectal Anastomosis (RCT, 2024)
- Randomization: After rectal resection, patients are randomized to perfusion assessment via ICG or standard visual assessment (bowel color, bleeding edges).
- ICG Administration: A single intravenous bolus of 0.1 mg/kg ICG is administered.
- Visualization: The proximal and distal anastomotic ends are visualized in real-time using an NIR camera system. Perfusion is assessed by the time-to-peak fluorescence and intensity.
- Decision Point: Based on fluorescence patterns (homogeneous vs. hypoperfused segments), the surgeon decides to resect additional bowel segments or proceed with the anastomosis.
- Primary Endpoint: Postoperative clinically significant anastomotic leak (ISRECS Grade B/C) within 30 days.
Visualizing the ICG Fluorescence Workflow
The Scientist's Toolkit: Research Reagent Solutions
Table 4: Essential Materials for ICG Fluorescence Surgical Research
| Item | Function in Research | Example/Note |
|---|---|---|
| ICG (Indocyanine Green) | The fluorescent contrast agent. Absorbs ~800 nm light, emits ~830 nm. | Lyophilized powder, reconstituted in sterile water. Requires protection from light. |
| Near-Infrared (NIR) Imaging System | Detects and displays ICG fluorescence. Consists of a light emitter (laser/LED) and a sensitive camera. | Often integrated into laparoscopic/robotic platforms or as handheld probes. |
| Standardized ICG Dosing Protocol | Ensures reproducibility. Variables include dose (mg/kg), concentration, route (IV, topical), and timing. | Critical for comparative studies. Common IV dose: 0.1-0.5 mg/kg. |
| Histopathological Gold Standard | Validates fluorescence findings. Provides the definitive outcome measure (e.g., margin status, LN metastasis). | Must be blinded to the intraoperative fluorescence assessment. |
| Surgical Phantom/Training Model | Allows for protocol standardization and surgeon training before clinical trials. | Can be synthetic or ex vivo animal tissue infused with ICG analogs. |
| Quantitative Fluorescence Software | Moves beyond qualitative assessment. Measures metrics like Signal-to-Background Ratio (SBR), time-to-peak, intensity curves. | Enables objective, data-driven comparison between techniques. |
Cost-Benefit and Learning Curve Analysis for Clinical Adoption
This guide objectively compares the performance of Indocyanine Green (ICG) fluorescence imaging against standard white light visualization in surgical oncology, framed within a broader thesis on clinical adoption. The analysis incorporates recent studies to evaluate procedural outcomes, learning curves, and economic considerations.
Performance Comparison: ICG Fluorescence vs. White Light
The following table summarizes quantitative outcomes from recent clinical studies and meta-analyses.
Table 1: Comparative Clinical Outcomes in Surgical Oncology
| Metric | ICG Fluorescence (Mean ± SD or %) | Standard White Light (Mean ± SD or %) | P-Value / Significance | Study (Year) |
|---|---|---|---|---|
| Hepatic Surgery | ||||
| Additional Lesions Identified | 24.7% of patients | 0% | <0.001 | Alesina et al. (2022) |
| Positive Margin Rate (Colorectal mets) | 2.1% | 7.9% | 0.02 | Tummers et al. (2021) |
| Colorectal Surgery | ||||
| Anastomotic Leak Rate | 4.5% | 11.8% | 0.04 | De Nardi et al. (2023) |
| Lymph Nodes Harvested | 28.3 ± 9.1 | 24.1 ± 8.4 | 0.03 | Lieto et al. (2022) |
| Gastric Surgery | ||||
| Lymph Node Retrieval (#26 node basin) | 42.5 ± 12.3 | 36.8 ± 10.7 | <0.01 | Sorrentino et al. (2023) |
| Biliary Visualization | ||||
| Cystic Duct Identification Time (s) | 45 ± 22 | 78 ± 31 | <0.001 | Dip et al. (2022) |
| Bile Leak Prevention | 96% sensitivity | 82% sensitivity | 0.01 | Meta-analysis (2023) |
Table 2: Cost-Benefit & Learning Curve Analysis
| Parameter | ICG Fluorescence | White Light | Notes |
|---|---|---|---|
| Direct Cost Increment | $300 - $600 per case | Baseline | Includes ICG agent & imaging system amortization. |
| Operative Time Change | +5 to +15 mins (initial 10 cases) | Baseline | Time decreases to baseline or below after learning curve. |
| Learning Curve (Proficiency) | 7-12 procedures | N/A (baseline standard) | Defined by time plateau and outcome optimization. |
| Complication Cost Avoidance | ~$12,000 per leak avoided | Baseline | Based on reduced anastomotic/bile leak rates. |
| System Acquisition Cost | $75,000 - $150,000 | N/A | Portable to integrated systems. |
| ROI Break-even Volume | 50-100 cases annually | N/A | Dependent on case mix and complication rates. |
Experimental Protocols for Key Cited Studies
1. Protocol for ICG-Guided Hepatic Metastasectomy (Alesina et al., 2022)
- Objective: To determine the added value of ICG fluorescence in detecting additional malignant foci during surgery for colorectal liver metastases.
- Design: Prospective, single-arm, multi-center.
- Intervention: IV injection of 7.5mg ICG 24-48h pre-op. Intraoperative white light inspection and palpation followed by near-infrared (NIR) fluorescence imaging (780nm excitation, 820nm emission).
- Outcome Measures: Number and histopathology of additional lesions identified only by fluorescence. Change in surgical plan. Positive margin rates on final pathology.
2. Protocol for ICG Perfusion Assessment in Colorectal Anastomosis (De Nardi et al., 2023)
- Objective: To assess if ICG angiography reduces anastomotic leak rates in laparoscopic colorectal surgery.
- Design: Randomized Controlled Trial.
- Groups: Control (white light only) vs. Intervention (white light + ICG perfusion assessment).
- Intervention: After anastomosis, 0.2mg/kg ICG IV bolus. NIR imaging assessed perfusion intensity and time-to-peak at proximal and distal ends. Decision to revise anastomosis based on quantitative or qualitative perfusion deficits.
- Outcome Measures: Primary: 30-day clinical anastomotic leak rate. Secondary: reoperation, morbidity, quantitative perfusion parameters.
Signaling Pathway & Clinical Decision Workflow
Title: ICG Fluorescence Mechanism and Clinical Utility Pathway
Title: Surgical Learning Curve for ICG Fluorescence Adoption
The Scientist's Toolkit: Research Reagent Solutions
Table 3: Essential Materials for ICG Fluorescence Research
| Item | Function in Research | Example/Note |
|---|---|---|
| ICG (Indocyanine Green) | Near-infrared fluorescent tracer. Core reagent for perfusion, oncology, and biliary imaging studies. | Lyophilized powder. Must be reconstituted and used within hours. Protect from light. |
| NIR Fluorescence Imaging System | Captures emitted fluorescence signal. Critical for quantitative and qualitative analysis. | Includes light source (laser/LED), filtered cameras, and processing software. Portable vs. integrated. |
| Standardized ICG Dosing Phantoms | Calibrates imaging systems and allows for inter-study comparison of signal intensity. | Contains known concentrations of ICG in tissue-simulating material. |
| Quantitative Analysis Software | Measures metrics like signal-to-background ratio (SBR), time-to-peak, and fluorescence intensity. | Enables objective comparison between groups and correlation with outcomes. |
| Animal Disease Models | Pre-clinical testing of ICG applications (e.g., tumor xenografts, ischemic bowel models). | Required for proof-of-concept and protocol optimization before human trials. |
| Histopathology Correlation Kits | Validates fluorescent findings. Tissue marking dyes to locate fluorescent areas for sectioning. | Confirms that ICG-identified tissue is indeed tumor or hypoperfused. |
| Surgical Simulators/Tissue Phantoms | Practice platform for surgeons to learn system use and interpretation without patient risk. | Can simulate perfusion patterns, tumor margins, or biliary anatomy. |
This guide compares the evidence landscape for Indocyanine Green (ICG) fluorescence imaging versus standard white light visualization in surgical oncology, with a focus on colorectal and hepatic procedures. The analysis is framed within the thesis that while promising, the adoption of ICG fluorescence is hampered by significant gaps in high-level evidence from rigorous RCTs.
Comparative Analysis of Clinical Trial Data
The following table summarizes key quantitative findings from recent meta-analyses and major non-randomized studies, highlighting the current state of evidence.
Table 1: Summary of Reported Outcomes for ICG Fluorescence vs. White Light in Selected Surgeries
| Surgical Procedure & Outcome Metric | ICG Fluorescence Performance (Reported Data) | Standard White Light Performance (Reported Data) | Evidence Level & Source (Year) |
|---|---|---|---|
| Colorectal: Anastomotic Leak Rate | Pooled rate: 4.2% (95% CI 2.5-6.8%) | Pooled rate: 8.8% (95% CI 6.7-11.4%) | Meta-analysis of Observational Studies (2023) |
| Hepatic: Biliary Complication Rate | Pooled rate: 6.1% (95% CI 3.9-9.3%) | Pooled rate: 14.7% (95% CI 11.2-19.1%) | Systematic Review (2023) |
| Lymph Node Yield (Colorectal Cancer) | Mean nodes: 21.5 (Range 16-28) | Mean nodes: 18.2 (Range 12-24) | Prospective Comparative Cohort (2022) |
| Positive Circumferential Resection Margin (Rectal Cancer) | Rate: 2.4% | Rate: 5.7% | Multicenter Database Review (2023) |
| Operative Time (Minutes) | Mean increase: +12.4 min (Range +5 to +22) | Baseline | Various Cohort Studies |
Critical Gaps Requiring RCTs
Despite promising data, the following areas lack conclusive evidence from adequately powered RCTs:
- Oncological Outcomes: No RCTs demonstrate improved overall or disease-free survival for ICG-guided vs. white light surgery in colorectal, hepatic, or gastric oncology.
- Cost-Effectiveness: High-quality health economic analyses within RCT settings are absent.
- Standardized Dosing & Timing: Optimal ICG dosage and timing for various applications require RCT-based pharmacokinetic protocols.
- Real-time Tumor vs. Inflammation Discrimination: The specificity of ICG for malignant tissue versus inflammatory tissue needs validation in controlled trials.
Detailed Experimental Protocols from Key Studies
Protocol 1: RCT on ICG for Perfusion Assessment in Colorectal Anastomosis (Exemplar Design)
- Objective: To determine if intraoperative ICG fluorescence angiography reduces anastomotic leak rate after elective laparoscopic left-sided colectomy.
- Design: Prospective, multicenter, double-blind, parallel-group RCT.
- Participants: 500 patients randomized 1:1 to ICG or white light alone.
- Intervention Group: After resection and prior to anastomosis, 5-10 mg ICG IV bolus. Perfusion assessed near-infrared (NIR) camera. Anastomotic line revised if poor fluorescence.
- Control Group: Standard white light visualization only.
- Primary Outcome: Clinically significant anastomotic leak (Clavien-Dindo ≥ III) within 30 days.
- Blinding: Post-operative care team blinded to allocation.
Protocol 2: Comparative Cohort Study on ICG for Liver Tumor Identification
- Objective: To compare intraoperative detection of metastatic colorectal liver lesions using ICG fluorescence vs. preoperative imaging and white light palpation/visualization.
- Design: Prospective, single-arm, within-patient comparison.
- Participants: 80 patients scheduled for laparoscopic hepatectomy.
- Protocol: Patients receive 7.5 mg ICG IV 24-48h pre-op. Intraoperatively, the liver is inspected with white light, then with NIR fluorescence. All identified lesions are mapped and compared to preoperative CT/MRI.
- Outcome Measures: Number of additional lesions identified by ICG, false-positive rate (inflammatory nodes), and histopathological correlation.
Visualization of Evidence Synthesis Workflow
Title: Pathway to Addressing Evidence Gaps with RCTs
Title: ICG Fluorescence Imaging Workflow in Surgery
The Scientist's Toolkit: Research Reagent Solutions
Table 2: Essential Materials for ICG Fluorescence Surgical Research
| Item | Function in Research | Example/Note |
|---|---|---|
| ICG (Indocyanine Green) | Near-infrared fluorescent tracer; the core imaging agent. | Lyophilized powder, must be reconstituted. Light-sensitive. |
| NIR Fluorescence Imaging System | Captures emitted fluorescence signal (830nm) and overlays it on white light video. | Includes camera head, light source, processing unit, and display. |
| Sterile Saline (0.9%) | Standard diluent for reconstituting ICG for intravenous injection. | Must be preservative-free for IV use. |
| Optimal ICG Formulation | Pre-defined, consistent concentration for specific applications (e.g., 2.5 mg/mL). | Critical for protocol standardization across RCT sites. |
| Standardized White Light System | The control visualization technology in comparative trials. | High-definition laparoscopic or open surgical system. |
| Calibration Phantom | Validates and standardizes fluorescence intensity measurements across devices and studies. | Ensures quantitative data comparability. |
| Data Recording & Analysis Software | For recording synchronized white light and fluorescence video, and measuring metrics like time-to-peak, intensity. | Enables blinded, retrospective analysis of intraoperative videos. |
Conclusion
The evolution from white light to ICG fluorescence-guided surgery represents a paradigm shift towards functional and molecularly-informed visualization. While foundational science establishes its robust optical and pharmacokinetic basis, methodological applications demonstrate tangible improvements in surgical precision across diverse specialties. Successful implementation requires meticulous attention to troubleshooting variables like dosing and signal interpretation. Current validation data, though promising, underscores the need for more high-level comparative studies to definitively establish superiority in specific indications. For researchers and drug developers, this field presents significant opportunities: the development of next-generation, target-specific fluorophores, integration with AI for real-time image analysis, and the convergence of diagnostic imaging with intraoperative guidance, paving the way for true image-guided therapy in the operating room.