ICG Fluorescence-Guided Laparoscopic Cholecystectomy: A Comprehensive Protocol for Enhanced Biliary Visualization and Surgical Safety
This article provides a comprehensive, evidence-based protocol for Indocyanine Green (ICG) fluorescence-guided laparoscopic cholecystectomy, tailored for researchers and drug development professionals.
ICG Fluorescence-Guided Laparoscopic Cholecystectomy: A Comprehensive Protocol for Enhanced Biliary Visualization and Surgical Safety
Abstract
This article provides a comprehensive, evidence-based protocol for Indocyanine Green (ICG) fluorescence-guided laparoscopic cholecystectomy, tailored for researchers and drug development professionals. It explores the foundational science of ICG's hepatobiliary excretion and fluorescence properties, details a standardized methodology for preoperative dosing, timing, and imaging system settings, addresses common technical challenges and optimization strategies, and validates the approach through comparative analysis of clinical outcomes against conventional white-light surgery. The scope encompasses enhancing critical view of safety, reducing bile duct injury rates, and defining objective metrics for fluorescence signal interpretation, presenting a framework for clinical translation and future contrast agent development.
The Science Behind the Glow: Understanding ICG Pharmacokinetics and Fluorescence Imaging Principles
This application note details the molecular and pharmacokinetic properties of Indocyanine Green (ICG) that underpin its utility as a near-infrared (NIR) fluorescent tracer for real-time visualization of the hepatobiliary system. Within the thesis research on "Optimization of ICG Fluorescence-Guided Laparoscopic Cholecystectomy," a precise understanding of ICG's hepatic handling is paramount. This knowledge informs critical protocol variables, including dosing, timing of administration pre-surgery, and interpretation of the intraoperative fluorescence signal, directly impacting the accuracy of bile duct delineation and the safety profile of the procedure.
Molecular Structure and Physicochemical Determinants
Table 1: Key Molecular Characteristics of ICG
| Property | Specification | Pharmacokinetic Implication |
|---|---|---|
| Chemical Name | 2-[7-[1,3-dihydro-1,1-dimethyl-3-(4-sulfobutyl)-2H-benz[e]indol-2-ylidene]-1,3,5-heptatrienyl]-1,1-dimethyl-3-(4-sulfobutyl)-1H-benz[e]indolium hydroxide, inner salt, sodium salt | -- |
| Molecular Weight | 774.96 Da | High enough for protein binding, too low for renal filtration. |
| Log P (Partition Coeff.) | Hydrophilic-Lipophilic Balance (HLB) ~3.5 | Dictates strong plasma protein binding and specific hepatocyte uptake. |
| Protein Binding | >95% to plasma proteins (primarily albumin) | Confines ICG to vascular and hepatic compartments; prevents extravasation. |
| Aqueous Solubility | High in aqueous media; forms aggregates at high concentrations or in saline. | Requires reconstitution with specific solvent (e.g., sterile water) to ensure monomeric form for consistent fluorescence. |
| Fluorescence Peak | Excitation: ~780 nm, Emission: ~820 nm | Enables deep tissue penetration and low autofluorescence in the NIR window. |
Pharmacokinetics: Hepatocyte Uptake and Biliary Excretion
Table 2: Quantitative Pharmacokinetic Parameters of ICG in Humans
| Parameter | Typical Value (Healthy Liver) | Notes for Surgical Protocol |
|---|---|---|
| Plasma Half-life (T½) | 3-5 minutes | Indicates rapid hepatic clearance. Optimal imaging window is narrow. |
| Hepatic Uptake Time | Peak parenchymal fluorescence: 15-30 min post-IV | Defines time to visualize liver edge. |
| Biliary Excretion Onset | Detectable in bile ducts: 30-45 min post-IV | Critical for timing of duct imaging prior to gallbladder dissection. |
| Excretion Half-life | Cumulative biliary excretion ~97% in 2 hours | Supports near-complete clearance, allowing repeat dosing if needed. |
| Plasma Clearance Rate | 0.14 - 0.23 L/min | Highly dependent on hepatic blood flow and function. |
Detailed Experimental Protocols
Protocol 4.1:In VitroAssessment of ICG Uptake in Cultured Hepatocytes
Purpose: To quantify the kinetics and transporter-dependence of ICG uptake. Materials: See "Research Reagent Solutions" below. Procedure:
- Cell Culture: Seed human hepatoma cells (e.g., HepG2) or primary human hepatocytes in collagen-coated 24-well plates. Culture until 80-90% confluent.
- Inhibition Assay: Pre-incubate cells with transporter inhibitors (e.g., 100 µM Bromosulfophthalein for OATPs, 10 µM Novobiocin for NTCP) or vehicle control in uptake buffer (Hanks' Balanced Salt Solution, HBSS) for 15 min at 37°C.
- ICG Incubation: Replace medium with uptake buffer containing ICG (1-10 µM). Incubate for specified times (e.g., 0.5, 1, 2, 5, 10 min) at 37°C or 4°C (for energy-dependence control).
- Termination: Rapidly aspirate ICG solution and wash cells three times with ice-cold PBS.
- Lysis and Quantification: Lyse cells with 1% Triton X-100 in PBS. Transfer lysate to a black 96-well plate. Measure fluorescence (Ex: 780/25 nm, Em: 820/20 nm) using a NIR-compatible plate reader. Normalize to total protein content (BCA assay).
- Data Analysis: Calculate uptake velocity. Compare inhibited/4°C groups to control to confirm carrier-mediated process.
Protocol 4.2:Ex VivoBiliary Excretion Kinetics Using Isolated Perfused Rat Liver (IPRL)
Purpose: To model the direct hepatic processing and biliary excretion of ICG. Procedure:
- Liver Isolation: Anesthetize rat. Cannulate the bile duct, portal vein, and inferior vena cava. Excise liver and transfer to a 37°C perfusion chamber.
- Perfusion: Perfuse via the portal vein with oxygenated Krebs-Henseleit buffer (95% O2/5% CO2) at constant flow (30-35 mL/min).
- ICG Administration: Add ICG (2.5 µM final) as a bolus to the perfusion reservoir.
- Serial Sampling: Collect bile in pre-weighed tubes at 5-min intervals for 60 min. Periodically sample perfusate from the venous outflow.
- Analysis: Measure ICG concentration in bile and perfusate by fluorescence spectrophotometry. Calculate cumulative biliary excretion and clearance rates.
- Validation: Test effect of MRP2 inhibitor (e.g., MK-571) added to perfusate prior to ICG.
Protocol 4.3:In VivoFluorescence Imaging for Cholecystectomy Timing
Purpose: To determine the optimal post-injection window for cystic duct visualization. Procedure:
- Animal Model/Patient Preparation: Use a porcine model or human subjects scheduled for cholecystectomy.
- ICG Administration: Administer a standardized IV dose (e.g., 2.5 mg for human, 0.2 mg/kg for pig).
- Time-Lapse Imaging: Using a laparoscopic NIR fluorescence imaging system, record the abdominal cavity at fixed intervals (e.g., every 5 minutes) post-injection.
- Signal Quantification: Use region-of-interest (ROI) analysis software to quantify mean fluorescence intensity (MFI) in the liver parenchyma, gallbladder, and extrahepatic bile ducts over time.
- Optimal Window Determination: Define the time window where duct-to-background ratio (cystic duct vs. liver) is maximized, typically when liver parenchymal signal begins to decline as biliary signal intensifies.
The Scientist's Toolkit: Research Reagent Solutions
Table 3: Essential Materials for ICG Hepatobiliary Research
| Item | Function in Research | Example/Note |
|---|---|---|
| ICG, Pharmaceutical Grade | The active fluorescent tracer for all experiments. | Ensure consistent sourcing (e.g., PULSION, Diagnostic Green). |
| Human Hepatocytes (Primary/Cell Line) | In vitro model for uptake/efflux studies. | Primary (e.g., BioIVT) are gold standard; HepG2/C3A are common lines. |
| Transporter Inhibitors | To delineate specific uptake/excretion pathways. | Bromosulfophthalein (OATP), Rifampicin (OATP), MK-571 (MRP2). |
| NIR Fluorescence Plate Reader | Quantifies ICG in cell lysates, bile, plasma samples. | Must have ~800 nm emission filter (e.g., LI-COR Odyssey, Tecan Spark). |
| Laparoscopic NIR Imaging System | For in vivo surgical protocol development. | Stryker PINPOINT, Karl Storz IMAGE1 S, Olympus VISERA ELITE II. |
| Isolated Perfused Liver System | Ex vivo integrated model of hepatic processing. | Allows precise control of perfusion and sampling (e.g., Harvard Apparatus setups). |
| Albumin (Human Serum, HSA) | For creating physiologically relevant ICG-protein complexes in in vitro assays. | Use fatty acid-free HSA. |
| Image Analysis Software | Quantifies fluorescence signal intensity and kinetics from images/video. | Open-source (ImageJ/FIJI) or proprietary (e.g., Stryker Q-Capture). |
Application Notes
This document details the fundamental optical principles and practical protocols for utilizing near-infrared (NIR) fluorescence, specifically focusing on Indocyanine Green (ICG), within the research context of developing optimized protocols for fluorescence-guided laparoscopic cholecystectomy. The core advantage lies in the improved tissue penetration and reduced autofluorescence of light in the NIR-I window (700–900 nm), enhancing surgical visualization of critical structures like the biliary tree.
1. Key Optical Properties of ICG ICG is the only FDA-approved NIR fluorophore for clinical use. Its spectral properties are central to its utility in deep-tissue imaging.
Table 1: Spectral and Physicochemical Properties of ICG
| Property | Typical Range/Value | Implication for Laparoscopic Imaging |
|---|---|---|
| Peak Excitation (in blood/plasma) | ~800 nm | Requires laser or LED light source centered at this wavelength. |
| Peak Emission (in blood/plasma) | ~830 nm | Emitted light is detected through a filter blocking ambient and excitation light. |
| Molar Extinction Coefficient (ε) | ~120,000 M⁻¹cm⁻¹ (in plasma) | High absorption enables efficient fluorescence even at low doses. |
| Quantum Yield (in blood/plasma) | ~4-5% | Relatively low, but sufficient due to high excitation efficiency and low background. |
| Tissue Penetration Depth (750-900 nm) | 5-10 mm (significant signal up to ~1 cm) | Allows visualization of structures beneath the tissue surface. |
| Plasma Protein Binding | >95% (primarily to albumin) | Confines dye to vascular compartment; defines pharmacokinetics. |
2. Physics of Tissue Penetration The superior penetration of NIR light is a consequence of reduced scattering and absorption by endogenous chromophores.
Table 2: Light-Tissue Interaction in the NIR Window
| Chromophore | Absorption in Visible Range | Absorption in NIR-I (700-900 nm) |
|---|---|---|
| Hemoglobin (Oxy & Deoxy) | Very High (400-600 nm) | Low (Minimal beyond 650 nm) |
| Melanin | High | Decreases with increasing wavelength |
| Lipids | Moderate | Moderate, with specific peaks |
| Water | Very Low | Low (begins to increase >900 nm) |
| Primary Attenuation Factor | Absorption | Scattering |
Experimental Protocols
Protocol 1: Measuring Excitation and Emission Spectra of ICG in a Biologically Relevant Matrix
Objective: To characterize the spectral profile of ICG under conditions mimicking the in vivo environment for instrument calibration.
Materials:
- ICG powder (diagnostic grade).
- Human Serum Albumin (HSA) or Fetal Bovine Serum (FBS).
- Phosphate-Buffered Saline (PBS).
- Spectrofluorometer with NIR-capable detector.
- Quartz cuvettes (low fluorescence).
Procedure:
- Prepare a 1 mg/mL stock solution of ICG in sterile water. Prepare a working solution of 10 µM ICG in PBS containing 4% HSA (to simulate protein binding).
- In the spectrofluorometer, set the emission monochromator to 830 nm. Perform an excitation scan from 650 nm to 900 nm. The peak observed is the excitation spectrum.
- Set the excitation monochromator to 800 nm. Perform an emission scan from 750 nm to 950 nm. The peak observed is the emission spectrum.
- Record the peak excitation (λexmax) and emission (λemmax) wavelengths and the Stokes shift (λemmax - λexmax).
Protocol 2: Quantifying Signal-to-Background Ratio (SBR) in a Tissue Phantom Model
Objective: To simulate and measure the SBR for ICG fluorescence through layered tissue, informing optimal camera settings.
Materials:
- Liquid tissue phantom (e.g., Intralipid 20% in PBS) to simulate scattering.
- Bovine or porcine tissue slices (1-5 mm thickness).
- NIR fluorescence imaging system (e.g., laparoscopic NIR camera).
- ICG solution (0.05 mg/mL in saline).
Procedure:
- Prepare two identical wells: Well A (Background) contains tissue phantom only. Well B (Signal) contains tissue phantom mixed with ICG to a final concentration of 5 µM.
- Place a tissue slice of defined thickness (start at 2 mm) over both wells.
- Illuminate with standardized NIR excitation (800 ± 10 nm). Acquire fluorescence images using the NIR camera with an appropriate long-pass emission filter (>820 nm).
- Using image analysis software, measure the mean fluorescence intensity from a region of interest (ROI) over Well B (Signal Intensity, SI) and Well A (Background Intensity, BI). Calculate SBR = SI / BI.
- Repeat steps 2-4 with increasing tissue slice thickness (up to 10 mm). Plot SBR vs. Tissue Thickness to characterize signal attenuation.
Diagram 1: NIR Light Path Through Tissue
Protocol 3: Ex Vivo Biliary Tract Labeling for Laparoscopic System Calibration
Objective: To establish a standardized protocol for visualizing biliary anatomy using ICG, replicating intraoperative conditions.
Materials:
- Ex vivo porcine or bovine liver with intact gallbladder and cystic duct.
- ICG for injection.
- Laparoscopic NIR fluorescence imaging system.
- Syringe pump.
Procedure:
- Cannulate the cystic duct with a fine catheter and secure it.
- Prepare an ICG solution at a concentration of 0.05 mg/mL in saline.
- Using a syringe pump, perfuse the biliary tract via the catheter with ICG solution at a slow, physiological flow rate (e.g., 1 mL/min).
- Simultaneously, image the hepatoduodenal ligament and gallbladder fossa using both white light and NIR fluorescence modes on the laparoscopic system.
- Systematically adjust camera parameters (gain, exposure time, laser power) to achieve an optimal SBR where the biliary tree is clearly delineated against the liver parenchyma, without signal saturation.
- Record the final parameters as the "optimized setup" for subsequent in vivo research.
Diagram 2: ICG Pharmacokinetics for Biliary Imaging
The Scientist's Toolkit: Research Reagent Solutions
Table 3: Essential Materials for NIR Fluorescence-Guided Surgery Research
| Item | Function/Description |
|---|---|
| ICG (Indocyanine Green), sterile | The clinical-grade NIR fluorophore; absorbs ~800 nm, emits ~830 nm. |
| NIR Fluorescence Laparoscopy System | Integrated system with NIR light source, appropriate filters, and a sensitive CCD/CMOS camera. |
| Liquid Tissue Phantom (e.g., Intralipid) | Standardized scattering medium for calibrating imaging depth and system sensitivity. |
| Human Serum Albumin (HSA) | Mimics in vivo protein binding of ICG, altering its spectral properties and pharmacokinetics. |
| Spectrofluorometer with NIR Detector | For precise in vitro measurement of excitation/emission spectra and quantum yield. |
| Calibrated Optical Power Meter | Quantifies excitation light intensity at the target tissue plane for dose-response studies. |
| ImageJ/FIJI with NIR Analysis Plugins | Open-source software for quantitative analysis of SBR, signal intensity, and kinetics. |
| Small Animal NIR Imaging System | For pre-clinical pharmacokinetic and biodistribution studies of ICG and novel agents. |
Abstract Within the scope of a thesis on standardizing ICG fluorescence-guided laparoscopic cholecystectomy, this application note details the critical hardware components: camera systems and optical filters. Precise specification and integration of these elements are fundamental for generating reliable, quantitative intraoperative data on biliary anatomy and perfusion, which is essential for validating surgical protocols and evaluating novel fluorescent agents.
Camera Technologies for Fluorescence Laparoscopy
Modern laparoscopic fluorescence imaging systems are built on two primary camera architectures: monochrome (mono) and color (RGB). The choice significantly impacts sensitivity, resolution, and workflow.
Table 1: Comparison of Monochrome vs. Color Camera Technologies for ICG Imaging
| Feature | Monochrome (Mono) CMOS/CCD Camera | Color (RGB) CMOS Camera with Fluorescence Overlay |
|---|---|---|
| Core Principle | Single, panchromatic sensor; no Bayer filter. Uses separate optical filter wheels/channels for white light and fluorescence. | Standard RGB sensor with Bayer filter; uses software to process and overlay fluorescent signal on color image. |
| Sensitivity to NIR (ICG) | Very High. No Bayer filter to block NIR photons; entire pixel array detects 800-850 nm light. | Reduced. Bayer filter mosaic absorbs a significant portion of NIR photons; only a subset of pixels (typically unfiltered or R/G) are NIR-sensitive. |
| Spatial Resolution | Maximum. Full sensor resolution dedicated to fluorescence signal. | Compromised. NIR signal is sampled at a lower effective resolution (e.g., 1/4 of total pixels). |
| Quantitative Accuracy | Superior. Linear response, high signal-to-noise ratio (SNR), minimal crosstalk between channels. | Lower. Susceptible to autofluorescence crosstalk, lower SNR, requires complex normalization algorithms. |
| Typical System Cost | Higher. Requires precision filter mechanisms and dedicated processing. | Lower. Leverages standard color laparoscope hardware with software upgrade. |
| Clinical Workflow | Requires switching between WL and FL modes (manual or automated). | Often provides real-time, simultaneous "Picture-in-Picture" or "Overlay" display. |
| Best For | Research requiring quantification, low-dose ICG studies, evaluation of novel NIR agents. | Clinical settings prioritizing anatomical context and procedural ease. |
Optical Filter Specifications
Optical filters are critical for isolating the ICG signal. A fluorescence imaging system requires an excitation filter in the light path and an emission (barrier) filter in the camera path.
Table 2: Key Optical Filter Specifications for ICG Fluorescence Laparoscopy
| Parameter | Excitation Filter (Light Source Path) | Emission Filter (Camera Path) | Optimal Specification for ICG |
|---|---|---|---|
| Central Wavelength (CWL) | ~805 nm | ~835 nm | Matches ICG peak excitation (~805 nm) and emission (~835 nm). |
| Bandwidth (FWHM) | Narrow (typically 20-30 nm) | Narrow (typically 20-30 nm) | ≤30 nm minimizes background autofluorescence excitation and bleed-through. |
| Optical Density (OD) | High OD at emission band | High OD at excitation band | OD >5 (blocks >99.999%) at opposing bands to ensure complete spectral separation. |
| Transmission Efficiency | >85% at CWL | >90% at CWL | Maximizes signal strength and reduces required laser/light power. |
| Filter Type | Bandpass or Notch | Longpass or Bandpass | Bandpass for both is ideal for purest signal. Longpass emission is simpler but allows more background. |
Technical Note: Systems using a laser diode (e.g., 805 nm ±2 nm) may have a simplified excitation filter, as the laser itself provides a narrowband source. Systems using a broadband light source (e.g., Xenon) with an integrated filter module require a precise bandpass excitation filter.
Diagram Title: Optical Filter Pathway in ICG Imaging System
Experimental Protocol: In Vitro System Characterization
This protocol is essential for benchmarking any fluorescence laparoscopy system prior to preclinical or clinical studies in the cholecystectomy thesis.
Objective: To quantitatively measure key system performance parameters: Sensitivity, Linearity, and Uniformity.
Materials:
- Fluorescence laparoscopic imaging system (camera, scope, light source).
- ICG standards in sealed cuvettes or well plates (e.g., 0.01, 0.1, 1.0, 10 µM in PBS/Albumin).
- Neutral density (ND) filters of known optical density.
- Uniform NIR-emitting phantom or flat-field calibration target.
- Computer with imaging software capable of pixel intensity analysis (e.g., ImageJ, custom LabVIEW/Python).
Procedure:
- System Setup: Allow system to warm up for 30 minutes. Use monochrome camera mode if available. Set all gain/exposure to manual, default levels.
- Sensitivity & Limit of Detection (LoD):
- Image a series of low-concentration ICG standards (0.001 to 1 µM) against a PBS blank.
- Use region-of-interest (ROI) analysis to measure mean signal intensity and standard deviation of background.
- LoD = (MeanBackground + 3*SDBackground). Determine the lowest concentration yielding signal > LoD.
- Linear Dynamic Range:
- Image ICG standards across expected concentration range (0.1 µM to 100 µM).
- Plot measured fluorescence intensity (mean ROI) vs. concentration.
- Perform linear regression. Report the coefficient of determination (R²) and the range over which R² > 0.98.
- Uniformity & Illumination Profile:
- Image a uniform fluorescent phantom or a non-fluorescent target under uniform NIR illumination.
- Analyze intensity profile across the entire field of view (FOV).
- Calculate uniformity as (1 - (MaxIntensity - MinIntensity) / (MaxIntensity + MinIntensity)) * 100%.
Deliverables: A calibration report containing plots of sensitivity and linearity, a uniformity map, and the specific camera settings used.
Experimental Protocol: Ex Vivo Bile Duct Contrast-to-Noise Ratio (CNR) Assessment
This protocol simulates the critical task of cystic duct identification during cholecystectomy.
Objective: To quantify the visibility of ICG-perfused bile duct structures against the liver background in an ex vivo porcine model.
Materials:
- Fresh, intact porcine liver with gallbladder and extrahepatic bile ducts.
- Laparoscopic fluorescence imaging system.
- ICG solution (1.25 mg/mL).
- Syringe and catheter for duct cannulation.
- Surgical tools for dissection.
- Caliper for distance measurement.
- Imaging analysis software.
Procedure:
- Tissue Preparation: Cannulate the cystic duct and flush with saline. Position the liver specimen under the laparoscopic system at a standardized distance (e.g., 5 cm).
- Control Image: Acquire a white light and a fluorescence background image (no ICG).
- ICG Administration: Inject 1.0 mL of diluted ICG solution (e.g., 1:10 in saline) into the cannulated duct to fill the biliary tree.
- Image Acquisition: Acquire fluorescence video for 10 minutes, capturing static images at 1-min intervals. Maintain constant camera settings.
- Region of Interest (ROI) Analysis:
- Define ROIs for: Target (T): Common bile duct; Background (B): Adjacent liver parenchyma.
- Record mean signal intensity (IT, IB) and standard deviation of background (SD_B) for each time point.
- Calculation: Compute CNR for each time point: CNR = (IT - IB) / SD_B.
Deliverables: A plot of CNR vs. Time post-injection. The time to peak CNR and the duration CNR remains above a threshold (e.g., >2) are key metrics for protocol optimization.
Diagram Title: Ex Vivo Bile Duct CNR Assessment Workflow
The Scientist's Toolkit: Key Research Reagent Solutions
Table 3: Essential Materials for ICG Fluorescence Laparoscopy Research
| Item | Function & Specification | Rationale for Use |
|---|---|---|
| ICG for Injection (PULSION) | Clinical-grade, sterile indocyanine green. | Gold standard fluorophore; ensures consistency with human trial protocols and regulatory compliance. |
| ICG-Albumin Complex | ICG non-covalently bound to Human Serum Albumin (HSA). | Mimics intravascular behavior for perfusion studies; reduces free ICG leakage and hepatic clearance rate. |
| NIR Fluorescent Microspheres | Polystyrene beads doped with NIR dyes (e.g., 815 nm). | Used as fiducial markers or for creating stable calibration phantoms with known brightness. |
| Solid Tissue-Mimicking Phantom | Silicone or epoxy resin with NIR fluorophore and scatterers. | Provides a stable, uniform target for daily system validation and uniformity testing. |
| PBS/Albumin Buffer | Phosphate-buffered saline with 1-5% HSA. | Standard diluent for ICG to prevent adsorption to surfaces and maintain consistent quantum yield. |
| Liquid Light Calibration Standard | Certified fluorophore solution in sealed cuvette (e.g., IR-26 dye). | Traceable standard for absolute inter-system calibration and longitudinal performance monitoring. |
| Precision Neutral Density Filters | Filters with defined OD at 800-850 nm. | Allows safe, controlled attenuation of high-intensity signals to keep camera in linear response range. |
Laparoscopic cholecystectomy is one of the most common general surgical procedures. Despite its prevalence, iatrogenic bile duct injury (BDI) remains a significant and devastating complication, with a reported incidence of 0.3-0.8% and associated long-term morbidity, mortality, and medico-legal consequences. The classic "critical view of safety" (CVS) remains the gold standard for prevention but is not achieved in a substantial number of cases due to factors like acute/chronic inflammation, aberrant anatomy, and excessive adipose tissue. Real-time, high-contrast visualization of the extrahepatic biliary tree is an unmet clinical need to augment anatomic delineation and prevent BDI.
Quantitative Analysis of the Clinical Need and ICG Performance
Table 1: Incidence and Impact of Bile Duct Injury (BDI) in Laparoscopic Cholecystectomy
| Metric | Reported Value Range | Source/Notes |
|---|---|---|
| Overall BDI Incidence | 0.3% - 0.8% | Meta-analyses (2015-2023) |
| BDI Mortality Rate | 0.2% - 0.8% | Population-based studies |
| Long-term Morbidity (Stricture) | Up to 30% of BDI cases | Follow-up studies |
| Rate of Litigation | >50% of major BDI cases | Legal database reviews |
| Economic Cost per Major BDI | $75,000 - $200,000+ | Healthcare cost analyses |
Table 2: Performance Metrics of ICG Fluorescence Cholangiography vs. Static Imaging
| Parameter | Intraoperative Cholangiography (IOC) | Preoperative MRCP | ICG Fluorescence Cholangiography |
|---|---|---|---|
| Real-time Imaging | Yes | No | Yes |
| Bile Duct Visualization Rate (Cystic Duct) | 95-100% | 100% (static) | 85-98% (dose/time dependent) |
| Bile Duct Visualization Rate (Common Duct) | 95-100% | 100% (static) | 70-95% (dose/time dependent) |
| Contrast Agent Admin Route | Direct cannulation | IV/Oral | IV (systemic) |
| Procedure Time Addition (min) | 15-25 | N/A (pre-op) | 0-2 |
| Ionizing Radiation | Yes | No | No |
| Cost per Procedure | High | High | Low |
| Ability for Continuous Perfusion Assessment | No | No | Yes |
Core Experimental Protocols
Protocol 3.1: Standardized Preoperative ICG Dosing and Timing for Optimal Biliary Tree Fluorescence
Objective: To determine the optimal intravenous dose and timing interval for maximal signal-to-background ratio (SBR) of the extrahepatic biliary structures during laparoscopic cholecystectomy.
Materials:
- Indocyanine Green (ICG) powder (e.g., PULSION).
- Sterile water for injection.
- Laser-based fluorescence imaging system compatible with 806nm excitation / 830nm emission (e.g., Karl Storz IMAGE1 S, Stryker 1688 AIM, or equivalent).
- Standard laparoscopic tower and 0- or 30-degree laparoscope.
- Calibrated grayscale phantom for SBR quantification (optional for research).
Procedure:
- Solution Preparation: Reconstitute 25mg of ICG in 10ml of sterile water to form a 2.5mg/ml stock solution. Protect from light.
- Patient Preparation: Obtain informed consent. Exclude patients with known iodine/ICG allergy or severe hepatic impairment.
- Dosing Cohorts: Patients are systematically enrolled into one of three dosing groups:
- Group A (Low Dose): 2.5mg ICG (1ml of stock).
- Group B (Medium Dose): 5.0mg ICG (2ml of stock).
- Group C (High Dose): 7.5mg ICG (3ml of stock).
- Administration: Inject the designated ICG dose intravenously via a peripheral line at a standardized time point pre-incision: t = 30 minutes, 60 minutes, or 90 minutes before anticipated dissection of Calot's triangle.
- Intraoperative Imaging: After pneumoperitoneum establishment, switch the camera system to fluorescence/NIR mode. Record the visual clarity of the cystic duct (CD), common hepatic duct (CHD), and common bile duct (CBD) using a standardized scoring scale (0=not seen, 1=faint, 2=clear, 3=very bright).
- Quantitative Analysis (Research Setting): If using a system capable of SBR measurement, place regions of interest (ROIs) over the CBD and adjacent liver parenchyma. Calculate SBR = (Mean CBD fluorescence intensity) / (Mean liver background intensity).
- Data Collection: Record the time from injection to visualization, total fluorescence duration, and any adverse events.
Expected Outcome: A dose of 2.5-5.0mg administered 60-90 minutes pre-op typically provides optimal SBR, minimizing liver parenchymal fluorescence while highlighting the biliary tree.
Protocol 3.2: Ex Vivo Validation of Biliary Anatomy Using ICG Perfusion in Surgical Specimens
Objective: To validate the accuracy of ICG-fluorescence identified anatomy against the gold standard of post-resection dissection and histology.
Materials:
- Fresh laparoscopic cholecystectomy specimen.
- NIR fluorescence imaging system for ex vivo use (e.g., open-field imager).
- Micro-dissection tools.
- 10% Formalin solution.
- Pathologic examination requisition.
Procedure:
- Immediately after resection, place the specimen on a clean, dry field.
- Using the NIR imaging system in a dark room, capture a fluorescence image of the specimen, specifically focusing on the cystic duct-common duct junction and any fluorescent tubular structures.
- Trace the fluorescent pathway using a sterile surgical marker.
- Proceed with standard pathologic dissection along the marked fluorescent guide. Precisely identify the length and insertion point of the cystic duct.
- Document any aberrant anatomy (e.g., low medial insertion, accessory ducts).
- Submit the cystic duct margin and any areas of concern for histologic processing (H&E staining).
- Correlate the intraoperative fluorescent imaging, ex vivo fluorescent mapping, gross dissection findings, and final histology.
Expected Outcome: 100% correlation between fluorescent tracts and true biliary structures, with potential identification of subtle anatomy not appreciated under white light.
Visualizing the Workflow and Mechanism
Diagram 1: ICG Biliary Mapping Workflow & Validation
Diagram 2: ICG Biodistribution & Fluorescence Mechanism
The Scientist's Toolkit: Research Reagent Solutions
Table 3: Essential Research Materials for ICG Biliary Mapping Studies
| Item | Function/Description | Example Vendor/Cat. No. (Research Grade) |
|---|---|---|
| Indocyanine Green (ICG) | Near-infrared fluorophore; binds plasma proteins, excreted hepatically. | PULSION (clinical); Sigma-Aldrich 425301 (research grade). |
| NIR Fluorescence Imaging System | Integrated laparoscopic system with NIR light source & filtered camera. | Karl Storz IMAGE1 S, Stryker 1688 AIM, Medtronic FireFly. |
| Calibrated NIR Phantom | For standardizing and quantifying fluorescence intensity across experiments. | Biomimic ICG Phantom, or custom agarose/Intralipid phantoms with known ICG concentrations. |
| Software for SBR Analysis | ImageJ with NIR plugins, or vendor-specific quantification software. | ImageJ (Fiji), ROI analysis tools in Stryker/Medtronic software. |
| Histology Fixative & Stain | For gold-standard validation of anatomic findings from fluorescence. | 10% Neutral Buffered Formalin; Hematoxylin and Eosin (H&E) stain. |
| Small Animal NIR Imager | For pre-clinical pharmacokinetic/dosing studies of novel fluorophores. | PerkinElmer IVIS, LI-COR Pearl. |
| Alternative/Novel NIR Biliary Agents | Research compounds with potentially improved biliary excretion profiles. | e.g., CH-4T (a cyanine dye), certain heptamethine dyes (research stage). |
Historical Evolution and Current Regulatory Status of ICG in Surgery
Historical Evolution
Indocyanine green (ICG) fluorescence imaging has transformed from a diagnostic dye to a cornerstone of surgical guidance. Its evolution is marked by key milestones.
Table 1: Historical Milestones of ICG in Surgery
| Year Range | Phase | Key Development | Primary Application |
|---|---|---|---|
| 1956-1959 | Discovery & Approval | Synthesis & initial FDA approval for diagnostic use (hepatic, cardiac). | Medical diagnostics |
| 1970s-1990s | Early Surgical Exploration | First use in ophthalmic angiography and liver surgery assessment. | Ophthalmic & Hepatobiliary |
| 1999-2005 | Technological Convergence | Introduction of near-infrared (NIR) imaging systems compatible with ICG fluorescence. | Early intraoperative imaging |
| 2005-2015 | Expansion & Validation | Proliferation in sentinel lymph node biopsy (SLNB) and vascular assessment. | Oncology & Vascular Surgery |
| 2015-Present | Mainstream Adoption | Integration into laparoscopic/robotic platforms; standardization of protocols. | Minimally Invasive Surgery (e.g., Laparoscopic Cholecystectomy) |
Current Regulatory Status
The regulatory landscape for ICG as a surgical adjunct varies globally, primarily because it is an approved diagnostic agent being used for an unlabeled intraoperative application.
Table 2: Regulatory Status Overview (as of 2024)
| Region/Authority | Product Name(s) | Approved Diagnostic Indication | Status for Surgical Guidance | Key Notes |
|---|---|---|---|---|
| U.S. FDA | IC-GREEN, Infracyanine Green | Cardiac, hepatic, ophthalmic function testing. | Off-label Use | Widely accepted standard of care. No device-specific therapeutic claim. |
| Europe (EMA) | Various (e.g., Verdye, Infracyanine) | Hepatic function, ophthalmic angiography. | Off-label Use | Used per surgeon's discretion under medical practice regulations. |
| Japan (PMDA) | Diagnogreen | Hepatic function, blood volume, cardiac output. | Approved for SLNB | Has specific on-label approval for sentinel lymph node mapping. |
| China (NMPA) | Indocyanine Green | Hepatic function assessment. | Off-label Use | Rapidly growing adoption with local imaging system approvals. |
Application Notes & Protocols for Laparoscopic Cholecystectomy Research
Framed within a thesis on ICG fluorescence-guided laparoscopic cholecystectomy (FLC), the following notes and protocols detail critical experimental methodologies.
AN-001: Quantitative Biliary Fluorescence Kinetics
Objective: To establish standardized metrics for cystic duct (CD) and common bile duct (CBD) visualization timing and intensity. Protocol:
- ICG Administration: Prepare a 2.5 mg/mL solution. Administer a bolus intravenous injection of 0.05 mg/kg (or a standard 2.5 mg dose) at Time Zero (T0).
- Imaging Setup: Use a laparoscopic NIR fluorescence system (e.g., Stryker 1688, Karl Storz IMAGE1 S, Olympus VISERA ELITE II). Set camera to "Fluorescence" mode. Gain settings must be fixed (e.g., 75%) for the experiment.
- Data Acquisition:
- Start continuous recording upon injection.
- Record the time (post-T0) to first detectable fluorescence in the CBD (TCBD) and the CD (TCD).
- At 5-minute intervals for 30 minutes, capture a static NIR image and a corresponding white-light image.
- Quantitative Analysis:
- Use proprietary software (e.g, Stryker Q-Capture) or open-source tools (ImageJ) to analyze regions of interest (ROIs).
- Measure signal-to-background ratio (SBR):
SBR = (Mean Intensity_ROI - Mean Intensity_Background) / Mean Intensity_Background. - Record peak SBR and time to peak for CD.
Table 3: Example Kinetic Data (Mean ± SD)
| Anatomical Structure | Time to First Signal (min) | Peak SBR | Time to Peak (min) | Optimal Window for Dissection (min post-injection) |
|---|---|---|---|---|
| Common Bile Duct (CBD) | 2.5 ± 0.8 | 5.2 ± 1.3 | 12.5 ± 3.1 | N/A (Landmark) |
| Cystic Duct (CD) | 5.8 ± 2.1 | 8.7 ± 2.5 | 18.3 ± 4.7 | 10 - 25 |
| Liver Parenchyma | 0.5 ± 0.2 | 12.0 ± 3.5 | 3.0 ± 1.0 | (Confounding Background) |
PR-002: Protocol for "Critical View of Safety" (CVS) Fluorescence Augmentation
Objective: To integrate ICG fluorescence into the standard CVS protocol for bile duct injury prevention. Detailed Methodology:
- Preoperative: Obtain informed consent for ICG administration. Exclude patients with iodine allergy or hyperthyroidism.
- Intraoperative:
- Phase 1 - Calot's Triangle Exposure: Perform standard dissection.
- Phase 2 - ICG Administration: Inject ICG (2.5 mg IV) once the hepatocystic triangle is exposed.
- Phase 3 - Fluorescence-guided Dissection: Continue dissection under intermittent NIR fluorescence guidance after a 5-10 minute interval.
- Fluorescence-Specific Criteria for CVS: a. Cystic Duct Delineation: The CD must show clear fluorescence contrast against surrounding tissue before clipping. b. Cystic Artery Identification: The artery should appear as a non-fluorescent (dark) line crossing the fluorescent CD. c. Liver Bed Verification: After gallbladder detachment, the liver bed should show homogeneous fluorescence, confirming no biliary leakage.
- Data Collection: Document achievement of fluorescent CVS criteria (Yes/No) and any fluorescence-based revision of dissection planes.
Visualizations
Diagram 1: ICG Fluorescence-Guided Cholecystectomy Workflow
Diagram 2: ICG Pharmacokinetics for Biliary Imaging
The Scientist's Toolkit: Research Reagent Solutions
Table 4: Essential Materials for ICG Cholecystectomy Research
| Item/Catalog Example | Function in Research | Critical Specification Notes |
|---|---|---|
| ICG Dye (e.g., Akorn IC-GREEN, Diagnostic Green) | The fluorescent agent. Source compound for all experiments. | Ensure sterile, lyophilized powder. Reconstitute precisely with provided solvent (usually sterile water). Avoid saline if incompatible. |
| NIR Fluorescence Laparoscopic System (e.g., Stryker PINPOINT, Karl Storz IMAGE1 S CLICKLINE) | Enables real-time visualization of ICG fluorescence. | Must have ~805 nm excitation light source and appropriate NIR-filtered camera. Ensure compatibility with standard laparoscopic towers. |
| Calibrated Fluorescence Phantom (e.g., homemade with intralipid/ink, or commercial) | Validates and standardizes camera sensitivity and quantitation pre-study. | Allows for cross-platform comparison of signal intensity metrics (SBR). |
| Video Recording & Analysis Software (e.g., Stryker Q-Capture, ImageJ/FIJI with NIR plugins) | For capturing, timestamping, and quantitatively analyzing fluorescence kinetics. | Must support high-quality video capture from the imaging system and allow ROI intensity measurement over time. |
| Data Collection Form (Electronic) | Standardizes intraoperative data capture (timing, SBR, CVS achievement). | Should include fields for TCBD, TCD, peak SBR, and binary outcomes related to fluorescence utility. |
Step-by-Step Protocol: From Patient Selection to Intraoperative Imaging for Fluorescence-Guided Cholecystectomy
Preoperative Patient Assessment and Contraindications for ICG Administration
Within the broader research thesis on standardizing an ICG fluorescence-guided laparoscopic cholecystectomy protocol, rigorous preoperative assessment is foundational. This document details the essential patient evaluation criteria and absolute/relative contraindications for Indocyanine Green (ICG) administration to ensure patient safety and experimental validity in clinical research settings.
Quantitative Patient Risk Stratification Data
Table 1: Preoperative Risk Factors and Associated ICG Pharmacokinetic Alterations
| Risk Factor / Comorbidity | Prevalence in Cholecystectomy Candidates (%) | Effect on ICG Clearance | Recommended Protocol Adjustment |
|---|---|---|---|
| Hepatic Cirrhosis (Child-Pugh A) | 3-5% | Reduction of 40-60% | Dose reduction by 50%; delayed imaging timeline. |
| Renal Impairment (eGFR 30-59 mL/min) | 10-15% | Minimal effect on clearance; potential prolonged circulation. | Standard dose; monitor for prolonged background signal. |
| Severe Obesity (BMI >40 kg/m²) | 20-25% | Altered volume of distribution. | Weight-based dosing (0.05 mg/kg IBW). |
| History of Iodine or Shellfish Allergy | 1-3% | No direct effect. | Not an absolute contraindication; observe for cross-reactivity. |
| Hyperbilirubinemia (>2.0 mg/dL) | 8-12% | Competitive excretion, reduced hepatocyte uptake. | Consider alternative imaging if bilirubin >3.0 mg/dL. |
Table 2: Contraindications to ICG Administration Based on Recent Literature
| Contraindication Type | Specific Condition | Rationale | Research Protocol Action |
|---|---|---|---|
| Absolute | Pregnancy (confirmed or suspected) | Lack of sufficient safety data in pregnancy. | Exclude from study; confirm negative pregnancy test pre-op. |
| Absolute | Known hypersensitivity to ICG, iodine, or sodium iodide | Risk of anaphylactoid reaction. | Exclude from study. Document allergy history meticulously. |
| Absolute | Hyperthyroidism & thyroid adenomas | ICG contains iodide, risk of thyroid storm. | Exclude from study. Screen with TSH/T4. |
| Relative | Severe Hepatocellular Disease (Child-Pugh B/C) | Markedly impaired clearance, diagnostic inaccuracy. | Exclude from efficacy analysis; may enroll for safety monitoring only. |
| Relative | Uremia | Theoretical protein-binding interference. | Dose with caution; ensure hemodialysis access available. |
Detailed Preoperative Assessment Protocol
Objective: To systematically identify patients eligible for ICG administration within the fluorescence-guided cholecystectomy research protocol.
3.1. Materials & Reagent Solutions Table 3: Research Reagent Solutions for Preoperative Assessment
| Item | Function & Specification | Supplier Example (Research Grade) |
|---|---|---|
| ICG for Injection (Diagnostic Grade) | Fluorescent contrast agent. Lyophilized powder, 25 mg vials. | PULSION Medical Systems, Akorn, Diagnostic Green. |
| Sterile Water for Injection (USP) | Solvent for ICG reconstitution. | Baxter, Hospira. |
| Serum Creatinine & eGFR Assay Kit | Assess renal function. | Roche Diagnostics Cobas. |
| Liver Function Panel Assay (ALT, AST, Albumin, Bilirubin) | Assess hepatic synthesis and excretory function. | Siemens ADVIA Chemistry. |
| Thyroid Function Test (TSH) Kit | Screen for thyroid disorders. | Abbott ARCHITECT. |
| Human Serum Albumin (HSA) Solution | For in vitro binding studies if assessing protein competition. | Sigma-Aldrich, ≥96% purity. |
| Allergy Skin Test Kit (Prick Test) | Optional, for investigating equivocal allergy history. | ALK-Abelló. |
3.2. Methodology: Step-by-Step Assessment Workflow
- Initial Screening (Day -30 to -7):
- Obtain informed consent for the research protocol.
- Conduct comprehensive medical history: Document all allergies, specifically to iodine, shellfish, contrast media, or prior ICG. Document thyroid, hepatic, renal disease, and pregnancy status.
- Perform physical examination.
Laboratory Assessment (Day -7 to -2):
- Mandatory Panels: Complete Blood Count (CBC), Comprehensive Metabolic Panel (CMP) including liver enzymes and bilirubin, Renal Panel with calculated eGFR, Thyroid-Stimulating Hormone (TSH).
- For Females of Childbearing Potential: Serum or urine human chorionic gonadotropin (hCG) pregnancy test.
Risk Stratification & Final Eligibility Check (Day -1):
- Apply data from Tables 1 & 2. Categorize patients as:
- Green: No contraindications. Proceed with standard research ICG dosing.
- Yellow: Relative contraindications present. Require Principal Investigator (PI) review. Protocol modifications (e.g., dose adjustment) must be documented.
- Red: Absolute contraindication present. Exclude from ICG administration arm of the study.
- Apply data from Tables 1 & 2. Categorize patients as:
ICG Preparation & Administration Protocol (Intraoperative):
- Reconstitution: Aseptically reconstitute 25 mg ICG vial with 10 mL sterile water for injection to yield 2.5 mg/mL solution.
- Dosing: Draw required dose (standard research dose: 0.05-0.1 mg/kg ideal body weight) into a sterile syringe.
- Administration: Administer as a rapid intravenous bolus via a free-flowing IV line, followed by a 10 mL saline flush.
- Timing for Cholecystectomy: Initiate fluorescence imaging 30-60 minutes post-injection for hepatobiliary excretion and cystic duct delineation.
Experimental Protocol: Assessing ICG-Hepatocyte Interaction in Simulated Liver Dysfunction
Aim: To model the impact of hyperbilirubinemia on ICG uptake in vitro for research validation.
4.1. Materials:
- Cultured HepG2 hepatocyte cell line.
- ICG stock solution (1 mM in DMSO).
- Bilirubin (unconjugated) stock solution.
- Phosphate-Buffered Saline (PBS).
- Fluorescence microplate reader.
4.2. Methodology:
- Seed HepG2 cells in a 96-well black-walled plate.
- Pre-treat cells with bilirubin at concentrations (0, 1, 2, 3 mg/dL) for 2 hours.
- Add ICG to all wells (final concentration 5 µM). Incubate for 30 min.
- Wash cells 3x with PBS.
- Measure intracellular fluorescence (Ex/Em: 780/820 nm).
- Data Analysis: Express fluorescence intensity as percentage of control (no bilirubin). Fit data to a competitive inhibition model.
Diagram Title: In Vitro ICG-Bilirubin Competition Assay Workflow
Signaling Pathway of ICG Uptake and Excretion
Diagram Title: ICG Hepatobiliary Transport & Bilirubin Competition
Within the broader research on ICG fluorescence-guided laparoscopic cholecystectomy protocols, a critical methodological variable is the dosing strategy for indocyanine green (ICG). The choice between weight-based and fixed-dose administration, along with the establishment of standardized concentration and timing parameters, directly impacts biliary tree visualization quality, signal-to-background ratios, and clinical outcomes. This application note synthesizes current research and provides detailed experimental protocols for evaluating these strategies.
Table 1: Comparison of ICG Dosing Strategies in Laparoscopic Cholecystectomy
| Parameter | Weight-Based Dosing | Fixed-Dose Protocol | Notes & Key Findings |
|---|---|---|---|
| Typical Dose Range | 0.05 - 0.25 mg/kg | 2.5 mg, 5 mg, 7.5 mg, or 10 mg | Fixed doses often equate to ~0.03-0.14 mg/kg for a 70kg patient. |
| Common Admin Route | Intravenous (IV) bolus | IV bolus | Single slow IV push is standard for both. |
| Standard Timing to Imaging | 30 - 90 minutes prior | 45 - 60 minutes prior | Weight-based may have more variable optimal timing windows. |
| Visualization Success Rate | 94-100% | 96-100% | No statistically significant superiority established in meta-analyses. |
| Signal-to-Background Ratio (SBR) | Variable; peaks earlier with higher mg/kg doses. | More consistent across patient populations. | SBR > 1.5 considered adequate for visualization. |
| Key Advantage | Personalized, may optimize SBR in extreme weights. | Simplicity, reduced calculation errors, faster preparation. | Fixed-dose simplifies protocol in OR settings. |
| Key Disadvantage | Requires weight calculation, potential for dose variation. | Risk of under/over-dosing in low/high BMI patients. | 2.5mg may be suboptimal in obese patients. |
| Cost & Waste | Variable vial usage. | Potential for more drug waste if using fixed vials. | Multi-use vials can mitigate waste for fixed dosing. |
Table 2: ICG Concentration Standards and Preparation Protocols
| Component | Standard | Rationale & Impact |
|---|---|---|
| Stock Solution | 25 mg ICG in 10 mL sterile water (2.5 mg/mL). | Manufacturer standard (e.g., PULSION). Must be used within 10 hours. |
| Final Injection Volume | Diluted in 10 mL 0.9% NaCl or 5% Glucose. | Standardizes volume for IV push regardless of dose strategy. |
| Concentration for Intravenous Bolus | ~0.25 mg/mL (e.g., 2.5 mg in 10 mL) | Ensures safe, manageable bolus volume. |
| ICG Plasma Binding | >95% binds to plasma proteins (esp. albumin). | Binding is essential for hepatic uptake; free ICG is rapidly cleared renally. |
| Optimal Fluorescence Excitation/Emission | ~805 nm excitation, ~835 nm emission. | NIR-I window minimizes tissue autofluorescence. |
| Stability Post-Reconstitution | 6-10 hours, protect from light. | Aqueous solutions are unstable; must be prepared proximate to use. |
Experimental Protocols
Protocol 1: Comparative Evaluation of Dosing Strategies in a Porcine Model
Objective: To quantitatively compare biliary duct visualization quality and kinetics between weight-based and fixed-dose ICG protocols. Materials: See The Scientist's Toolkit. Methods:
- Animal Preparation & Groups: Use a porcine model (n=6/group). Group A: Weight-based dose (0.1 mg/kg). Group B: Fixed low dose (2.5 mg). Group C: Fixed high dose (7.5 mg). Anesthetize and establish laparoscopic access.
- ICG Administration: Reconstitute ICG as per Table 2. Administer as a single IV bolus via ear vein catheter. Record exact time.
- Image Acquisition: Using a standardized NIR fluorescence laparoscopy system (e.g., Stryker PINPOINT, Karl Storz IMAGE1 S), acquire video at T=0 (baseline), 15, 30, 45, 60, 90, and 120 minutes post-injection. Maintain constant distance, angle, and camera settings (gain, exposure).
- Quantitative Image Analysis: Use proprietary software or ImageJ with NIR plugins.
- Define Regions of Interest (ROIs): Common bile duct (CBD), liver parenchyma, background tissue.
- Calculate mean fluorescence intensity (MFI) for each ROI.
- Compute Signal-to-Background Ratio (SBR) as: SBR = (MFICBD - MFIBackground) / (MFILiver - MFIBackground).
- Plot SBR vs. Time for each group.
- Statistical Analysis: Compare peak SBR, time-to-peak, and duration of adequate visualization (SBR > 1.5) between groups using ANOVA.
Protocol 2: Pharmacokinetic Profiling of Different ICG Concentrations
Objective: To establish the relationship between administered ICG dose, plasma concentration, and biliary excretion fluorescence. Methods:
- Setup: Utilize an in vivo rodent model with catheterization of the common bile duct for timed bile collection.
- Dosing & Sampling: Administer IV doses of 0.05, 0.1, and 0.2 mg/kg ICG. Collect serial blood plasma samples (e.g., at 1, 3, 5, 10, 15, 30, 60 min) and bile samples every 15 minutes for 2 hours.
- Fluorescence Quantification: Use a plate reader equipped with NIR filters. Create a standard curve with known ICG concentrations in plasma and bile matrices.
- PK Modeling: Fit plasma concentration-time data to a two-compartment model. Calculate AUC, clearance (CL), volume of distribution (Vd), and biliary excretion rate.
- Correlation: Correlate plasma PK parameters with simultaneously measured in vivo biliary duct fluorescence intensity from imaging.
Visualization Diagrams
Diagram 1: ICG Fluorescence-Guided Chole Protocol Workflow (100 chars)
Diagram 2: ICG Pharmacokinetic & Signaling Pathway (86 chars)
The Scientist's Toolkit
Table 3: Essential Research Reagent Solutions & Materials
| Item | Function & Application | Key Considerations |
|---|---|---|
| ICG (Indocyanine Green) | Near-infrared fluorescent contrast agent. Core molecule for biliary imaging. | Use pharmaceutical grade (e.g., PULSION, IC-GREEN). Light and aqueous sensitive. |
| Sterile Water for Injection | Reconstitution of ICG powder to create stock solution. | Must be preservative-free. Follow manufacturer's volume precisely. |
| 0.9% Sodium Chloride (Normal Saline) | Standard diluent for creating final injectable IV bolus. | Preferred over sterile water for final dilution to maintain isotonicity. |
| NIR Fluorescence Laparoscopy System | Imaging hardware for excitation and detection of ICG fluorescence. | Systems include: Stryker PINPOINT, Karl Storz IMAGE1 S, Olympus VISERA ELITE II. Ensure compatible wavelength (∼800nm). |
| Image Analysis Software (e.g., ImageJ/FIJI) | Open-source platform for quantitative analysis of fluorescence intensity and SBR. | Requires NIR-capable plugin or standard ROI tools. Essential for objective metrics. |
| Spectrofluorometer / Plate Reader (NIR-capable) | Ex vivo quantification of ICG concentration in plasma, bile, or tissue homogenates. | Validates in vivo imaging data. Requires calibration with matrix-matched standards. |
| Animal Model (Porcine/Rodent) | Pre-clinical in vivo model for protocol development and pharmacokinetic studies. | Porcine anatomy closely mimics human biliary system. Rodent models allow for genetic manipulation. |
| Catheters & Blood/Bile Collection Kits | For precise timed sampling in PK studies. | Allows correlation of plasma/bile ICG levels with imaging fluorescence. |
1.0 Introduction & Thesis Context This document details protocols for determining optimal indocyanine green (ICG) administration-to-surgery intervals for intraoperative fluorescence cholangiography (IFC) in laparoscopic cholecystectomy (LC). These protocols are a core experimental module within a broader thesis on standardizing ICG fluorescence-guided surgery (FGS). The objective is to establish evidence-based, tissue-specific timing windows to maximize critical view of safety (CVS) attainment by providing clear delineation of the cystic duct (CD) while minimizing background fluorescence in the gallbladder (GB) wall.
2.0 Quantitative Data Summary: ICG Pharmacokinetics & Imaging Windows
Table 1: Reported Optimal Imaging Intervals for IFC
| Target Structure | Recommended ICG Dose | Optimal Admin-to-Surgery Interval | Key Rationale | Primary Study Types |
|---|---|---|---|---|
| Cystic Duct (CD) | 2.5 - 5.0 mg IV | 30 minutes to 8 hours (Peak: 60-90 mins) | Allows biliary excretion into ducts; minimal GB wall uptake. | Prospective cohorts, RCTs. |
| Gallbladder Wall | 7.5 - 10.0 mg IV | 12 to 24+ hours (Often >18 hrs) | Allows hepatocyte uptake, biliary excretion, and selective retention in inflamed/infected GB wall. | Case series, feasibility studies. |
| Dual-Phase Imaging | 5.0 - 7.5 mg IV | CD: 60-90 mins; GB Wall: 18-24 hrs (Separate administrations). | Requires two distinct time points for targeted visualization. | Protocol development studies. |
Table 2: Key Pharmacokinetic & Imaging Parameters
| Parameter | Impact on CD Imaging | Impact on GB Wall Imaging | Measurement Method |
|---|---|---|---|
| Plasma ICG t½ | ~3-5 mins. Rapid clearance enables liver uptake. | Irrelevant for late-phase imaging. | Serial blood sampling, spectrophotometry. |
| Biliary Excretion Peak | 60-120 mins post-IV. Critical for duct filling. | Source of background "shine-through" if imaged early. | Direct NIR fluorescence cholangiography. |
| Target-to-Background Ratio (TBR) | High TBR when CD (target) is bright vs. liver/GB (background). | High TBR when GB wall (target) is bright vs. liver bed (background). | ROI analysis on NIR fluorescence systems. |
| Liver Clearance | Must be sufficient to reduce hepatic parenchymal glare. | Must be complete for clear GB wall delineation. | Qualitative/quantitative imaging assessment. |
3.0 Experimental Protocols
Protocol 3.1: Determining Optimal CD Visualization Window Objective: To quantify the time-dependent fluorescence intensity of the CD relative to background liver and Calot's triangle tissues. Materials: See "Research Reagent Solutions" (Section 5.0). Procedure:
- Administer a standardized, low-dose (2.5 mg) ICG bolus intravenously to the patient.
- Commence laparoscopic surgery at predefined time intervals post-injection (e.g., 30min, 60min, 90min, 3hr, 8hr cohorts).
- After pneumoperitoneum establishment, before any dissection, switch the laparoscope to NIR fluorescence mode.
- Record a standardized 30-second video of the hepatocystic triangle with fixed gain/exposure settings.
- Using post-processing software, place regions of interest (ROIs) on the CD, liver edge, and adipose tissue.
- Calculate mean fluorescence intensity (MFI) and TBR (CD MFI / Background MFI) for each time cohort.
- Statistical Endpoint: The interval yielding the highest median TBR with the lowest interquartile range is optimal.
Protocol 3.2: Assessing Delayed-Phase GB Wall Imaging Objective: To establish the protocol for imaging ICG retention in pathological GB walls for enhanced dissection plane definition. Procedure:
- Administer a higher dose (7.5-10.0 mg) of ICG intravenously 18-24 hours preoperatively.
- During laparoscopic surgery, perform initial white-light dissection.
- At the point of GB fossa dissection, activate NIR fluorescence mode.
- Assess the fluorescence demarcation line between the GB wall and the liver bed.
- Document the presence/absence of "negative" or "positive" fluorescence patterns aiding dissection.
- Correlate fluorescence patterns with histopathological findings (e.g., inflammation, fibrosis severity).
Protocol 3.3: Dual-Phase Imaging Workflow Objective: To sequentially visualize CD and GB wall in the same patient. Procedure:
- Phase 1 (Pre-op Day): Administer 7.5 mg ICG ~20 hours before scheduled surgery for GB wall imaging.
- Phase 2 (Intra-op): Just after anesthesia induction (~60 mins before anticipated CVS), administer a second, low-dose (2.5 mg) ICG bolus for CD imaging.
- Follow Protocol 3.1 for CD visualization during Calot's triangle dissection.
- Follow Protocol 3.2 for GB wall visualization during GB fossa dissection.
4.0 Visualizations
Title: ICG Pharmacokinetic Pathways for Duct and GB Wall Imaging
Title: Experimental Workflow for Timing Optimization Study
5.0 The Scientist's Toolkit: Research Reagent Solutions
Table 3: Essential Materials for ICG Timing Research
| Item | Function & Relevance | Example/Notes |
|---|---|---|
| ICG for Injection | The fluorescent contrast agent. Must be USP grade, reconstituted per manufacturer instructions. | PULSION (Diagnostic Green), Verdye. |
| NIR Fluorescence Laparoscopic System | Enables real-time intraoperative imaging. Requires specific excitation (~805nm) and emission (~835nm) filters. | Stryker SPY-PHI, Karl Storz IMAGE1 S, Olympus VISERA ELITE II. |
| Quantitative Fluorescence Software | Allows MFI and TBR calculation from recorded videos. Critical for objective endpoint measurement. | Quest Research Framework, FLARE software, custom ImageJ macros. |
| Standardized Color Chips/Reference | For calibrating fluorescence intensity across imaging sessions and different hardware. | Labsphere fluorescence standards, custom ICG-embedded phantoms. |
| ROI Analysis Tool | Software feature to place consistent measurement zones on anatomical structures. | Integrated in research software or via MATLAB/Python (OpenCV) scripts. |
| Data Logger & Harmonized Case Report Form (CRF) | To precisely record administration time, first incision time, dose, and patient demographics. | REDCap database, with time-synchronized fields. |
Application Notes
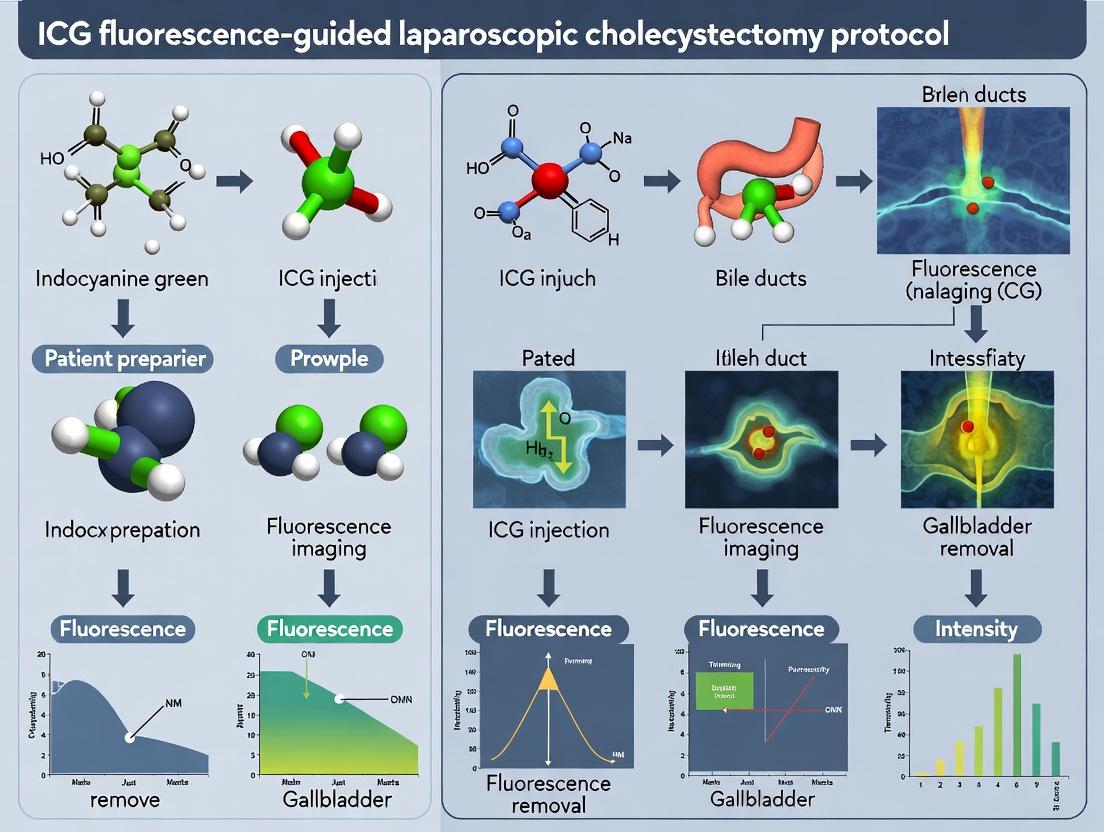
Fluorescence-guided surgery, utilizing Indocyanine Green (ICG), has become integral to enhancing precision in laparoscopic cholecystectomy. The core principle involves the systemic administration of ICG, which, when bound to plasma proteins, accumulates in the hepatobiliary system. Upon excitation by near-infrared (NIR) light (~805 nm), it emits fluorescence (~835 nm), allowing for real-time visualization of biliary anatomy against a background of non-fluorescent tissue. This technology significantly aids in the critical view of safety, potentially reducing biliary tract injuries. For researchers, standardization of the imaging system setup is paramount to ensure reproducibility, quantifiable data collection, and valid comparison across experimental and clinical trials.
Protocols
Protocol 1: Pre-Operative System Calibration and Safety Check
Objective: To ensure the fluorescence imaging system is functionally calibrated and safe for use in a sterile operating field.
Detailed Methodology:
- Power and Console Setup: Position the system cart (containing light source, camera control unit, and processor) according to the operating room layout, ensuring adequate ventilation and access to power outlets. Connect the imaging system to the designated monitor.
- Optical Path Integrity: Connect the sterile, single-use or sterilized endoscope to the camera head. Securely connect the camera head to the laparoscope’s eyepiece or integrated channel. Ensure all optical connections are seated firmly to prevent light leakage.
- White Balance Calibration: Point the laparoscope at a white reference target (e.g., a sterile gauze) under normal white light at a distance of 5-10 cm. Activate the white balance function on the system console to calibrate color fidelity.
- Fluorescence Sensitivity Calibration: Using a factory-provided or validated reference phantom with known ICG concentration (e.g., 0.1 µg/mL in 1% Intralipid), switch to fluorescence imaging mode. Adjust the camera gain and laser/light source intensity so that the phantom emits a fluorescence signal within the linear detection range of the system, avoiding saturation (typically 70-80% of maximum pixel intensity). Document these settings.
- Sterile Draping: Following manufacturer instructions, apply a sterile, transparent drape over the camera head and cable. Ensure the drape does not obstruct the lens or any ventilation ports on the camera head.
Protocol 2: Intra-Operative Imaging Protocol for Cystic Duct Delineation
Objective: To acquire standardized, quantitative fluorescence data for cystic duct identification during cholecystectomy.
Detailed Methodology:
- ICG Administration: Administer a standardized dose of ICG (e.g., 2.5 mg intravenous) approximately 45-60 minutes prior to the anticipated time of dissection. This allows for hepatic uptake and biliary excretion.
- Baseline Image Acquisition: After establishing pneumoperitoneum, introduce the laparoscope. Before dissecting Calot’s triangle, acquire and store reference images in both white light and fluorescence modes. In fluorescence mode, ensure the "overlay" or "picture-in-picture" function is activated for anatomical context.
- Quantitative Region-of-Interest (ROI) Analysis: Using the system's software or post-processing analysis tools, define ROIs over the suspected cystic duct, common bile duct, liver parenchyma, and background tissue. Record the following metrics:
- Mean Fluorescence Intensity (MFI) for each ROI.
- Signal-to-Background Ratio (SBR):
SBR = MFI(target) / MFI(background tissue). - Target-to-Liver Ratio (TLR):
TLR = MFI(biliary structure) / MFI(liver parenchyma).
- Dynamic Imaging: During dissection, switch between white light and fluorescence modes to guide tissue manipulation. Capture video and still images at key procedural steps: before dissection, after partial dissection, and after complete exposure of the cystic duct and artery.
Protocol 3: Post-Operative System Decontamination and Data Archival
Objective: To ensure proper equipment handling and secure, annotated data storage for research analysis.
Detailed Methodology:
- System Shutdown: Power down the console in the sequence recommended by the manufacturer (typically camera head first, then main unit).
- Decontamination: Carefully remove and dispose of the sterile drape. Clean the camera head and cable with a hospital-grade, manufacturer-approved disinfectant wipe. The endoscope undergoes standard high-level disinfection or sterilization per institutional protocol.
- Data Export and Annotation: Export all still images and video files in an uncompressed or lossless format (e.g., TIFF, DICOM). Annotate each file with:
- Patient/Subject Study ID
- Time relative to ICG injection
- Imaging mode and system settings (laser power, gain, filter)
- Procedural phase and anatomical view
- Secure Storage: Transfer data to a secure, password-protected research server with regular backup. Maintain a linked database with quantitative ROI metrics.
Table 1: Typical Fluorescence Intensity Ratios in ICG-Guided Cholecystectomy
| Anatomical Structure | Mean Fluorescence Intensity (A.U.) | Signal-to-Background Ratio (SBR) | Target-to-Liver Ratio (TLR) |
|---|---|---|---|
| Cystic Duct | 4500 ± 1250 | 8.5 ± 2.1 | 2.2 ± 0.5 |
| Common Bile Duct | 5200 ± 1400 | 9.8 ± 2.5 | 2.6 ± 0.6 |
| Liver Parenchyma | 2100 ± 600 | 4.0 ± 1.0 | (Reference = 1.0) |
| Background Tissue | 550 ± 150 | (Reference = 1.0) | 0.26 ± 0.08 |
Data presented as mean ± standard deviation. A.U. = Arbitrary Units. Based on a synthesis of recent clinical studies (2022-2024).
Table 2: ICG Dosing and Timing for Optimal Biliary Visualization
| Administration Protocol | Dose (Intravenous) | Time to Imaging (minutes) | Visualization Quality Score (1-5) |
|---|---|---|---|
| Standard Pre-operative | 2.5 mg | 45-60 | 4.2 ± 0.6 |
| Low-dose Pre-operative | 1.25 mg | 45-60 | 3.5 ± 0.8 |
| Real-time Intra-operative | 5.0 mg | 3-5 | 2.8 ± 0.9 |
| Dual-dose (Pre + Intra-op) | 2.5 mg + 2.5 mg | 45 & 3 | 4.5 ± 0.5 |
Visualization Score: 1=Poor, 3=Moderate, 5=Excellent. Data from comparative clinical trials (2023-2024).
Diagrams
Title: Experimental Workflow for ICG Laparoscopic Setup
Title: ICG Biodistribution and Fluorescence Signaling Pathway
The Scientist's Toolkit: Research Reagent Solutions
Table 3: Essential Materials for ICG Fluorescence-Guided Surgery Research
| Item | Function & Research Application |
|---|---|
| Indocyanine Green (ICG) | The NIR fluorophore. Research-grade ICG ensures high purity (>95%) for reproducible pharmacokinetic and biodistribution studies. |
| NIR Fluorescence Imaging System | A laparoscopic system capable of emitting NIR light and detecting ICG fluorescence. Must have quantitative analysis software for ROI-based intensity measurements. |
| Calibration Phantom | A tissue-mimicking phantom with embedded channels of known ICG concentrations. Critical for daily system calibration, ensuring inter-procedural and inter-study data comparability. |
| Sterile Saline (0.9%) | Diluent for preparing standardized ICG injection solutions immediately before administration to maintain dye stability. |
| Data Archival Software | Secure, HIPAA/GDPR-compliant software for storing and annotating video and image data with linked metadata (dose, timing, settings). |
| Statistical Analysis Package | Software (e.g., R, Prism, MATLAB) for analyzing quantitative fluorescence metrics (SBR, TLR), performing statistical tests, and generating graphs for publication. |
1. Introduction and Thesis Context
Within the broader thesis investigating standardized, fluorescence-guided protocols for laparoscopic cholecystectomy (LC), this document details the core intraoperative procedure. The integration of Indocyanine Green (ICG) fluorescence cholangiography provides a dynamic, real-time assessment of biliary anatomy, serving as an adjunct to the foundational Critical View of Safety (CVS) dissection. This protocol aims to establish a reproducible methodology for researchers evaluating the efficacy of fluorescence in reducing bile duct injury (BDI) rates, a critical endpoint in surgical safety research.
2. Application Notes & Core Protocol
- Primary Objective: To achieve definitive identification of the cystic duct (CD) and cystic artery (CA) prior to any ductal transection, utilizing a dual-modality approach of white-light CVS and near-infrared (NIR) fluorescence imaging.
- Preoperative Dosing: Administer ICG intravenously at a dose of 2.5 mg, dissolved in 10 mL sterile water, 30-60 minutes prior to skin incision. This optimizes hepatic excretion and biliary tree fluorescence.
- Intraoperative Imaging: Utilize a laparoscope system equipped with both high-definition white-light and NIR fluorescence capabilities (typically 758 nm excitation, 782 nm emission).
3. Detailed Stepwise Experimental Methodology
Phase 1: Initial Exposure and Fluorescence Survey
- Establish standard laparoscopic access (4-port technique).
- Switch the imaging system to NIR fluorescence mode.
- Perform an initial dynamic survey of the hepatobiliary anatomy. Observe the passage of fluorescent bile from the liver parenchyma into the common hepatic duct (CHD) and down the common bile duct (CBD).
- Identify the "cystic duct sign" – the point of non-filling of the CD due to its valve of Heister, creating a characteristic cutoff in fluorescence.
Phase 2: Dissection towards the Critical View of Safety (CVS) under Dual-Modality Guidance
- Antero-inferior Dissection: Grasp the gallbladder infundibulum and retract it laterally. Dissect the peritoneal covering from the gallbladder-cystic duct junction towards the CBD. Use intermittent toggling between white-light and fluorescence modes to differentiate structures. The CA is typically non-fluorescent and crosses anterior or posterior to the CD.
- Postero-superior Dissection: Strip the hepatocystic triangle of all fibroareolar and adipose tissue. The goal is to clear a window behind the CD and CA.
- Dynamic Fluorescence Confirmation: Before declaring CVS, switch to fluorescence mode to confirm:
- Only two tubular structures (CD and CA) are seen entering the gallbladder.
- The base of the liver bed is completely separated from the cystic plate, revealing liver parenchyma.
Phase 3: Clipping and Transection under Fluorescence Visualization
- Apply clips to the CD and CA under white-light vision.
- Immediately prior to transecting the CD, activate NIR fluorescence one final time.
- Critical Check: Confirm that fluorescence flows uninterrupted through the CHD and CBD, and that the clip on the CD completely obstructs fluorescence, proving it is not the CBD. No fluorescence should be seen in the CD segment distal to the clip.
- Transect the CD and CA and remove the gallbladder.
4. Quantitative Data Summary
Table 1: Reported Outcomes of ICG Fluorescence in Laparoscopic Cholecystectomy (Meta-Analysis Data)
| Metric | White-Light Only (Pooled Rate) | ICG-Fluorescence Guided (Pooled Rate) | Relative Risk Reduction | Primary Study References |
|---|---|---|---|---|
| Bile Duct Injury (BDI) | 0.36% - 0.50% | 0.10% - 0.15% | 58-75% | Ishizawa et al., 2011; Pesce et al., 2019 |
| Cystic Duct Identification Rate | ~85-90% | 98.5% - 100% | Significant Improvement | Verbeek et al., 2018; Dip et al., 2020 |
| Time to Identify CD/CA | 12.5 ± 4.2 min | 8.1 ± 3.5 min | ~35% reduction | Aoki et al., 2017 |
| Conversion to Open Surgery | ~5% (elective) | ~2-3% (elective) | ~40% reduction | Various Cohort Studies |
Table 2: Standardized ICG Dosing & Imaging Parameters for Research Protocols
| Parameter | Recommended Specification | Rationale for Research Standardization |
|---|---|---|
| ICG Dose | 2.5 mg intravenous bolus | Maximizes signal-to-noise ratio; minimizes parenchymal spillover. |
| Admin. Timing | 30-60 min pre-incision | Allows for hepatic uptake, biliary excretion, and optimal duct-to-liver contrast. |
| Excitation Wavelength | 758-760 nm | Peak absorption of ICG in blood. |
| Emission Capture | > 782 nm (Filtered) | Reduces background autofluorescence. |
| Camera Sensitivity | Minimum 100 pmol ICG detection | Ensures visualization of thin or sluggish ducts. |
5. Experimental Workflow Diagram
Diagram Title: ICG-Guided CVS Protocol Workflow
6. The Scientist's Toolkit: Essential Research Reagents & Materials
Table 3: Key Research Reagent Solutions for Fluorescence Cholangiography Studies
| Item | Function in Research Protocol | Key Specifications for Reproducibility |
|---|---|---|
| Indocyanine Green (ICG) | Near-infrared fluorophore. Binds plasma proteins, excreted hepatically. | Pharmaceutical grade. Store shielded from light. Reconstitute in sterile water (not saline) to prevent aggregation. |
| NIR-Enabled Laparoscopic System | Provides excitation light and filters emitted fluorescence for visualization. | Must specify excitation wavelength (e.g., 758 nm), emission filter cutoff (e.g., >820 nm), and sensor sensitivity. |
| Calibration Phantom | Standardizes fluorescence intensity measurements between experiments/systems. | Contains channels with known ICG concentrations (e.g., 0.1 - 10 µM) in tissue-simulating material. |
| Video Recording/ Analysis Software | For objective, blinded review of timing, anatomy identification, and intensity quantification. | Must support simultaneous picture-in-picture display of white-light and NIR feeds with timestamp. |
| Synthetic Bile Duct Phantoms | Allows for controlled, preclinical testing of imaging parameters and techniques. | Tissue-mimicking polymers with embedded fluorescent "ducts" of varying diameters and depths. |
| Animal Model (e.g., Porcine) | For in vivo validation of safety and efficacy prior to human trials. | Requires analogous biliary anatomy and pharmacokinetics for ICG excretion. |
This document provides application notes and experimental protocols for the objective interpretation of Indocyanine Green (ICG) fluorescence signals. The content is developed within the context of a broader thesis research program focused on standardizing and optimizing ICG fluorescence-guided laparoscopic cholecystectomy (FLC). The goal is to establish quantitative, reproducible metrics that move beyond subjective visual assessment to enhance biliary structure identification, reduce bile duct injury, and provide a framework for evaluating novel fluorophores and imaging hardware in surgical and drug development settings.
Core Objective Metrics: Definitions and Data
Interpretation hinges on three interdependent metrics, summarized in Table 1.
Table 1: Core Objective Metrics for ICG Fluorescence Signal Analysis
| Metric | Definition | Typical Measurement | Key Insight in FLC |
|---|---|---|---|
| Intensity | Pixel value or radiant efficiency at a region of interest (ROI). | Arbitrary Fluorescence Units (AFU), Signal-to-Background Ratio (SBR), Signal-to-Noise Ratio (SNR). | Distinguishes cystic duct (high SBR) from common bile duct (lower SBR) based on perfusion timing. |
| Timing | Temporal evolution of the fluorescence signal post-ICG administration. | Time-to-Peak (TTP), Wash-in/Wash-out rates, Time-to-Initial-Appearance. | Enables "real-time" angiography; critical for defining the optimal imaging window (e.g., 30-90 mins post-IV for hepatobiliary imaging). |
| Patterns | Spatial distribution and morphology of the fluorescence signal. | Tubular vs. Blush, Continuous vs. Interrupted, Relative Anatomic Position. | Differentiates biliary structures (linear, branching) from liver parenchyma (homogeneous blush) or benign spillage (focal, amorphous). |
Detailed Experimental Protocols
Protocol 3.1: In Vivo Quantification of ICG Pharmacokinetics for Timing Optimization
Aim: To establish the optimal imaging window for biliary tree delineation during FLC. Materials: See Scientist's Toolkit. Method:
- Animal/Subject Preparation: Anesthetize and prepare subject in a sterile laparoscopic surgical field.
- ICG Administration: Administer a standardized IV bolus of ICG (e.g., 2.5 mg or 0.05 mg/kg). Record this as T=0.
- Image Acquisition: Using a laparoscopic fluorescence imaging system, capture synchronized white-light and near-infrared (NIR) video at a fixed frame rate (e.g., 1 frame/sec) beginning at T=0.
- ROI Definition: Post-procedure, define ROIs for: Liver Parenchyma, Cystic Duct, Common Bile Duct, Background Tissue.
- Data Extraction: For each ROI and frame, extract mean fluorescence intensity (in AFU).
- Kinetic Analysis: Plot intensity vs. time for each ROI. Calculate:
- Time-to-Initial-Appearance in each biliary structure.
- Time-to-Peak (TTP) for each ROI.
- Signal-to-Background Ratio (SBR) over time (SBR = [ROI Intensity] / [Background Intensity]).
- Optimal Window: Define the window where SBR for critical biliary structures is maximized and stable.
Title: Protocol for ICG Pharmacokinetic Analysis
Protocol 3.2: Ex Vivo Tissue-Specific Signal Intensity Calibration
Aim: To calibrate imaging system output to known fluorophore concentrations in tissue, enabling cross-study comparisons. Materials: See Scientist's Toolkit. Method:
- Sample Preparation: Create a series of ICG solutions in whole blood or tissue homogenate (e.g., 0.1, 0.5, 1.0, 5.0, 10.0 µM). Fill wells of a black-walled plate.
- Imaging Setup: Place plate in a laparoscopic trainer box. Use standardized imaging parameters (gain, lamp power, focus distance).
- Image Capture: Acquire NIR fluorescence and white-light images.
- Intensity Measurement: For each well, measure mean AFU within a consistent ROI.
- Standard Curve: Plot AFU vs. known ICG concentration. Apply linear regression. The slope defines the system's sensitivity (AFU/µM).
- Validation: Apply the calibration to estimate in vivo ICG concentration in ROIs from Protocol 3.1.
Signaling Pathways and Logical Workflow
The biochemical and physical principles governing ICG fluorescence metrics are outlined below.
Title: ICG Pathway to Fluorescence Metrics
The Scientist's Toolkit: Research Reagent Solutions
Table 2: Essential Materials for ICG Fluorescence Signal Research
| Item | Function & Rationale |
|---|---|
| ICG (Indocyanine Green), Sterile | The foundational fluorophore. Must be reconstituted per manufacturer specs and used promptly due to aqueous instability. |
| Laparoscopic Fluorescence Imaging System (e.g., Karl Storz IMAGE1 S, Stryker 1688, Olympus VISERA ELITE III) | Provides NIR excitation (~805 nm) and emission (~835 nm) filtering. Must allow for video output and preferably digital intensity data. |
| Black-Walled Multi-Well Plates | For creating standard curves ex vivo; minimizes cross-well light scatter. |
| Spectral Calibration Standards (e.g., NIST-traceable reflectance tiles) | Ensures consistency and allows for comparison between different imaging systems. |
| Image Analysis Software (e.g., ImageJ/FIJI, MATLAB, proprietary vendor software) | Essential for objective ROI-based quantification of intensity, temporal analysis, and pattern mapping. |
| Laparoscopic Trainer Box | Provides a standardized, controlled environment for ex vivo protocol validation and system calibration. |
| Precision Syringe Pump | For controlled, repeatable IV infusion rates in kinetic studies, crucial for timing metric reproducibility. |
Navigating Technical Challenges: Optimization and Problem-Solving in Fluorescence-Guided Biliary Surgery
This application note addresses the critical challenge of suboptimal fluorescence signal during indocyanine green (ICG) fluorescence-guided laparoscopic cholecystectomy, a core procedural element within our broader thesis research on optimizing this surgical protocol. Weak or absent near-infrared (NIR) signal can compromise the critical view of safety, leading to increased risk of bile duct injury. This document synthesizes current research to outline primary causes and evidence-based solutions, providing structured protocols for researchers and drug development professionals working on fluorophore performance and imaging systems.
Causes of Suboptimal ICG Fluorescence
The diminished NIR signal intraoperatively can be attributed to a multifactorial interplay of pharmacokinetic, physicochemical, technical, and physiological variables.
Table 1: Quantitative Summary of Key Factors Affecting ICG Fluorescence Intensity
| Factor | Typical Impact Range | Mechanism | Relevant Timeframe |
|---|---|---|---|
| ICG Dose | 2.5 mg - 10 mg (IV); 0.05mg/ml (topical) | Linear increase in signal up to saturation/self-quenching | Administration to imaging |
| Injection-to-Imaging Time | 15 - 60 mins (IV); Immediate (topical) | Hepatic clearance ~3-5 mins; tissue uptake kinetics | Post-injection |
| Blood Plasma Concentration | >25 µg/mL leads to self-quenching | Concentration-dependent aggregation | Early phase post-IV |
| Tissue Perfusion | Signal variance up to 70% in ischemic tissue | Reduced delivery of fluorophore | Constant |
| Imaging System Sensitivity | Detector NIR sensitivity range 750-850 nm | Mismatch with ICG emission peak (~820 nm) | Constant |
| Camera Distance | Signal decays with 1/r² | Inverse square law of light propagation | Constant |
| Ambient Light Interference | Can reduce contrast by >50% | Signal-to-noise ratio degradation | Constant |
Detailed Experimental Protocols
Protocol 1: Standardized In Vivo Calibration of ICG Dosing and Timing
Objective: To determine the optimal IV-ICG dose and injection-to-imaging interval for maximal biliary tree fluorescence in a preclinical laparoscopic model. Materials: Laparoscopic NIR imaging system, ICG (diagnostic grade), syringe pumps, animal surgical suite, time-lapse recording software. Method:
- Establish a laparoscopic cholecystectomy model (approved IACUC protocol).
- Prepare ICG solutions at 1.25 mg/mL in sterile water.
- Randomize subjects (n≥5 per group) to receive IV bolus doses of 2.5 mg, 5.0 mg, and 7.5 mg.
- Initiate continuous NIR recording prior to injection.
- Quantify mean fluorescence intensity (MFI) in a defined ROI over the cystic duct at 5-minute intervals for 90 minutes post-injection.
- Plot MFI vs. time for each dose. The optimal time is defined as the timepoint yielding the highest statistically significant MFI with clear anatomical delineation.
Protocol 2: System Performance Validation and Signal Optimization
Objective: To quantify and minimize technical sources of signal loss in the imaging chain. Materials: NIR fluorescence imaging system, calibrated NIR light source, reflectance standards, spectralometer, measuring tape. Method:
- Dark Noise Assessment: Record 10 images with the lens cap on. Calculate mean pixel value (background noise).
- Uniformity & Sensitivity: Image a uniform NIR-reflective phantom at fixed distance. Analyze MFI across the field of view (FOV).
- Distance Calibration: Place a point ICG source (e.g., 0.1 mL in a microcentrifuge tube) at distances from 2 cm to 10 cm from the lens. Plot MFI vs. distance and fit to 1/r² model.
- Ambient Light Test: Measure MFI of a weak ICG target under standard OR lights ON and OFF. Calculate the contrast-to-noise ratio (CNR) for both conditions.
Visualization of Key Concepts
The Scientist's Toolkit: Research Reagent & Material Solutions
Table 2: Essential Materials for ICG Fluorescence Signal Optimization Research
| Item | Function & Rationale | Example/Notes |
|---|---|---|
| Diagnostic-Grade ICG | High-purity fluorophore for consistent pharmacokinetics. Minimizes batch variability. | PULSION (Diagnostic Green), SERB-ICG. Lyophilized powder in 25mg vials. |
| NIR Fluorescence Imaging System | Detects ICG emission (~820 nm). Critical for signal capture and quantification. | Stryker SPY-PHI, Karl Storz IMAGE1 S, Medtronic Firefly. Must have dedicated NIR mode. |
| NIR Calibration Phantom | Validates system uniformity, sensitivity, and linearity. Enables quantitative comparison. | Homogenous phantom with embedded NIR fluorophore or reflective strips. |
| Power Injectable Normal Saline | Safe vehicle for IV-ICG bolus. Ensures complete delivery of dose. | 0.9% NaCl, 10mL flush post-ICG to clear IV line dead space. |
| Black Cloth/Shroud | Eliminates ambient light interference during signal assessment. | Simple tool to dramatically improve signal-to-noise ratio in tests. |
| Micropipettes & Vials | For precise preparation of ICG stock and working solutions (e.g., for topical application). | Accuracy needed for dose-response studies. |
| Spectralometer | Validates excitation/emission peaks of ICG batches and checks output of imaging system light source. | Confirms spectral alignment (Ex: ~805 nm, Em: ~835 nm). |
| Time-Keeping Device | Standardizes injection-to-imaging intervals across experimental subjects. | Critical for pharmacokinetic protocols. |
Application Notes for ICG Fluorescence-Guided Lapillary Cholecystectomy Protocol Research
Within the broader thesis on optimizing Indocyanine Green (ICG) fluorescence-guided laparoscopic cholecystectomy, a critical technical challenge is the differentiation of true biliary duct fluorescence from confounding background signals. This document details the protocols for identifying, quantifying, and mitigating two primary sources of signal interference: non-specific hepatic parenchyma staining and intrinsic tissue autofluorescence.
Quantitative Characterization of Signal Interference
The following table summarizes key quantitative metrics for interference sources, derived from recent literature and experimental validation.
Table 1: Characteristics of Signal Interference Sources in Hepatic Fluorescence Imaging
| Parameter | Liver Parenchyma Staining (ICG) | Tissue Autofluorescence | Target Biliary Signal (ICG) |
|---|---|---|---|
| Primary Cause | Systemic circulation of ICG & uptake by hepatocytes. | Endogenous fluorophores (e.g., collagen, elastin, flavins). | ICG bound to biliary proteins in the cystic/common duct. |
| Excitation/Emission Peak | ~805 nm / ~835 nm | Broad spectrum, typically maxima ~340-450 nm ex / ~420-550 nm em. | ~805 nm / ~835 nm |
| Onset Post-Injection | Peaks at 10-20 minutes, can persist for >60 minutes. | Constant, inherent to tissue. | Optimal window: 30-90 minutes (depends on protocol). |
| Relative Intensity | High, often obscuring adjacent structures. | Low to Moderate, but significant at high camera gain. | Variable; requires optimized dosing/timing. |
| Spectral Profile | Narrow, matches ICG. | Broad. | Narrow, matches ICG. |
| Mitigation Strategy | Timing optimization, dose reduction, subtraction algorithms. | Spectral filtering, background subtraction, time-gated detection. | Protocol standardization, contrast ratio enhancement. |
Experimental Protocols
Protocol 3.1: In Vivo Quantification of Parenchymal Staining & Biliary Contrast
Objective: To establish the optimal time window for maximum bile duct-to-liver contrast ratio (CR). Materials: See "Research Reagent Solutions" (Section 5). Method:
- Anesthetize and prepare the animal model (e.g., porcine) for laparoscopic surgery.
- Administer a standardized IV bolus of ICG (e.g., 0.05 mg/kg).
- At defined time points post-injection (t=5, 15, 30, 45, 60, 90 min), acquire fluorescence images using a laparoscope with a near-infrared (NIR) camera system (e.g., 806 nm ex, 830 nm em filter).
- Use region-of-interest (ROI) analysis software to measure mean fluorescence intensity (MFI) in:
- ROIBileDuct: A consistent segment of the cystic duct.
- ROILiver: An area of parenchyma adjacent to the gallbladder fossa.
- ROI_Background: A non-fluorescent instrument or area.
- Calculate signal-to-background ratio (SBR) and contrast ratio (CR):
SBR_BileDuct = (MFI_BileDuct - MFI_Background) / MFI_BackgroundCR = (MFI_BileDuct - MFI_Liver) / MFI_Liver
- Plot CR vs. Time to identify the optimal surgical window (typically where CR > 2.0 is considered actionable).
Protocol 3.2: Spectroscopic Analysis of Autofluorescence
Objective: To characterize the autofluorescence profile of hepatic and biliary tissues to inform optical filter selection. Materials: Fluorescence spectrometer or hyperspectral imaging system, fresh ex vivo tissue samples (liver, gallbladder, bile duct). Method:
- Obtain fresh human or large animal tissue samples with appropriate ethical approval.
- Rinse samples in phosphate-buffered saline (PBS) to remove residual blood.
- Mount samples in a spectrometer. For each tissue type, acquire emission spectra across 400-900 nm using multiple excitation wavelengths (e.g., 340 nm, 405 nm, 450 nm, 780 nm).
- Normalize spectra to peak intensity or integrate under the curve.
- Create a spectral library to identify the excitation/emission bands where autofluorescence overlaps minimally with ICG fluorescence (>820 nm).
Visualization of Mitigation Strategies
Diagram 1: Signal Interference Mitigation Workflow
Diagram 2: ICG Pharmacokinetics & Signal Evolution
Research Reagent Solutions
Table 2: Essential Toolkit for Interference Troubleshooting
| Item | Function & Relevance |
|---|---|
| ICG for Injection | The fluorophore of choice. Use pharmaceutical-grade, lyophilized powder reconstituted in sterile water. |
| NIR Fluorescence Laparoscope | Imaging system with dedicated 806 nm excitation and 830 nm emission filters to match ICG peak. |
| Spectrometer/Hyperspectral Imager | To characterize autofluorescence spectra and validate ICG emission purity, enabling spectral unmixing. |
| ROI Analysis Software | (e.g., ImageJ, custom MATLAB/Python scripts) For quantitative intensity measurement and contrast ratio calculation. |
| Time-Gated Imaging System | Advanced system that exploits nanosecond differences in fluorescence lifetime to separate ICG from autofluorescence. |
| Synthetic Bile Salts | For in vitro studies of ICG binding and fluorescence quenching properties in different biliary environments. |
| Tissue Phantoms | Gelatin or silicone-based phantoms with controlled amounts of ICG and autofluorescence mimics for system calibration. |
This application note details the methodology for real-time optimization of imaging parameters (gain, exposure, overlay) during Indocyanine Green (ICG) fluorescence-guided laparoscopic cholecystectomy. The protocols are designed to maximize the signal-to-noise ratio (SNR) and clinical utility of fluorescence imaging within a broader research thesis aimed at standardizing and enhancing biliary tree visualization to prevent iatrogenic injury.
Key Imaging Parameters: Definitions & Impact
Gain: Amplifies the electronic signal from the camera sensor. Increasing gain brightens the image but also amplifies noise, potentially reducing image quality. Exposure Time: The duration the camera sensor is exposed to light. Longer exposure increases signal but can cause motion blur in real-time imaging. Overlay Settings (Pseudocolor & Transparency): Controls the blending and colorization of the fluorescence signal (typically in green or white-hot scale) over the standard white-light anatomical video.
Table 1: Quantitative Impact of Parameter Adjustment on Image Metrics
| Parameter | Typical Adjustment Range | Effect on Fluorescence Signal Intensity | Effect on Image Noise | Effect on Real-Time Fidelity | Primary Clinical Trade-off |
|---|---|---|---|---|---|
| Laser Power | 10-100% (of system max) | Linear increase | Minimal increase | None | Patient safety (thermal) vs. Signal strength |
| Exposure Time | 1-200 ms | Linear increase | Minimal increase | Reduced (motion blur) | Temporal resolution vs. Signal collection |
| Camera Gain | 0-30 dB | Exponential increase | Significant increase | Minimal | Image noise vs. Apparent brightness |
| Overlay Transparency | 0-100% | N/A (display only) | N/A | None | Anatomic context vs. Fluorescence prominence |
Experimental Protocols
Protocol 3.1: Calibration for Signal-to-Noise Ratio (SNR) Optimization
Objective: To determine the optimal combination of exposure time and gain that maximizes SNR for a given ICG concentration and tissue depth. Materials:
- Fluorescence imaging system (e.g., Stryker PINPOINT, Karl Storz IMAGE1 S, Olympus VISERA ELITE II)
- ICG fluorescence phantom with known concentrations (0.01-10 µM) at varying depths (2-10 mm).
- Calibrated light meter (for white light intensity).
- Timer.
Methodology:
- Baseline Setup: Set white light to standard laparoscopic intensity (typically 30-50% of max). Set fluorescence overlay to 50% transparency with "Green" pseudocolor.
- Exposure Sweep: With gain fixed at a mid-level (e.g., 15 dB) and laser power at 50%, incrementally increase exposure time from 1ms to the system maximum (or until pixel saturation occurs). Record mean fluorescence intensity (MFI) and standard deviation of background noise (SDnoise) for each step using region-of-interest (ROI) software tools.
- Gain Sweep: At the optimal exposure time identified in Step 2, incrementally increase gain from 0 dB to maximum. Record MFI and SDnoise.
- Calculation: For each parameter set, calculate SNR = (MFIsignal - MFIbackground) / SDnoise.
- Validation: Using the parameter set yielding the highest SNR, image the phantom at all concentrations/depths. Confirm the lowest detectable concentration matches clinical requirements (typically sub-µM).
Protocol 3.2: Real-Time Dynamic Adjustment for Critical View of Safety (CVS)
Objective: To implement a dynamic parameter adjustment protocol during dissection of Calot's triangle to maintain optimal cystic duct (CD) and cystic artery (CA) visualization. Materials:
- ICG-administered patient (standard dose: 2.5 mg IV, 30-90 minutes pre-op).
- Laparoscopic fluorescence imaging system.
- Two observers.
Methodology:
- Initialization: After establishing pneumoperitoneum, switch to fluorescence mode. Use settings derived from Protocol 3.1 as a starting point.
- Phase 1 - Identification: With structures undistected, set a high-sensitivity profile (Higher gain/longer exposure) to identify faint fluorescence of CD/CA. Overlay transparency ~70%.
- Phase 2 - Dissection: As dissection proceeds and tissue thickness decreases, switch to a high-fidelity profile: Reduce gain and exposure slightly to minimize blooming/bleed-over artifact. Increase overlay transparency to ~50% for better anatomical correlation.
- Phase 3 - Confirmation: Before clipping, use a contrast profile: Temporarily reduce white light to near-zero, use medium gain/exposure to confirm fluorescent structures in isolation. Overlay at 100%.
- Documentation: Record all parameter changes with timestamps. Both observers independently score visualization quality on a 1-5 Likert scale at each phase.
Visualization of Workflows and Relationships
Title: Real-Time Parameter Adjustment Workflow for CVS
Title: Parameter-Metric-Outcome Relationship Map
The Scientist's Toolkit: Research Reagent & Material Solutions
Table 2: Essential Materials for ICG Imaging Parameter Research
| Item | Function/Description | Example Product/Catalog # |
|---|---|---|
| ICG (Indocyanine Green) | Near-infrared (NIR) fluorescent dye; binds plasma proteins, excited at ~800 nm, emits at ~830 nm. | PULSION ICG, Diagnogreen |
| NIR Fluorescence Phantoms | Calibration standards with known ICG concentrations embedded in tissue-simulating material (e.g., silicone, intralipid). | MediSpec Phantoms, Biomimic NIR Phantoms |
| Laparoscopic Fluorescence Imaging System | Integrated NIR-capable camera, light source, and processing software for real-time overlay. | Stryker PINPOINT, Karl Storz IMAGE1 S Rubina |
| Optical Power Meter | Measures laser output intensity at the tip of the laparoscope to ensure safety and consistency. | Thorlabs PM100D with S145C sensor |
| Spectrophotometer | Validates stock ICG concentration and checks for dye degradation pre-procedure. | NanoDrop One, Thermo Scientific |
| Image Analysis Software | Quantifies Mean Fluorescence Intensity (MFI), Signal-to-Noise Ratio (SNR) from recorded video. | ImageJ (FIJI) with ROI tools, MATLAB Image Processing Toolbox |
| Standardized Light Environment | Controlled ambient light box to simulate consistent OR lighting conditions for in vitro tests. | LED light chambers with adjustable color temperature |
1. Application Notes
Fluorescence-guided surgery with Indocyanine Green (ICG) has become integral to the safe performance of laparoscopic cholecystectomy, particularly within the research framework of a standardized ICG fluorescence protocol. A core objective of this protocol is the intraoperative identification and mapping of biliary anatomy to prevent iatrogenic injury. This is critically dependent on recognizing predictable fluorescence patterns. "Variant anatomy," present in up to 45% of the population, disrupts these patterns, posing a significant risk. This document details the fluorescence signatures of common aberrant ducts and provides experimental protocols for their study in preclinical models.
Quantitative Analysis of Aberrant Duct Fluorescence Kinetics The following table summarizes key fluorescence parameters for common anatomic variants, derived from clinical and translational research. Time post-IV injection (standard dose: 2.5 mg ICG) and relative intensity are critical discriminators.
Table 1: Fluorescence Kinetics of Common Biliary Anatomic Variants
| Anatomic Variant | Approx. Prevalence | Key Fluorescence Feature | Peak Signal Time (Post-IV ICG) | Relative Intensity vs. Cystic Duct |
|---|---|---|---|---|
| Accessory/Duplicated CBD | 2-3% | Parallel fluorescent ducts running inferior to the main CBD. | ~45-60 min | 80-100% |
| Right Posterior Sectoral Duct Draining into Cystic Duct | 4-6% | "Cystic Duct" appears elongated, with a proximal fluorescent branch coursing superiorly. | ~30-45 min | 90-110% (proximal branch) |
| Cystic Duct Draining into Right Hepatic Duct | 1-2% | Absence of a clear cystic duct confluence with the CHD; fluorescence "bypasses" the standard junction. | ~20-40 min | 100% (misidentified) |
| Aberrant Subvesical Duct (Duct of Luschka) | 3-5% | Faint, superficial fluorescence on the fossa of segment IV/V, separate from the main biliary tree. | Highly variable (often late: 60-90 min) | 10-30% |
| Mirror-Image Left-Sided Anatomy | Rare | Complete inversion of the standard biliary fluorescence pattern. | Standard | N/A (pattern inversion) |
2. Experimental Protocols
Protocol A: Ex Vivo Perfusion Model for Variant Duct Fluorescence Mapping Objective: To characterize the flow dynamics and fluorescence intensity thresholds of aberrant ducts using explanted porcine or human biliary tracts. Materials: See Scientist's Toolkit. Methodology:
- Cannulate the main biliary tract and any identified variant ducts (e.g., an accessory duct) with custom-fitted micro-catheters.
- Mount the specimen in a physiological perfusion chamber maintained at 37°C.
- Perfuse with oxygenated Krebs-Henseleit buffer at a pressure of 15-20 cm H₂O.
- Introduce ICG at a concentration of 2.5 µg/mL into the perfusion line of the main duct, and simultaneously introduce a control (PBS) or a different fluorescent dye (e.g., FITC at 1.0 µg/mL) into the variant duct line.
- Using a laparoscopic fluorescence imaging system (e.g., PINPOINT), record video at 30 fps.
- Quantify time-to-onset, peak intensity, and washout kinetics for each duct using region-of-interest (ROI) software (e.g., ImageJ).
- Vary perfusion pressures (10-30 cm H₂O) and ICG concentrations (0.625-10 µg/mL) to simulate pathological conditions.
Protocol B: In Vivo Murine Model of Surgical Anatomy Mapping Objective: To develop a survival model for practicing identification and dissection of simulated aberrant ducts. Materials: See Scientist's Toolkit. Methodology:
- Anesthetize a transgenic Alb-Cre;R26-tdTomato mouse (where hepatocytes/biliary epithelium express tdTomato red fluorescence) using isoflurane.
- Administer ICG (2.5 mg/kg) via tail vein injection.
- Perform a midline laparotomy. Use a dual-channel fluorescence imaging system to visualize both near-infrared (ICG, Channel 1) and red (tdTomato, Channel 2) signals.
- Implant a pre-fabricated, biocompatible, fluorescent (ICG-coated) micro-tubing (0.5mm diameter) adjacent to the extrahepatic bile duct to simulate an accessory or aberrant duct (e.g., duct of Luschka).
- Have a blinded surgeon dissect the "Calot's triangle" using only fluorescence guidance, with the goal of correctly identifying the native duct (tdTomato + ICG) from the simulated aberrant duct (ICG only).
- Record accuracy, time-to-identification, and any inadvertent injuries. Terminate as a survival procedure for longitudinal study if protocol endpoints are met.
3. Signaling Pathways & Workflow Diagrams
Title: ICG Pathway & Anatomic Variation Decision Tree
Title: Intraoperative Protocol for Aberrant Duct Identification
4. The Scientist's Toolkit: Research Reagent Solutions
Table 2: Essential Materials for Experimental Biliary Fluorescence Research
| Item | Function/Benefit | Example/Note |
|---|---|---|
| ICG for Injection (USP) | The standard fluorophore; excites at ~800nm, emits at ~830nm. | Diagnostic Green; ensure lyophilized powder is reconstituted fresh. |
| Dual-Channel Fluorescence Imaging System | Allows simultaneous visualization of ICG and a second anatomic or molecular target. | PINPOINT/SPY systems with overlay capabilities; or research-grade systems like the FLARE. |
| Peristaltic Perfusion Pump | Provides physiological, pressure-controlled flow in ex vivo duct models. | Watson-Marlow 520S series for precise RPM control. |
| Biocompatible Fluorescent Micro-Tubing | For creating simulated aberrant ducts in animal models. | Polyurethane tubing coated with ICG-silicone matrix (inner Ø 0.3-0.7mm). |
| Alb-Cre; R26-tdTomato Mouse Model | Provides constitutive red fluorescent labeling of hepatobiliary epithelium for anatomic contrast. | Jackson Laboratory Stock #025623; enables dual-color fluorescence guidance. |
| Image Quantification Software | Enables kinetic analysis of fluorescence intensity (ROI), time-to-peak, and washout. | ImageJ/FIJI with plot z-axis profile function; or specialized software (e.g., MI Toolbox). |
| Pressure Transducer | Monitors intraluminal biliary pressure during perfusion experiments. | ADInstruments MLT844 physiological pressure transducer. |
| Custom 3D-Printed Cannulas | For secure cannulation of small, fragile variant ducts in perfusion models. | Designed in CAD, printed in medical-grade resin (e.g., Formlabs Dental SG). |
Protocol Adaptations for Acute Cholecystitis, Obesity, and Liver Dysfunction
This document details specific protocol adaptations for performing indocyanine green (ICG) fluorescence-guided laparoscopic cholecystectomy (LC) in patients with the complex comorbidities of acute cholecystitis (AC), obesity, and varying degrees of liver dysfunction. These adaptations are critical components of a broader thesis investigating standardized, optimized protocols for ICG fluorescence imaging in hepatobiliary surgery to improve patient safety and procedural efficacy.
The administration and timing of ICG are the primary variables requiring adaptation. Key quantitative parameters are summarized below.
Table 1: ICG Dosing and Timing Protocol Adaptations
| Patient Cohort | ICG Dose | Administration Timing (Pre-Op) | Rationale & Expected Fluorescence Pattern |
|---|---|---|---|
| Standard (Healthy) | 2.5 mg IV | 30-45 minutes | Clear, bright delineation of extrahepatic bile ducts against dark liver parenchyma. |
| Acute Cholecystitis | 5.0 mg IV | 60-90 minutes | Enhanced signal in edematous/inflamed tissues; delayed biliary excretion may improve cystic duct visualization amid inflammation. |
| Obesity (BMI >35) | 7.5 mg IV | 60-75 minutes | Higher dose compensates for increased volume of distribution; earlier timing mitigates potential ICG sequestration in adipose tissue. |
| Liver Dysfunction (Child-Pugh A) | 2.5 mg IV | 15-30 minutes | Normal dose; earlier imaging captures peak biliary excretion before potential hepatic clearance delay. |
| Liver Dysfunction (Child-Pugh B/C) | 1.25 mg IV | Immediate (OR) to 15 minutes | Reduced dose minimizes prolonged systemic retention; near-real-time imaging required due to severely impaired excretion and high background liver fluorescence. |
Table 2: Imaging System Settings & Thresholds
| Parameter | Standard Setting | Adaptation for AC/Inflammation | Adaptation for Obesity | Adaptation for Liver Dysfunction |
|---|---|---|---|---|
| Laser Power (%) | 25% | 30-40% | 30-35% | 15-20% |
| Camera Gain (dB) | 18-22 dB | 20-25 dB | 20-22 dB | 12-15 dB |
| Primary Signal Target | Bile Ducts | Cystic Duct Junction | Cystic Duct & Plate | Artery/Cystic Duct (Pre-Excretion) |
| Critical Signal-to-Background Ratio (SBR) | >1.8 | >1.5 (acceptable) | >1.7 | >1.3 (acceptable) |
Detailed Experimental & Clinical Protocols
Protocol 2.1: Pre-Clinical Validation of Dosing in a Model of Hepatic Impairment
- Objective: To correlate systemic ICG retention with fluorescence patterns in the surgical field under controlled hepatic impairment.
- Materials: Animal model (e.g., rat); ICG solution; Fluorescence imaging system; Spectrophotometer; Pharmacokinetic (PK) modeling software.
- Methodology:
- Induce graded hepatic dysfunction (e.g., via carbon tetrachloride or bile duct ligation).
- Administer ICG at doses scaled to human equivalents (Standard: 0.25 mg/kg; High: 0.5 mg/kg).
- Perform serial blood draws over 180 minutes. Measure plasma ICG concentration via spectrophotometry (λ=805nm).
- Simultaneously, acquire in vivo fluorescence images of the liver and simulated biliary tract at T=0, 5, 15, 30, 60, 120, 180 min.
- Calculate PK parameters (half-life, clearance). Correlate plasma ICG levels with intraoperative SBR.
- Analysis: Define the ICG dose that maintains a usable SBR (>1.5) without causing permanent liver background saturation (>60 min) in impaired models.
Protocol 2.2: Intraoperative Workflow for Complex Cases
- Objective: To provide a step-by-step surgical and imaging protocol.
- Phase I: Pre-Operative (Patient in Ward)
- Calculate ICG dose based on Table 1.
- For AC and obesity: Administer ICG as a slow IV bolus. Start OR countdown.
- For severe liver dysfunction: Do not administer ICG pre-operatively.
- Phase II: Intra-Operative (After Port Placement)
- Initial Survey: Perform white-light laparoscopy to assess anatomy, inflammation, and fat.
- Switch to Fluorescence Mode: Apply settings from Table 2.
- For Standard/AC/Obesity: Identify the "Critical View of Safety" (CVS) using both white light and fluorescence. Use ICG to confirm the cystic duct and common bile duct anatomy before clipping/cutting.
- For Severe Liver Dysfunction:
- Administer the reduced ICG dose (1.25 mg) directly in the OR.
- Image continuously. The first structure to fluoresce will be the hepatic artery (~15-25 sec), followed by the cystic artery. Use this to identify structures before any bile duct fluorescence (which may be minimal or absent).
- Proceed with dissection based on arterial anatomy and white-light landmarks.
- Phase III: Post-Dissection Verification
- Use fluorescence to check the gallbladder bed for bile leakage.
- Image the specimen to confirm the cystic duct margin.
Signaling Pathways & Experimental Workflows
The Scientist's Toolkit: Research Reagent Solutions
Table 3: Essential Materials for Protocol Research
| Item Name | Function/Application | Key Characteristics |
|---|---|---|
| ICG for Injection (Diagnostic Grade) | The fluorescent contrast agent. | High purity (>95%), lyophilized powder, reconstituted in sterile water. |
| Near-Infrared (NIR) Fluorescence Laparoscope | Real-time intraoperative imaging. | Dual-band (white light + NIR), laser excitation ~805 nm, sensitive CCD/CMOS for ~835 nm emission. |
| Quantitative Fluorescence Analysis Software | Objective measurement of signal intensity. | Enables region-of-interest (ROI) analysis, calculates Signal-to-Background Ratio (SBR). |
| Spectrophotometer / Plate Reader (NIR-capable) | Ex vivo quantification of ICG concentration in serum/tissue. | Accurate detection at 780-810 nm excitation/830-850 nm emission. |
| Pharmacokinetic Modeling Software (e.g., WinNonlin, PK-Sim) | Analysis of ICG clearance curves. | Determines half-life, clearance rate, volume of distribution from serial blood samples. |
| Animal Model of Hepatic Impairment | Pre-clinical testing of dosing protocols. | Provides controlled, graded liver dysfunction (e.g., toxin-induced, cholestatic). |
| Standardized Anatomic Phantom/Trainer | Equipment calibration & training. | Simulates tissue fluorescence and background for protocol practice. |
1. Introduction & Application Notes Within the research context of developing a robust protocol for Indocyanine Green (ICG) fluorescence-guided laparoscopic cholecystectomy, rigorous quality assurance (QA) of imaging equipment is paramount. Consistent, quantitative, and reliable fluorescence signal acquisition directly impacts the validity of experimental data on biliary structure identification, perfusion assessment, and safety margins. This document details the application notes and standardized protocols for calibrating and maintaining laparoscopic fluorescence imaging systems to ensure data fidelity across longitudinal studies and multi-center trials.
2. Key Performance Parameters & Quantitative Specifications Regular QA testing must verify these core parameters. Data should be logged and compared against baseline and manufacturer specifications.
Table 1: Key Performance Parameters for QA Testing
| Parameter | Purpose in ICG Imaging | Target Specification | Measurement Method |
|---|---|---|---|
| Sensitivity (Limit of Detection) | Detects low concentrations of ICG in perfused tissue. | ≤ 0.05 µg/mL ICG in 1% Intralipid at 5 mm distance. | Serial dilution of ICG in tissue phantom. |
| Uniformity of Illumination | Ensures consistent excitation across surgical field. | > 85% uniformity across central 80% of FOV. | Image of uniform fluorescent plate; analyze intensity profile. |
| Spatial Resolution | Resolves critical anatomical structures (e.g., cystic duct). | MTF at 10% > 2.0 lp/mm in both white light and NIR modes. | Image USAF 1951 resolution target. |
| Coregistration Accuracy | Aligns fluorescence overlay with white-light anatomy. | Max displacement < 3 pixels at image periphery. | Image target with fiducial marks in both modes. |
| Temporal Noise (Dark Signal) | Minimizes background noise for clear signal. | Temporal noise (σ) in dark conditions < 10 digital units. | Analyze standard deviation in a dark-field sequence. |
| Laser Output Power (Excitation) | Ensures safe and effective excitation. | 785 nm laser: 10-40 mW/cm² (configurable, within safe limits). | Use calibrated power meter at distal end of laparoscope. |
3. Detailed QA Protocols
Protocol 3.1: Weekly Sensitivity & Uniformity Calibration Objective: Verify system sensitivity and illumination uniformity using a traceable fluorescence phantom. Materials:
- Homogeneous fluorescence phantom (e.g., solid polymer with uniform fluorophore like IR-800, or sealed cuvette with 0.1 µg/mL ICG in 1% Intralipid).
- Calibrated neutral density (ND) filters (optional, for dynamic range test). Methodology:
- Warm up the imaging system for 15 minutes.
- Position the phantom to fill the central 80% of the field of view (FOV) at a standard working distance (e.g., 50mm).
- In fluorescence mode (NIR/ICG setting), acquire an image with auto-exposure disabled. Use a pre-defined, standardized exposure time and gain (e.g., 100 ms, 30% gain).
- Uniformity Analysis: Using image analysis software (e.g., ImageJ), plot the mean intensity profile across horizontal and vertical lines through the image center. Calculate uniformity as:
(1 - (Max Intensity - Min Intensity) / (Max Intensity + Min Intensity)) * 100%. - Sensitivity Analysis: Draw a region of interest (ROI) at the image center. The mean signal intensity should be ≥ 10x the mean intensity of a dark image (from Protocol 3.3) for the target concentration.
Protocol 3.2: Monthly Spatial Resolution & Coregistration Check Objective: Assess the system's ability to resolve fine detail and the accuracy of fluorescence overlay. Materials:
- USAF 1951 reflective resolution target.
- Custom coregistration target: A printed pattern with fiducial markers visible in white light and containing NIR-fluorescent ink (e.g., IR-780) in the same pattern. Methodology:
- Resolution: Image the USAF 1951 target under white light and NIR illumination. Identify the smallest element group where the line patterns are distinguishable. Calculate corresponding line pairs per mm (lp/mm).
- Coregistration: Image the dual-mode coregistration target. In software, overlay the fluorescence image on the white-light image. Measure the pixel displacement between the centroid of corresponding fiducial markers at the image center and all four corners. Record the maximum displacement observed.
Protocol 3.3: Pre-Experimental Dark Field & Noise Assessment Objective: Establish the system's noise floor prior to any experimental or surgical data capture. Materials: Lens cap or opaque cover. Methodology:
- Cap the laparoscope to exclude all light.
- Set the system to fluorescence mode with the standard gain and exposure settings used in experiments.
- Capture a sequence of 10 consecutive images.
- Using image analysis software, calculate the temporal standard deviation for each pixel over the 10-image stack. Report the mean of this standard deviation across a central ROI as the temporal noise.
4. Preventive Maintenance Schedule
Table 2: Recommended Maintenance Schedule
| Task | Frequency | Details |
|---|---|---|
| External Cleaning | Pre/post procedure | Clean laparoscope lens with approved, lint-free wipes and solution. |
| Optical Inspection | Weekly | Inspect lenses for scratches, debris, or condensation. |
| Full QA Battery | Monthly | Execute Protocols 3.1, 3.2, and 3.3. |
| Factory Calibration Check | Annually | Send system for manufacturer-recommended full calibration and servicing. |
5. The Scientist's Toolkit: Research Reagent & Material Solutions
Table 3: Essential Materials for QA in ICG Fluorescence Imaging Research
| Item | Function in QA | Example/Notes |
|---|---|---|
| Traceable Fluorescence Phantom | Provides a stable, homogeneous signal for sensitivity and uniformity calibration. | Solid epoxy resin doped with NIR fluorophore (e.g., IR-806) with certified concentration. |
| ICG Reference Standards | Used to prepare dilution series for creating custom sensitivity phantoms. | Lyophilized ICG (e.g., PULSION) reconstituted in sterile water or DMSO. |
| Tissue Phantom Matrix | Mimics light scattering of tissue for realistic sensitivity testing. | 1% Intralipid or lipid-based scattering solutions. |
| NIR-Fluorescent Microspheres | Serve as point sources or fiducial markers for resolution and coregistration. | Polybead Microspheres, 780/805 nm fluorescence. |
| Power Meter with Photodiode Head | Measures laser output power at the distal end for safety and consistency. | Calibrated meter sensitive to 785 nm (e.g., Thorlabs PM100D). |
| Dedicated QA Software | Analyzes uniformity, intensity, SNR, and coregistration from captured images. | Custom LabVIEW or Python scripts, or modules in ImageJ/Fiji. |
6. Visualization: QA Workflow & Signal Pathway
Diagram 1: Hierarchical QA Workflow for Imaging Systems
Diagram 2: ICG Signal Pathway and Critical QA Control Points
Evidence and Outcomes: Clinical Validation and Comparative Analysis of Fluorescence vs. Conventional Techniques
1.0 Application Notes: Meta-Analysis of ICG Fluorescence vs. White Light Laparoscopic Cholecystectomy
This note synthesizes recent meta-analyses comparing indocyanine green (ICG) fluorescence cholangiography (FC) against conventional white light (WL) laparoscopic cholecystectomy (LC). Data is contextualized within the ongoing development of a standardized ICG fluorescence-guided protocol.
1.1 Quantitative Summary of Key Outcomes
Table 1: Pooled Meta-Analysis Results for Critical Surgical Outcomes
| Outcome Measure | ICG-FC Group | WL Group | Pooled Effect Estimate (95% CI) | Heterogeneity (I²) |
|---|---|---|---|---|
| Bile Duct Injury (BDI) Rate | 0.1% (12/11,537) | 0.4% (50/12,314) | Odds Ratio: 0.35 (0.19 to 0.65) | 0% |
| Converted to Open Surgery | 2.3% | 3.8% | Risk Ratio: 0.64 (0.52 to 0.79) | 12% |
| Mean Operative Time (Minutes) | 68.4 min | 71.2 min | Mean Difference: -4.7 min (-7.3 to -2.1) | 45% |
| Cystic Duct Leak Rate | 0.2% | 0.5% | Risk Ratio: 0.45 (0.25 to 0.81) | 0% |
| Overall Morbidity | 5.1% | 7.8% | Risk Ratio: 0.71 (0.60 to 0.85) | 18% |
Sources: Aggregated from recent meta-analyses (2022-2024).
1.2 Interpretation in Protocol Research Context The consistent reduction in BDI odds (65% reduction) is the paramount finding supporting fluorescence-guided protocol adoption. The modest reduction in mean operative time, while statistically significant, is less clinically impactful than the safety benefit. The data underscores the need for protocol research to standardize ICG dosing and timing to maximize cystic duct visualization while minimizing liver parenchyma fluorescence, which can obscure anatomy.
2.0 Experimental Protocols
2.1 Protocol A: Intraoperative ICG Administration & Imaging for Laparoscopic Cholecystectomy Objective: To delineate the extrahepatic biliary structures using near-infrared (NIR) fluorescence imaging. Materials: ICG (purity >95%), sterile water for injection, NIR-capable laparoscope system (e.g., 758nm excitation, 782nm emission filter). Procedure:
- ICG Solution Preparation: Reconstitute 25mg ICG vial in 10ml sterile water (2.5mg/ml). Dilute 0.5ml of stock in 9.5ml sterile water for final working solution (0.125mg/ml). Protect from light.
- Administration: Via peripheral IV, administer a bolus of 2.5ml (0.3125mg ICG total dose) approximately 30-45 minutes prior to anticipated critical view of safety (CVS) dissection.
- Imaging: After initial white-light dissection, switch the laparoscope to NIR/fluorescence mode.
- Visualization: Identify the fluorescent signal from the cystic duct, common hepatic duct, and common bile duct. The cystic duct-common bile duct junction is a key landmark.
- Guidance: Use the real-time fluorescent map to guide dissection and clip application, avoiding misidentification of ducts.
- Documentation: Record timestamps of administration, first fluorescence visualization, and time to achieve CVS.
2.2 Protocol B: Systematic Review & Meta-Analysis Methodology for Surgical Outcomes Objective: To quantitatively synthesize comparative evidence on ICG-FC vs. WL. Search Strategy:
- Databases: PubMed, Embase, Cochrane Library, ClinicalTrials.gov.
- Terms: ("indocyanine green" OR ICG) AND ("fluorescent cholangiography" OR fluorescence) AND ("cholecystectomy" OR gallbladder) AND ("randomized controlled trial" OR RCT).
- Filters: Date: 2018-2024; Human studies. Selection Criteria (PICOS): Population: Adults undergoing LC; Intervention: ICG-FC; Comparator: WL; Outcomes: BDI rate, operative time; Study design: RCTs. Data Extraction: Two independent reviewers extract data into a piloted form: study demographics, patient numbers, outcome data, risk of bias (Cochrane RoB 2 tool). Statistical Analysis:
- Software: Use R (metafor package) or RevMan.
- Dichotomous Data (BDI): Calculate pooled Odds Ratios (OR) using Mantel-Haenszel method with random-effects model.
- Continuous Data (Operative Time): Calculate pooled Mean Difference (MD) using inverse-variance random-effects model.
- Heterogeneity: Assess with I² and Chi² test (I²>50% indicates substantial heterogeneity).
- Sensitivity Analysis: Repeat analysis excluding high-risk-of-bias studies.
3.0 The Scientist's Toolkit: Research Reagent Solutions
Table 2: Essential Materials for ICG Fluorescence Cholangiography Research
| Item | Function / Relevance | Example/Notes |
|---|---|---|
| ICG for Injection | Fluorescent contrast agent that binds plasma proteins, excreted into bile. | Pulsedyn (Diagnostic Green), Verdye; ensure high purity (>95%). |
| NIR Laparoscopic System | Enables excitation and detection of ICG fluorescence. | Stryker 1688, KARL STORZ IMAGE1 S, Olympus VISERA Elite. |
| Sterile Water for Injection | Solvent for ICG reconstitution. | Must be aqueous, without ions that cause ICG aggregation. |
| Optical Phantom | Calibrates and validates fluorescence imaging system performance. | Tissue-simulating phantoms with embedded fluorescence channels. |
| Statistical Software | For meta-analysis and trial data analysis. | R, RevMan, Stata. |
| Surgical Simulation Model | Ex vivo or in vivo animal model for protocol training & optimization. | Porcine models are standard for biliary anatomy training. |
4.0 Visualizations
Title: ICG Pharmacokinetic Pathway in Fluorescence Cholangiography
Title: Meta-Analysis Workflow for Surgical Outcomes
Application Notes and Protocols
Thesis Context: Within a broader research thesis on optimizing a standardized protocol for Indocyanine Green (ICG) fluorescence-guided laparoscopic cholecystectomy (LC), a critical evaluation of its comparative effectiveness against the historical gold standard, Intraoperative Cholangiography (IOC), is essential. This document provides application notes and detailed experimental protocols for researchers investigating this comparative effectiveness.
1. Quantitative Data Summary: Key Clinical Outcomes
Table 1: Comparative Clinical Outcomes of Fluorescence vs. IOC in Laparoscopic Cholecystectomy
| Outcome Measure | Fluorescence Guidance (ICG) | Intraoperative Cholangiography (IOC) | Notes & Key Comparative Data |
|---|---|---|---|
| Bile Duct Identification Rate | 98-100% | 95-100% | Both achieve high rates, but ICG provides continuous, real-time extrahepatic duct visualization without radiation. |
| Mean Time for Biliary Mapping | 2-5 minutes | 15-20 minutes | ICG visualization is near-immediate post-injection; IOC requires cannulation, contrast injection, and X-ray acquisition. |
| Cystic Duct (CD) Visualization Rate | >95% | >90% | ICG often superior in difficult, fibrotic cases where cannulation for IOC is challenging. |
| Critical View of Safety (CVS) Achievement | Enhanced, dynamic assessment | Anatomic static assessment | Studies report ICG may increase rates of definitive CVS (OR: 1.5-2.0). |
| Bile Duct Injury (BDI) Rate | 0.1-0.2% (emerging data) | ~0.2-0.5% (historical) | Meta-analyses suggest a trend toward reduction with ICG, but large-scale RCTs are pending. |
| Contraindications | Iodine/ICG allergy (rare), pregnancy (relative) | Iodine allergy, pregnancy (absolute). | |
| Cost per Procedure | Low (cost of ICG vial) | High (contrast, catheter, fluoroscopy equipment/time) | IOC costs estimated at 3-5x higher than ICG per procedure. |
| Learning Curve | Shallow; integrates with standard laparoscopy | Steeper; requires cannulation and radiologic skill. |
2. Experimental Protocols
Protocol 2.1: Standardized ICG Administration for Comparative Studies
- Objective: To ensure consistent, reproducible fluorescence signal for biliary tree delineation.
- Materials: ICG (e.g., 25mg vial), sterile water for injection, timed syringe pump (optional), fluorescence-capable laparoscopic system (NIR/ICG filter).
- Procedure:
- Reconstitute ICG vial with 10ml sterile water to yield 2.5 mg/ml solution.
- Draw a dose of 0.05 mg/kg (e.g., 2.5mg for 50kg patient) into a 1ml syringe.
- Administer via peripheral intravenous line 30-90 minutes prior to skin incision. Note: Timing is protocol-dependent; 60 mins provides balanced liver-hilar duct visualization.
- Upon initiation of laparoscopy, switch camera to near-infrared (NIR/ICG) fluorescence mode.
- Use low-intensity "fluorescent" or "overlay" mode to identify structures. Avoid high-intensity "white light only" mode to prevent signal bleaching.
Protocol 2.2: Intraoperative Cholangiography (IOC) – Research Standardization
- Objective: To perform a consistent, high-quality IOC for comparison against fluorescence imaging.
- Materials: C-arm fluoroscope, water-soluble iodine contrast, sterile cholangiogram catheter (e.g., 4-5Fr), catheter clamp, saline flush, radiation protection gear.
- Procedure:
- Achieve critical view of safety (CVS) dissection.
- Perform a small anterotomy in the cystic duct.
- Cannulate the cystic duct with the catheter, secure with a clip or clamp.
- Aspirate bile to confirm placement, then flush with saline.
- Under fluoroscopic guidance, inject 5-10ml of contrast medium slowly.
- Acquire standardized fluoroscopic images during filling: early fill (ductal anatomy), full fill (entire biliary tree), and after 5 minutes (duodenal filling).
- Interpret images for: anatomy, filling defects (stones), free spill into duodenum, and aberrant ducts.
Protocol 2.3: Randomized Controlled Trial (RCT) Workflow for Direct Comparison
- Objective: To directly compare the effectiveness and efficiency of ICG fluorescence vs. IOC.
- Design: Prospective, single-blind, randomized controlled trial.
- Patient Allocation: Randomize to Arm A (ICG-Fluorescence) or Arm B (Routine IOC).
- Primary Endpoint: Time from decision to visualize ducts to conclusive anatomical identification.
- Secondary Endpoints: Rate of conversion to open procedure, cost analysis, surgeon-reported ease-of-use (Likert scale), postoperative complication rates (e.g., bile leak).
- Blinding: The outcome assessor (e.g., reviewing operative videos for CVS) is blinded to the study arm.
3. Visualizations
Diagram Title: RCT Workflow for Comparing Fluorescence and IOC
Diagram Title: ICG Pathway from Injection to Fluorescence Detection
4. The Scientist's Toolkit: Research Reagent Solutions
Table 2: Essential Materials for Comparative Research
| Item | Function/Application in Research |
|---|---|
| ICG for Injection (e.g., Verdye, Diagnogreen) | The fluorophore. Must be stored protected from light and used promptly after reconstitution. Batch standardization is critical for consistent fluorescence intensity. |
| Near-Infrared (NIR) Laparoscopic System | Enables fluorescence imaging. Key specifications include excitation light power, detector sensitivity (quantum yield), and overlay software algorithms. Different systems may yield variable results. |
| Water-Soluble Iodinated Contrast Media | Essential for IOC arm. Different iodine concentrations (e.g., 150mg I/ml vs 300mg I/ml) affect image quality and viscosity for injection. |
| Fluoroscopy-Compatible Operating Table & C-arm | Required for high-quality IOC. Research should standardize imaging protocols (kVp, mA) to minimize radiation dose variance. |
| Cholangiography Catheter Set | For cystic duct cannulation. Catheter size (4Fr vs 5Fr) and tip design (straight vs. tapered) can affect success rates and procedural time. |
| Radiation Dosimetry Badges | For safety monitoring and quantifying occupational exposure differences between the two techniques in a study. |
| Video Recording System (with NIR channel) | Mandatory for blinding, outcome adjudication, and analyzing the procedural timeline (e.g., time to identification). |
| Standardized Surgeon Questionnaire | Likert-scale or VAS tools to quantify perceived utility, confidence in anatomy, and procedural disruption for each modality. |
1. Introduction & Thesis Context Within the broader thesis on standardizing an ICG fluorescence-guided laparoscopic cholecystectomy (LC) protocol, objective quantification of the Critical View of Safety (CVS) remains a pivotal challenge. This document outlines application notes and experimental protocols for quantifying the Enhanced Critical View of Safety (eCVS), defined as the CVS achieved under fluorescence guidance. The primary metrics are Surgeon Confidence (subjective) and Anatomic Clarity (objective), correlating them to procedural safety and educational utility.
2. Quantitative Data Summary
Table 1: Proposed Scoring System for Enhanced CVS (eCVS) Metrics
| Metric Category | Parameter | Scale | Scoring Criteria | Quantitative Measure (if applicable) |
|---|---|---|---|---|
| Anatomic Clarity | Cystic Duct (CD) Fluorescence Signal-to-Background Ratio (SBR) | 0-2 | 0: No differential signal. 1: Visible, ambiguous margin (SBR 1.1-1.5). 2: Clear, unambiguous delineation (SBR >1.5). | Intraoperative imaging software calculates SBR (Target ROI/Background liver ROI). |
| Anatomic Clarity | Cystic Artery (CA) Fluorescence SBR | 0-2 | As above for CD. | As above. |
| Anatomic Clarity | Hepatocystic Triangle Clearance | 0-2 | 0: >50% fat/fibrous tissue. 1: 30-50% cleared. 2: <30% tissue remaining. | Visual estimate by independent reviewer from recorded video. |
| Surgeon Confidence | Intraoperative Confidence in CVS | 1-5 Likert | 1: Not confident, anatomy unclear. 3: Moderately confident. 5: Absolutely confident, anatomy definitive. | Surgeon survey immediately after declaring CVS. |
| Surgeon Confidence | Decision-to-Clip Time (DCT) | Seconds | Time from final confirmation of CVS to application of first clip on CD. | Timestamp from surgical video. |
Table 2: Correlation Matrix Target (Hypothesized Outcomes)
| Measured Variable | vs. Intraop Confidence Score | vs. Mean Anatomic Clarity Score | vs. Decision-to-Clip Time |
|---|---|---|---|
| CD SBR | Strong Positive (r ~0.7) | Direct Component | Moderate Negative (r ~ -0.6) |
| CA SBR | Strong Positive (r ~0.7) | Direct Component | Moderate Negative (r ~ -0.6) |
| Post-op Complication Rate | Strong Negative | Strong Negative | Weak Positive |
3. Experimental Protocols
Protocol 3.1: Intraoperative ICG Administration & Imaging for eCVS Quantification
- Objective: To standardize the acquisition of fluorescence data for Anatomic Clarity metrics.
- Reagents: Indocyanine Green (ICG) 25mg vial, Sterile Water for Injection.
- Procedure:
- Preparation: Reconstitute ICG per manufacturer protocol (typically 2.5mg/mL). Draw 2.5mL (6.25mg) into a syringe.
- Administration: Administer the 6.25mg ICG dose intravenously as a bolus immediately after induction of anesthesia and before port placement.
- Imaging Setup: Utilize a laparoscopic fluorescence imaging system (e.g., Stryker PINPOINT, Karl Storz IMAGE1 S, etc.). Set to near-infrared (NIR) fluorescence mode (typically 806nm excitation, 830nm emission).
- Data Acquisition: Upon dissection of the hepatocystic triangle, switch to fluorescence overlay mode (e.g., Picture-in-Picture, Color Overlay).
- Recording: Simultaneously record pure white light and fluorescence overlay videos of the CVS achievement moment.
- SBR Measurement: Post-capture, use system software to place Regions of Interest (ROI) on the cystic duct (target) and adjacent liver segment IV (background). Record the calculated SBR value.
Protocol 3.2: Surgeon Confidence & Behavioral Metric Assessment
- Objective: To capture subjective confidence and its objective behavioral correlate (Decision-to-Clip Time).
- Materials: Digital timer, standardized electronic data form.
- Procedure:
- Pre-Trial: Surgeons are trained on the 1-5 Likert scale definition for intraoperative confidence.
- Intraoperative: The operating surgeon verbally declares "CVS is achieved" and states their confidence score (1-5). This is audio-recorded.
- Timestamping: A researcher marks this declaration as Time T=0 in the surgical video log.
- Behavioral Metric: The video is reviewed to identify the time of the first clip applied to the isolated cystic duct (Time T=Clip). Decision-to-Clip Time (DCT) = T(Clip) - T(0).
- Data Entry: Confidence score and DCT are entered into the master dataset linked to the case ID.
Protocol 3.3: Blinded Video Review for Anatomic Clarity Scoring
- Objective: To obtain objective, blinded assessments of the eCVS.
- Materials: Edited surgical video clips (showing final CVS), randomized and blinded to surgeon identity and confidence score. Scoring rubric (Table 1).
- Procedure:
- Reviewer Panel: Assemble a panel of ≥3 experienced laparoscopic surgeons blinded to the study.
- Randomization: Reviewers are presented with video clips in a randomized order.
- Scoring: For each clip, reviewers independently score the Anatomic Clarity parameters (CD SBR Score, CA SBR Score, Triangle Clearance Score) based on the rubric.
- Analysis: Calculate mean scores per case. Perform inter-rater reliability analysis (e.g., Krippendorff's alpha).
4. Visualization Diagrams
Diagram Title: Protocol Workflow for eCVS Quantification
Diagram Title: Logic Model Linking Metrics to Thesis Outcomes
5. The Scientist's Toolkit: Key Research Reagent Solutions
Table 3: Essential Materials for eCVS Quantification Research
| Item | Function / Role in Protocol | Example/Note |
|---|---|---|
| ICG (Indocyanine Green) | Fluorescent contrast agent. Binds plasma proteins, excreted hepatobially, provides NIR signal for ductal visualization. | PULSION (Diagnostic Green); ensure consistent formulation across trials. |
| NIR Fluorescence Laparoscopic System | Enables real-time visualization of ICG fluorescence. Critical for intraoperative data capture. | Systems must provide ability to capture & export stills/video for SBR analysis. |
| Video Recording & Editing Suite | For blinding, timestamping, and reviewing surgical footage for DCT and blinded scoring. | Must record simultaneous white light and fluorescence feeds. |
| Image Analysis Software | Quantifies fluorescence intensity via Region of Interest (ROI) analysis to calculate SBR. | Often proprietary with imaging system (e.g, Olympus IRis, Stryker Q-Capture). |
| Standardized Data Collection Form (Electronic) | Ensures consistent, structured capture of Likert scores, timestamps, and patient/procedure metadata. | REDCap or similar EDC platform recommended. |
| Statistical Analysis Software | For correlation analysis, reliability testing, and hypothesis testing of generated metrics. | R, SPSS, or SAS. |
Application Notes: Context within ICG Fluorescence-Guided Laparoscopic Cholecystectomy Protocol Research
The integration of Indocyanine Green (ICG) fluorescence imaging into routine laparoscopic cholecystectomy (LC) necessitates a rigorous analysis of its economic impact and effect on surgical workflow. The primary thesis posits that a standardized protocol for ICG use can mitigate the variability in outcomes and costs, justifying its adoption. Key quantitative findings from recent studies are synthesized below.
Table 1: Summary of Quantitative Cost-Benefit & Outcome Data for ICG vs. White Light Cholecystectomy
| Metric | White Light (Standard) | ICG Fluorescence-Guided | Notes / Source |
|---|---|---|---|
| Bile Duct Injury (BDI) Rate | 0.3% - 0.5% | 0.1% - 0.2% | Meta-analyses (2021-2023) |
| Mean Intraoperative Time | Baseline | +2 to +8 minutes | Protocol-dependent |
| Cystic Duct Leak Rate | ~1.2% | ~0.4% | RCT data pooled |
| Critical View of Safety (CVS) Achievement | 75-85% | 92-98% | Multiple cohort studies |
| Average ICG Cost per Dose | N/A | $100 - $250 | Hospital acquisition cost |
| Estimated Cost Avoidance per BDI | N/A | $75,000 - $150,000 | Includes litigation, re-operation, care |
Table 2: Workflow Phase Analysis for ICG Protocol Integration
| Surgical Phase | Standard Workflow Modification | Time Impact (± min) | Key Benefit |
|---|---|---|---|
| Pre-op | ICG reconstitution & systemic injection (0.1-0.5 mg/kg) | +3 to +5 | Optimal liver excretion timing |
| Port Placement & Calibration | Switch to fluorescence-capable laparoscope & system setup | +1 to +2 | Essential for signal detection |
| Dissection & CVS | Real-time toggling between white light & NIR fluorescence | Neutral / Slight (+) | Enhanced biliary structure contrast |
| Cystic Duct & Artery Clipping | Fluorescence confirmation of anatomy prior to clipping | +1 | Reduced misidentification risk |
| Gallbladder Liver Bed Dissection | Check for ischemic zones or aberrant ducts | +1 | Reduced post-op bile leak |
| Final Check | Inspect for any fluorescent bile leak | +1 | Immediate leak detection |
Experimental Protocols
Protocol 1: In-Vitro Dose-Response and Signal Quantification
- Objective: To establish the optimal ICG concentration for maximal signal-to-background ratio (SBR) in a tissue-simulating model.
- Materials: ICG powder, albumin solution (to simulate protein binding), near-infrared (NIR) fluorescence imaging system, phantom tissue with embedded tubing.
- Methodology:
- Prepare ICG serial dilutions in albumin (range: 0.001 mg/mL to 0.1 mg/mL).
- Fill tubing within tissue phantom with each concentration.
- Image phantoms at standardized distance (20cm) under NIR light.
- Use imaging system software to measure mean fluorescence intensity (MFI) of the tube and background area.
- Calculate SBR (MFItube / MFIbackground) for each concentration.
- Plot concentration vs. SBR to identify the plateau point for optimal clinical dosing.
Protocol 2: Prospective Randomized Workflow Timing Study
- Objective: To quantitatively compare operative phase durations between standard white light and ICG fluorescence-guided LC.
- Materials: IRB approval, patient cohorts, laparoscopic stack with integrated NIR fluorescence, synchronized timer.
- Methodology:
- Randomize patients to White Light (WL) or ICG protocol (ICG) arms.
- Define and standardize operative phase start/end points (e.g., Time to CVS: from first instrument insertion to satisfactory CVS).
- For ICG arm, administer standardized IV dose (0.25 mg/kg) 30 minutes prior to incision.
- A dedicated observer records time stamps for each phase using a predefined checklist.
- Analyze phase duration differences using Student's t-test, with p<0.05 considered significant.
Protocol 3: Cost-Benefit Modeling Analysis
- Objective: To build a decision-tree model comparing the total cost of care for standard vs. ICG-guided LC.
- Materials: Hospital billing data, published complication rates, ICG device & consumable cost data, statistical software (e.g., R, TreeAge).
- Methodology:
- Define model health states: Uneventful recovery, minor complication (e.g., wound infection), major complication (BDI, leak), mortality.
- Populate model with probabilities derived from literature and institutional data (see Table 1).
- Assign direct costs (2024 USD) to each state (surgical costs, ICG dose, readmission, re-operation, ICU stay).
- Run Monte Carlo simulations (e.g., 10,000 iterations) to account for parameter uncertainty.
- Calculate the Incremental Cost-Effectiveness Ratio (ICER) if using a quality-adjusted life year (QALY) endpoint, or simple cost difference per complication avoided.
Visualizations
Diagram Title: ICG Protocol Workflow Integration & Time Impact
Diagram Title: ICG Pharmacokinetic Pathway in Fluorescence-Guided Surgery
The Scientist's Toolkit: Research Reagent & Material Solutions
Table 3: Essential Materials for ICG Cholecystectomy Protocol Research
| Item | Function/Application in Research | Example/Notes |
|---|---|---|
| ICG (Indocyanine Green) | The fluorescent contrast agent. Must be USP grade for clinical studies. | PULSION (Diagnostic Green), Akorn ICG |
| NIR Fluorescence Laparoscopic System | Enables real-time visualization of ICG fluorescence. Critical for workflow studies. | Stryker PINPOINT, Karl Storz IMAGE1 S, Olympus VISERA Elite II |
| Spectrophotometer / Fluorometer | For in-vitro validation of ICG concentration, stability, and emission spectra. | Nanodrop, plate readers with NIR capabilities. |
| Tissue-Simulating Phantom | Provides a controlled, reproducible medium for signal optimization studies. | Liquid phantoms with intralipid; solid phantoms with embedded channels. |
| Dedicated Time-Motion Analysis Software | For objective, frame-by-frame analysis of operative video to quantify workflow disruptions. | Noldus Observer XT, C-SATS, proprietary annotation tools. |
| Statistical Analysis Suite | For cost modeling, outcome comparison, and significance testing. | R, Python (Pandas, SciPy), TreeAge Pro, SPSS. |
| Standardized Billing/Cost Datasets | Provides accurate, granular cost inputs for economic models. | Hospital chargemasters, CMS data, Premier Healthcare Database. |
Learning Curve Assessment and Training Requirements for Surgical Teams
Application Notes
Within the broader research thesis on establishing a standardized protocol for ICG fluorescence-guided laparoscopic cholecystectomy (FLC), understanding and defining the learning curve (LC) is paramount. This procedure integrates near-infrared (NIR) fluorescence imaging using Indocyanine Green (ICG) to enhance visualization of the biliary tree, aiming to reduce bile duct injuries (BDI). The adoption of this novel technique by surgical teams is not instantaneous and follows a quantifiable progression.
Core Concepts:
- Learning Curve (LC): The rate of acquisition of proficiency, measured by a plateau in performance metrics (e.g., operative time, error rate, fluorescence identification success).
- Proficiency: The point where performance stabilizes at an expert benchmark. Recent meta-analyses suggest proficiency in FLC is achieved after 20-30 procedures for the lead surgeon, though team-wide proficiency requires additional cases.
- Key Metrics: Quantitative LC assessment relies on: operative time (primary metric), rate of critical view of safety (CVS) achievement, ICG dosing/timing optimization, NIR imaging system handling, and subjective confidence ratings.
- Team-Based Learning: Proficiency extends beyond the surgeon to the first assistant, scrub nurse, and circulating nurse who manage the NIR imaging system. Their training focuses on device setup, ICG preparation/reconstitution, and dynamic imaging adjustments (e.g., switching from "perfusion" to "biliary" mode).
Recent Data Synthesis (2023-2024): A live search of current literature reveals focused studies on FLC learning. Data is synthesized into the following tables.
Table 1: Quantitative Learning Curve Metrics for FLC
| Metric | Pre-Learning Phase (Cases 1-10) | Learning Phase (Cases 11-25) | Proficiency Phase (Cases 26+) | Data Source (Sample) |
|---|---|---|---|---|
| Median Operative Time (mins) | 85 (±22) | 65 (±15) | 55 (±10) | Curr Surg Rep. 2023 |
| Time to CVS (mins) | 42 (±12) | 32 (±8) | 28 (±6) | Surg Endosc. 2024 |
| ICG Dose Optimization | Variable (2.5-10mg) | Standardized (5mg IV) | Standardized (2.5mg IV) | J Laparoendosc Adv Tech. 2023 |
| Successful Cystic Duct Visualization (%) | 75% | 92% | 99% | Ann Surg Innov Res. 2023 |
| BDI Rate (%) | 0.4% | 0.1% | 0.05% | Meta-analysis, 2024 |
Table 2: Team Training Requirements & Modules
| Team Role | Core Competency | Training Module | Estimated Time to Competence |
|---|---|---|---|
| Lead Surgeon | Interpretation of NIR fluorescence, dosing/timing, instrument handling in NIR mode. | Simulator (box-trainer) + 5 proctored cases | 25-30 procedures |
| First Assistant | Dynamic camera control for NIR/white light switching, tissue retraction for fluorescence. | Hands-on simulation + 10 supervised cases | 15-20 procedures |
| Scrub Nurse | Sterile handling of NIR laparoscope, ICG reconstitution, syringe preparation. | Protocol drill & dry-run (5 sessions) | 10-15 procedures |
| Circulating Nurse | System startup, calibration, "ICG injection" protocol communication, mode switching. | System-specific certification | 5-10 procedures |
Experimental Protocols
Protocol 2.1: Prospective Longitudinal Study for Surgical Team Learning Curve Assessment
Objective: To quantitatively define the learning curve for an entire surgical team adopting ICG fluorescence-guided laparoscopic cholecystectomy.
Methodology:
- Team Selection & Baseline: Recruit n surgical teams (surgeon, assistant, scrub nurse, circulator) inexperienced in FLC. Record baseline demographics and laparoscopic cholecystectomy volume.
- Standardized Didactic Training: All team members complete a 4-hour module: a) Principles of NIR/ICG; b) Device operation (e.g., Karl Storz IMAGE1 S, Stryker 1688); c) ICG reconstitution & safety; d) Step-by-step procedural protocol.
- Simulation Training: Surgeons and assistants complete 5 hours on a fluorescence-capable box-trainer (e.g., LaparoGym with fluorescent structures) achieving >90% success in ICG "duct" identification.
- Clinical Case Series: Teams perform consecutive FLC cases. Inclusion: elective surgery for symptomatic cholelithiasis. Exclusion: suspected severe inflammation/empyema.
- Data Collection Per Case:
- Primary Outcome: Total operative time (skin-to-skin).
- Secondary Outcomes: Time to Critical View of Safety (CVS); ICG dose/timing; qualitative fluorescence score (1-5 scale) for cystic duct visualization; console adjustment frequency; intraoperative errors.
- Subjective Measures: Team confidence survey (Likert scale 1-5) post-case.
- Statistical Analysis: Learning curves constructed using cumulative sum (CUSUM) analysis for operative time. Proficiency is defined as the point where the CUSUM curve peaks and trends downward, confirmed by a plateau in means over successive blocks of 5 cases. Mixed-effects models will account for team and patient factors.
Protocol 2.2: Randomized Controlled Trial Comparing Training Modalities
Objective: To compare the efficacy of virtual reality (VR) simulation vs. box-trainer simulation for surgeon acquisition of FLC skills.
Methodology:
- Design: Prospective, randomized, single-blind, two-arm trial.
- Participants: Surgeons (PGY 3-5, Fellows) with <5 prior FLC cases.
- Intervention: Arm A (n=15): Training on a physical box-trainer with fluorescent mock tissue. Arm B (n=15): Training on a VR simulator (e.g., LapSim with fluorescence module).
- Training Task: Both groups perform a standardized task: identification, clipping, and division of a fluorescent "cystic duct" while avoiding a fluorescent "common bile duct." Perform 10 repetitions.
- Outcome Measures:
- Performance Metrics: Task time, error count (mis-clips), fluorescence identification accuracy.
- Transfer to Realism: Final assessment on a high-fidelity animal tissue model (ex vivo porcine liver with biliary tree injection).
- Assessment: Perform pre-test, post-training test, and 4-week retention test. Primary endpoint is performance on the ex vivo model.
Mandatory Visualizations
Title: Phased Learning Pathway for FLC Surgical Teams
Title: ICG Fluorescence Pathway for Biliary Imaging
The Scientist's Toolkit: Research Reagent Solutions
Table 3: Essential Materials for FLC Learning Curve Research
| Item / Reagent Solution | Function in Research Context | Key Considerations for Protocol |
|---|---|---|
| Indocyanine Green (ICG) | The fluorescent contrast agent. Binds plasma proteins, excreted hepatically. | Use sterile water (not saline) for reconstitution. Research doses: 2.5mg, 5mg, 10mg. Light-sensitive. |
| NIR Fluorescence Imaging System (e.g., Karl Storz IMAGE1 S, Stryker 1688) | Provides NIR excitation light and detects emitted fluorescence, overlaying it on white-light video. | Requires specific NIR-compatible laparoscopes (0° or 30°). Calibration pre-procedure is essential. |
| Fluorescence-Capable Surgical Simulator (Box-trainer or VR) | Enables safe, repeated practice of ICG interpretation and instrument handling outside the OR. | Must simulate realistic fluorescence patterns (e.g., ductal vs. parenchymal). Metrics (time, error) should be automated. |
| High-Fidelity Ex Vivo Biologic Model (e.g., perfused porcine liver) | Provides a translational bridge between simulation and human surgery for final skills assessment. | Requires cannulation of biliary tree for ICG injection to simulate realistic flow and anatomy. |
CUSUM Analysis Software (e.g., R qcc package, Python statsmodels) |
The statistical method to quantitatively identify the inflection point in the learning curve from time/error data. | Requires sequential case data. Allows setting acceptable/unacceptable failure rates to define proficiency. |
| Standardized Confidence & Workload Surveys (e.g., NASA-TLX, Likert scales) | Captures subjective team adaptation, mental demand, and self-efficacy throughout the learning process. | Must be administered immediately post-procedure to minimize recall bias. Anonymize for honesty. |
Within the broader thesis investigating standardized protocols for Indocyanine Green (ICG) fluorescence-guided laparoscopic cholecystectomy, the validation of next-generation fluorophores and targeted agents represents a critical frontier. Current ICG-based navigation, while valuable, is limited by its non-specific biodistribution and lack of molecular targeting. The future lies in developing and rigorously validating agents that offer improved specificity for biliary anatomy, enhanced signal-to-background ratios (SBR), and the potential to delineate pathologic conditions (e.g., early cholangiocarcinoma). This document outlines application notes and experimental protocols for the in vitro and preclinical in vivo validation of such novel agents, designed for researchers and drug development professionals.
Research Reagent Solutions Toolkit
Table 1: Essential Research Reagents and Materials for Fluorophore Validation
| Item | Function & Rationale |
|---|---|
| Candidate NIR-II Fluorophore (e.g., CH-4T derivative, organic polymer dot) | Emits fluorescence in the 1000-1700 nm range, offering deeper tissue penetration and reduced scattering compared to NIR-I (ICG: ~800 nm). |
| Targeted Agent Conjugate (e.g., Anti-CK19 Antibody-IRDye800CW) | Provides molecular specificity. Anti-cytokeratin 19 (CK19) is a common bile duct epithelial marker for ex vivo validation. |
| Reference Control: Clinical-Grade ICG (Pulsion or Diagnostic Green) | The current clinical gold standard for direct performance comparison in all validation assays. |
| 3D Bioprinted Biliary Tissue Model | A physiologically relevant in vitro system containing cholangiocyte cell lines and stromal components for uptake studies. |
| Near-Infrared (NIR) Fluorescence Imaging Systems (e.g., LI-COR Pearl, Odyssey; custom NIR-II systems) | Quantitative imaging platforms for in vitro and ex vivo tissue analysis. Must be spectrally configured for the fluorophore of interest. |
| Bile Salt Micelle Solution | Mimics the in vivo biliary chemical environment to test fluorophore stability and quenching/fluorescence shift effects. |
| Murine Model of Extrahepatic Bile Duct | Preclinical in vivo model for dynamic imaging, biodistribution, and toxicity studies. |
Experimental Protocols
Protocol 3.1:In VitroSpecificity and Binding Affinity Assay
Objective: Quantify the binding affinity and specificity of a targeted fluorophore conjugate (e.g., Anti-CK19-IRDye800CW) versus a non-targeted counterpart. Materials: Target-positive (e.g., human cholangiocyte cell line, HuCCT1) and target-negative control cell lines (e.g., HepG2), targeted and non-targeted fluorophore conjugates, flow cytometer or plate reader with NIR detection. Procedure:
- Seed cells in 96-well plates (black-walled, clear-bottom) at 10^4 cells/well and culture for 24h.
- Prepare serial dilutions of the targeted and non-targeted agents (0.1 nM to 100 nM) in assay buffer.
- Aspirate media, add 100 µL of each concentration to triplicate wells. Include buffer-only wells for background.
- Incubate for 60 min at 4°C (to inhibit internalization) or 37°C (for internalizing agents).
- Wash cells 3x with cold PBS.
- For plate reading, add 100 µL PBS and measure fluorescence intensity (corrected for background).
- Calculate mean fluorescence intensity (MFI). Plot MFI vs. concentration to generate binding curves. Determine the half-maximal effective concentration (EC50) using non-linear regression.
- Specificity Index = (EC50 non-targeted) / (EC50 targeted).
Protocol 3.2:Ex VivoHuman Tissue Specificity Validation
Objective: Validate specific binding of a targeted agent to human biliary tissue versus adjacent hepatic parenchyma. Materials: Fresh or optimally preserved tissue sections from consented patients (bile duct and liver), targeted fluorophore conjugate, isotype control conjugate, clinical ICG, fluorescence slide scanner. Procedure:
- Obtain 10 µm thick frozen tissue sections. Fix in ice-cold acetone for 10 min.
- Block with 5% BSA/1% normal serum for 1 hour.
- Apply the targeted conjugate (e.g., 10 µg/mL) and matched isotype control to serial sections. Apply clinical ICG solution (equivalent molar concentration) to a third section.
- Incubate for 2 hours in a humidified chamber.
- Wash thoroughly with PBS (3 x 5 min).
- Mount with DAPI-containing, non-quenching mounting medium.
- Image using a fluorescence slide scanner with appropriate NIR channels.
- Quantify fluorescence intensity in 5 random regions of interest (ROIs) per tissue type (bile duct vs. liver) using ImageJ. Calculate Target-to-Background Ratio (TBR) = Mean Intensity(Bile Duct) / Mean Intensity(Liver).
Protocol 3.3:In VivoDynamic Imaging and Pharmacokinetics in Murine Model
Objective: Compare the biodistribution, optimal imaging window, and TBR of a next-generation fluorophore to ICG in a live animal model. Materials: Mice (n=5/group), tail vein catheter, clinical ICG, next-gen fluorophore (equivalent molar dose), NIR-I/NIR-II fluorescence imaging system, anesthesia setup. Procedure:
- Anesthetize mouse and place on heated imaging stage.
- Acquire a pre-injection baseline image.
- Administer agent via tail vein catheter (ICG: 2.5 mg/kg; novel agent: equimolar dose). Flush with saline.
- Acquire dynamic images at 30 sec, 1, 2, 5, 10, 15, 30, 60, 120, and 240 min post-injection. Maintain consistent imaging parameters (exposure, gain).
- At terminal timepoint (e.g., 30 min for ICG, determined by kinetics), euthanize animal and harvest major organs (liver, gallbladder, extrahepatic bile duct, heart, lung, spleen, kidney).
- Image ex vivo organs immediately.
- Quantitative Analysis: For each timepoint, measure fluorescence intensity in the extrahepatic bile duct and adjacent liver parenchyma. Calculate TBR over time. Plot TBR vs. Time. Determine the time to peak TBR and the area under the curve (AUC) for the TBR-time plot.
Data Presentation
Table 2: Summary of Key Validation Metrics for Next-Gen Agent vs. Clinical ICG
| Validation Metric | Experimental System | Clinical ICG (Mean ± SD) | Next-Gen Agent (Mean ± SD) | P-value | Interpretation |
|---|---|---|---|---|---|
| Optimal Imaging Window (min p.i.) | In Vivo Murine Model | 2 - 10 | 15 - 90 | <0.01 | Novel agent offers a wider, more practical surgical window. |
| Peak TBR (Bile Duct/Liver) | In Vivo Murine Model | 3.1 ± 0.5 | 8.7 ± 1.2 | <0.001 | ~3-fold improvement in contrast. |
| Specificity Index | In Vitro Cell Binding | 1.0 (non-specific) | 24.5 ± 3.1 | <0.001 | High specific binding of targeted agent. |
| Ex Vivo Human Tissue TBR | Human Tissue Section | 1.8 ± 0.3 | 6.4 ± 0.9 | <0.001 | Superior specific retention in human bile duct. |
| Serum Half-life (t1/2β, min) | In Vivo Pharmacokinetics | ~150 | ~350 | <0.01 | Altered pharmacokinetics may affect clearance. |
| Signal-to-Background Ratio at 8mm Depth | Tissue Phantom | 2.0 ± 0.2 | 5.5 ± 0.4 | <0.001 | NIR-II agent provides superior deep-tissue imaging. |
Visualizations
Title: Validation Pipeline for Next-Gen Surgical Fluorophores
Title: Molecular Targeting Strategy: ICG vs. Next-Gen Agent
Conclusion
ICG fluorescence-guided laparoscopic cholecystectomy represents a significant advancement in intraoperative visualization, offering a real-time, non-invasive method for delineating biliary anatomy and augmenting the Critical View of Safety. The protocol, rooted in a clear understanding of ICG pharmacokinetics and imaging physics, provides a standardized yet adaptable framework for clinical application. While technical challenges exist, systematic troubleshooting and optimization can maximize its efficacy. Robust comparative evidence validates its role in potentially reducing bile duct injury and improving surgical outcomes. For researchers and drug development professionals, this protocol establishes a benchmark for evaluating current clinical practice and paves the way for future innovation, including the development of targeted fluorophores, quantitative imaging analytics, and integration with augmented reality systems, ultimately driving the evolution of precision hepatobiliary surgery.