NIR Fluorescence Imaging Explained: Principles, Techniques, and Applications in Biomedical Research
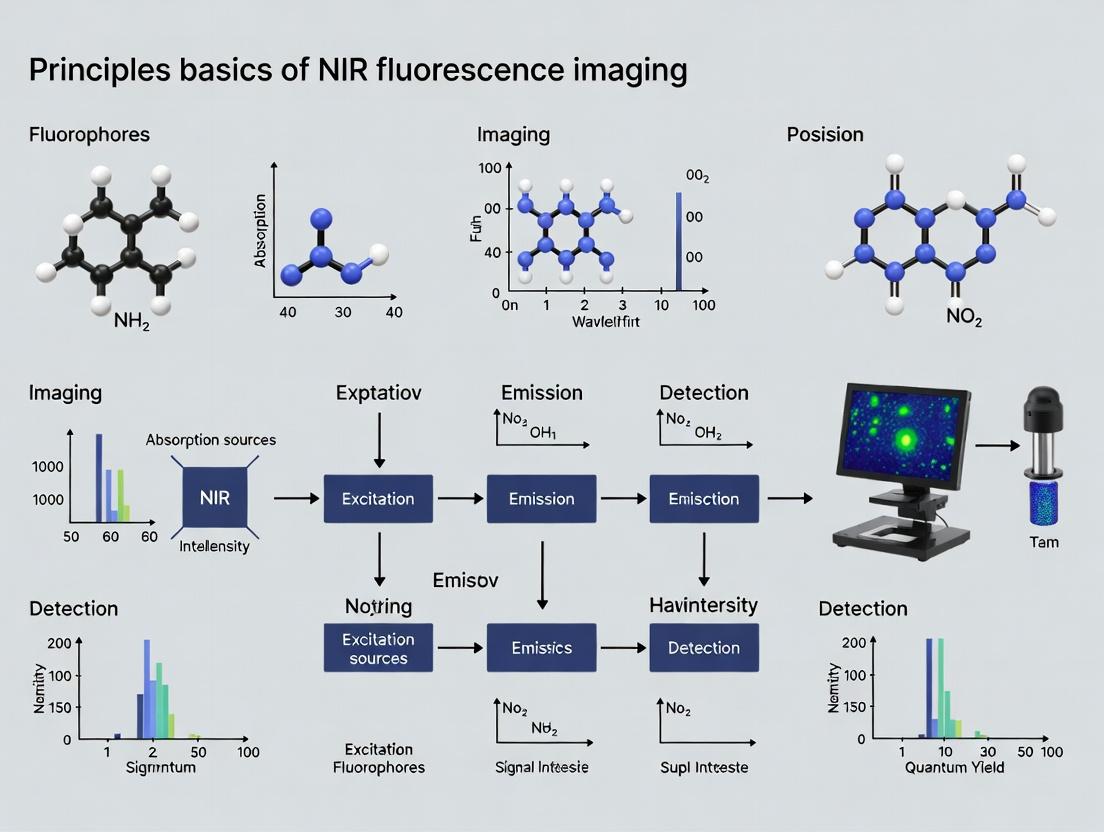
This comprehensive guide details the core principles of Near-Infrared (NIR) fluorescence imaging, an indispensable tool for biomedical research and drug development.
NIR Fluorescence Imaging Explained: Principles, Techniques, and Applications in Biomedical Research
Abstract
This comprehensive guide details the core principles of Near-Infrared (NIR) fluorescence imaging, an indispensable tool for biomedical research and drug development. We explore the foundational physics behind tissue transparency and fluorophore properties in the 'biological window.' The article outlines practical methodologies for probe design and image acquisition across preclinical and clinical settings. It provides troubleshooting strategies to enhance signal quality and quantitative accuracy. Finally, we compare NIR imaging with other modalities and discuss its validation for quantitative biodistribution and pharmacokinetic studies, offering researchers a complete framework for implementing this powerful imaging technique.
Unveiling the NIR Window: The Science Behind Deep-Tissue Fluorescence Imaging
Within the broader thesis on Near-Infrared (NIR) fluorescence imaging principles, defining the specific spectral regions of the 'biological window' is foundational. The biological window refers to the range of wavelengths where the absorption and scattering of light by biological tissues (primarily by hemoglobin, water, and lipids) are minimized, allowing for deeper penetration and higher resolution imaging. This guide provides an in-depth technical comparison of the first (NIR-I) and second (NIR-II) biological windows, central to advancing in vivo imaging for research and drug development.
The NIR Spectrum: Defining the Windows
Fundamental Optical Properties of Tissue
The utility of NIR light stems from the reduced interaction with major tissue chromophores. The key absorbers have distinct minima in the NIR range, creating windows of opportunity for imaging.
Table 1: Primary Tissue Chromophores and Their Absorption Characteristics
| Chromophore | Peak Absorption Regions | Relative Absorption in NIR-I (750-900 nm) | Relative Absorption in NIR-II (1000-1700 nm) |
|---|---|---|---|
| Hemoglobin (Oxy & Deoxy) | ~400-600 nm (Visible) | Low (10-100x lower than visible) | Very Low |
| Water | ~980 nm, >1400 nm | Moderate (local peak at 980 nm) | Low (900-1350 nm), High (>1400 nm) |
| Lipids | ~930 nm, 1200 nm | Low to Moderate | Low to Moderate |
| Melanin | Broadband, decreases with λ | Moderate | Low |
NIR-I vs. NIR-II: A Quantitative Comparison
Table 2: Comparative Analysis of NIR-I and NIR-II Biological Windows
| Parameter | NIR-I Window | NIR-II Window |
|---|---|---|
| Spectral Range | 750 - 900 nm | 1000 - 1700 nm (Optimal: 1000-1350 nm) |
| Typical Emission Source | Organic dyes (e.g., ICG, Cy7), Quantum Dots | Organic Dyes, Quantum Dots, Single-Walled Carbon Nanotubes, Rare-Earth Nanoparticles |
| Tissue Scattering | Higher (~λ^-4 dependence) | Significantly Reduced (~λ^-1 to λ^-2 dependence) |
| Photon Penetration Depth | 1-3 mm (typical for high-res) | 3-8 mm (or greater), up to ~1 cm demonstrated |
| Autofluorescence | Moderate (from tissues & substrates) | Greatly Reduced (near-zero background) |
| Maximum Spatial Resolution | ~2-5 µm (surface), degrades with depth | Can be <10 µm at several mm depth |
| Signal-to-Background Ratio (SBR) | Moderate (often <10:1) | High (often >50:1) |
| Common Detectors | Silicon CCD/CMOS (cuts off ~1000 nm) | InGaAs, PbS, or other cooled SWIR cameras |
Key Experimental Protocols for Characterization
Protocol 1: Measuring Tissue Optical Properties for Window Determination
Objective: Quantify reduced scattering (μs') and absorption (μa) coefficients across NIR wavelengths. Materials: Tissue-simulating phantoms or ex vivo tissue samples, tunable NIR laser source (750-1600 nm), integrating sphere spectrometer, lock-in amplifier for sensitive detection. Methodology:
- Prepare tissue phantoms with known concentrations of scatterers (e.g., Intralipid) and absorbers (e.g., India Ink, hemoglobin solution).
- For each wavelength, illuminate the sample with a collimated beam.
- Use the integrating sphere to measure total reflectance (Rd) and total transmittance (Tt).
- Apply the Inverse Adding-Doubling (IAD) algorithm to Rd and Tt measurements to compute μa and μs'.
- Plot μa and μs' vs. wavelength. The biological windows are identified as regions where μa is at a global minimum and μs' is low.
Protocol 2: In Vivo Comparison of NIR-I vs. NIR-II Fluorescence Imaging
Objective: Directly compare imaging performance of a dual-emissive probe in the same subject. Materials: Nude mouse model, NIR-I/NIR-II dual-emissive probe (e.g., certain rare-earth-doped nanoparticles), NIR-I camera (Si-based), NIR-II camera (InGaAs-based), anesthesia setup, image co-registration software. Methodology:
- Administer the fluorescent probe intravenously to the anesthetized animal.
- Position the animal under a dual-camera imaging system equipped with appropriate long-pass filters.
- Acquire time-series images in both NIR-I and NIR-II channels simultaneously post-injection.
- Quantify key metrics from the same region of interest (ROI):
- Signal-to-Noise Ratio (SNR): (Mean Signal in ROI) / (Standard Deviation of Background).
- Signal-to-Background Ratio (SBR): (Mean Signal in Target Tissue) / (Mean Signal in Adjacent Tissue).
- Penetration Depth Estimation: Image a target (e.g., blood vessel, tumor) and measure the maximum tissue thickness through which it can be clearly resolved.
- Generate comparative graphs of SNR/SBR vs. time and depth for both windows.
Visualizing the Principles
Title: NIR Photon Interaction with Tissue Defines the Biological Window
Title: In Vivo NIR-I vs NIR-II Imaging Experimental Workflow
The Scientist's Toolkit: Key Research Reagent Solutions
Table 3: Essential Materials for NIR Biological Window Research
| Item | Function & Relevance | Example Product/Category |
|---|---|---|
| NIR-I Fluorophores | Emit in the 750-900 nm range; foundational for standard deep-tissue imaging. | Indocyanine Green (ICG), Cyanine Dyes (Cy7, IRDye800CW), NIR-I Quantum Dots. |
| NIR-II Fluorophores | Emit in the 1000-1700 nm range; enable superior penetration and resolution. | Organic Dyes (e.g., CH-4T, IR-E1050), PbS/CdSe Quantum Dots, Single-Walled Carbon Nanotubes, Rare-Earth Nanoparticles (NaYF₄:Yb,Er). |
| Tissue-Simulating Phantoms | Mimic tissue optical properties (μs', μa) for system calibration and method validation. | Intralipid-based phantoms, silicone phantoms with India Ink & TiO₂, commercial solid phantoms. |
| NIR-I Detector | Converts NIR-I photons to electrical signal; essential for NIR-I data capture. | Silicon-based CCD or sCMOS cameras (e.g., from Hamamatsu, Andor). |
| NIR-II/SWIR Detector | Sensitive to longer wavelengths (>1000 nm) where silicon is blind. | Cooled InGaAs cameras (e.g., from Princeton Instruments, Teledyne), PbS cameras. |
| Spectrally-Matched Filters | Isolate specific emission bands and block excitation laser light. | Long-pass, band-pass, and short-pass filters from Thorlabs, Semrock, Chroma. |
| Tunable NIR Laser Source | Provides precise wavelength selection for excitation and property measurement. | Optical Parametric Oscillator (OPO) lasers, Ti:Sapphire lasers with extenders, tunable diode lasers. |
| Image Analysis Software | Enables quantification of SNR, SBR, kinetic profiling, and 3D reconstruction. | ImageJ (FIJI) with plugins, Living Image, MATLAB with image processing toolbox. |
The precise definition and differentiation of the NIR-I and NIR-II biological windows are critical for optimizing fluorescence imaging strategies. As evidenced by quantitative optical measurements and in vivo protocols, the NIR-II window offers distinct advantages in penetration depth and spatial resolution due to profoundly reduced scattering and autofluorescence. This understanding directly informs the selection of fluorophores, instrumentation, and protocols within the broader thesis, guiding researchers and drug developers toward more effective in vivo diagnostic and therapeutic monitoring tools.
This whitepaper explores the fundamental biophysical and optical principles underlying the superior tissue penetration of near-infrared (NIR) light compared to visible light. Framed within the broader thesis of NIR fluorescence imaging development, this analysis is critical for researchers designing in vivo imaging protocols, diagnostic agents, and therapeutic systems. The deeper penetration of the NIR window (approximately 650-1350 nm) is not a singular phenomenon but a confluence of reduced scattering and minimized absorption by endogenous chromophores.
Core Physical Principles
The propagation of light through biological tissue is governed by the interplay of absorption and scattering. The total attenuation is described by the reduced scattering coefficient (μs'), the absorption coefficient (μa), and the effective attenuation coefficient (μeff). The depth at which light intensity falls to 1/e (≈37%) of its incident value is defined as the effective penetration depth (δ = 1/μeff).
The Role of Endogenous Chromophores
Key tissue components have distinct absorption spectra:
- Hemoglobin (Oxy- and Deoxy-): Primary absorbers in the visible range (400-600 nm peaks).
- Melanin: Strong, broadband absorption decreasing from UV to NIR.
- Water: Absorption is minimal in the visible range but rises significantly after ~900 nm, with major peaks in the IR.
- Lipids: Exhibit absorption bands in the NIR region.
The "optical window" or "therapeutic window" in the NIR arises from the collective minima of these absorbers.
Scattering Dynamics
Scattering in tissue is predominantly forward-directed (Mie scattering) and is highly wavelength-dependent. A simplified approximation states that the reduced scattering coefficient decreases with increasing wavelength according to a power law: μs' ∝ λ^(-b), where the scattering power b ranges from ~0.2 (for large scatterers) to ~4 (Rayleigh scattering for small particles). In tissue, b is typically between 0.5 and 2, meaning longer NIR wavelengths scatter less than shorter visible wavelengths.
Table 1: Optical Properties of Human Tissue (Approximate Representative Values)
| Wavelength (nm) | Region | μa - Absorption Coefficient (cm⁻¹) | μs' - Reduced Scattering Coefficient (cm⁻¹) | μeff - Effective Attenuation (cm⁻¹) | Penetration Depth δ (mm) |
|---|---|---|---|---|---|
| 450 (Blue) | Visible | 1.5 - 3.0 | 40 - 60 | 10 - 15 | 0.7 - 1.0 |
| 532 (Green) | Visible | 0.8 - 1.5 | 30 - 50 | 8 - 12 | 0.8 - 1.3 |
| 633 (Red) | Visible | 0.3 - 0.6 | 20 - 30 | 4 - 7 | 1.4 - 2.5 |
| 650 | NIR-I Edge | 0.2 - 0.3 | 15 - 25 | 3 - 5 | 2.0 - 3.3 |
| 800 | NIR-I | 0.1 - 0.2 | 10 - 15 | 2 - 3 | 3.3 - 5.0 |
| 1064 | NIR-II | 0.1 - 0.3 | 6 - 10 | 1.5 - 2.5 | 4.0 - 6.7 |
Sources: Combined data from live-search results of recent review articles on tissue optics (2022-2024). Values are highly tissue-type dependent; dermis/muscle is modeled.
Table 2: Absorption Peaks of Key Tissue Chromophores
| Chromophore | Primary Absorption Peaks (nm) | Relevance to Optical Window |
|---|---|---|
| Hemoglobin | ~415 (Soret), ~540, ~575 | Dominates visible absorption |
| Melanin | Broadband, decreasing to NIR | Limits surface penetration |
| Water | ~980, >1150, peak at 1450+ | Defines long-wavelength NIR limit (~1350 nm) |
| Lipids | ~930, 1040, 1210 | Creates minor absorption bands in NIR |
Experimental Protocols for Validation
Protocol: Measuring Tissue Optical Properties Using Integrating Sphere Spectroscopy
Objective: To experimentally determine μa and μs' of ex vivo tissue samples across visible and NIR wavelengths.
Materials:
- Double or single integrating sphere setup.
- Broadband light source (e.g., Tungsten-Halogen) and monochromator or tunable laser.
- Spectrophotometer or sensitive detectors (Si for Vis-NIR-I, InGaAs for NIR-II).
- Fresh or preserved tissue samples (e.g., porcine skin, muscle), sliced to precise thicknesses (0.5-2 mm).
- Reflective standards (e.g., Spectralon).
Methodology:
- Sample Preparation: Tissue is sliced uniformly using a vibratome. Thickness is measured with a micrometer.
- System Calibration: Perform baseline measurements with the sphere empty and with the reflectance standard.
- Measurement: Place the sample at the entrance port of the sphere (for total transmission, Tt) or at the reflection port (for total reflection, Rd). Illuminate with collimated light at specific wavelengths from 400 nm to 1300 nm in 10 nm increments.
- Data Acquisition: Record the diffuse reflectance (Rd) and total transmittance (Tt) spectra.
- Inverse Adding-Doubling (IAD): Input Rd and Tt data into IAD software. The algorithm iteratively solves the radiative transport equation to calculate μa and μs' for each wavelength.
- Analysis: Plot μa(λ) and μs'(λ). The penetration depth δ(λ) is calculated as δ = 1 / μeff, where μeff = sqrt(3 * μa * (μa + μs')).
Protocol: Comparative Penetration Depth Measurement using Phantom Studies
Objective: To visually and quantitatively demonstrate the difference in penetration depth between visible and NIR light.
Materials:
- Tissue-mimicking phantom (e.g., Intralipid suspension for scattering, India ink for absorption, agarose for solidification).
- Laser diodes or LEDs at 532 nm (green), 633 nm (red), and 808 nm (NIR).
- NIR-sensitive camera (CCD for 808 nm) and visible camera.
- Calibrated depth ruler embedded in phantom.
Methodology:
- Phantom Preparation: Create a semi-infinite block phantom with homogeneous optical properties (e.g., μs' ≈ 10 cm⁻¹, μa ≈ 0.1 cm⁻¹ at 800 nm).
- Beam Setup: Collimate each light source to a narrow beam and incident perpendicularly on the phantom surface.
- Imaging: In a darkened room, capture side-view images of the phantom as light propagates and diffuses. Use appropriate filters for the detection camera.
- Quantification: Use image analysis software to plot the light intensity profile as a function of depth from the source. Determine the depth where intensity drops to 1/e of the surface intensity for each wavelength.
- Validation: Compare experimental δ values with those predicted by diffusion theory using the known phantom properties.
Visualizing the Principles
Title: Light-Tissue Interaction Pathways for Visible vs NIR Light
Title: Wavelength-Dependent Optical Properties & Penetration
The Scientist's Toolkit: Research Reagent Solutions
Table 3: Essential Materials for NIR Penetration & Imaging Studies
| Item | Function & Relevance to NIR Penetration Studies |
|---|---|
| Intralipid 20% Emulsion | A standardized lipid emulsion used to create tissue-mimicking phantoms for scattering. Its scattering properties are well-characterized across Vis-NIR spectra. |
| India Ink | A strong, broadband absorber used in controlled amounts in phantoms to mimic tissue absorption (μa). |
| Agarose or Polyvinyl Chloride (PVA) | Gel matrix materials for solidifying liquid phantoms into stable, handleable slabs or cylinders for depth profiling experiments. |
| NIR Fluorophores (e.g., IRDye 800CW, ICG) | Exogenous contrast agents with excitation/emission in the NIR window. Used to experimentally validate signal recovery from depth. |
| Hemoglobin Powder (Lyophilized) | Used to spike phantom solutions to specifically study the impact of blood absorption on penetration depth. |
| Spectralon Diffuse Reflectance Standards | Provides >99% diffuse reflectance across a broad spectrum. Critical for calibrating integrating sphere measurements to determine μa and μs'. |
| InGaAs Photodetector / Camera | Semiconductor detectors sensitive in the NIR-I to NIR-II range (900-1700 nm), where silicon detectors fail. Essential for quantitative light detection. |
| Monte Carlo Simulation Software (e.g., MCML) | Computational tool to model photon transport in tissue with user-defined μa, μs', and anisotropy (g). Predicts penetration profiles before physical experiments. |
The enhanced penetration of NIR light is a cornerstone of modern biomedical optics. It enables non-invasive fluorescence imaging of deeper structures, improves signal-to-background ratio by reducing autofluorescence, and forms the physical basis for techniques like diffuse optical tomography and NIR photodynamic therapy. For drug development professionals, understanding these principles informs the design of NIR-labeled therapeutic agents and the optimization of imaging windows for preclinical in vivo studies. Ongoing research in the NIR-II region (1000-1700 nm) promises even greater penetration depths due to further reduced scattering, pushing the boundaries of non-invasive optical diagnostics.
Essential Components of an NIR Fluorescence Imaging System
Within the broader research on Near-Infrared (NIR) fluorescence imaging principles, understanding the specific, integrated hardware and software components is fundamental. This technical guide details the essential subsystems required to capture, process, and quantify NIR fluorescence signals in preclinical and biomedical research, forming the physical basis upon which experimental protocols and biological discovery rely.
Core System Components
An effective NIR fluorescence imaging system integrates several key modules to achieve high sensitivity and quantitative accuracy.
The light source must provide sufficient power at the optimal wavelength to excite the fluorophore.
- Common Types: Laser diodes and Light-Emitting Diodes (LEDs).
- Key Parameters: Wavelength (typically 650-850 nm), power output (mW), and uniformity of illumination.
- Function: Provides photons to excite NIR fluorophores from ground state to an excited state.
Wavelength Selection Filters
Optical filters are critical for isolating the specific excitation and emission light, separating the weak fluorescence signal from intense excitation light.
- Excitation Filter: Placed between the light source and the subject, it transmits only the narrow band of wavelengths for fluorophore excitation.
- Emission Filter: Placed between the subject and the camera, it blocks scattered excitation light and transmits only the longer-wavelength fluorescence emission.
High-Sensitivity NIR Camera (Detector)
The camera is the primary sensor for capturing the emitted fluorescence photons. Performance specifications directly dictate image quality.
- Detector Type: Charge-Coupled Device (CCD) or, more commonly now, scientific Complementary Metal-Oxide-Semiconductor (sCMOS) cameras.
- Cooling: Essential to reduce dark current (thermal noise). Cameras are often cooled to -30°C to -90°C.
- Quantum Efficiency (QE): The percentage of photons hitting the sensor that are detected. High QE (>80%) in the NIR range is crucial.
- Pixel Size and Bit Depth: Larger pixels often offer better light collection; higher bit depth (e.g., 16-bit) provides greater dynamic range for quantification.
Imaging Enclosure & Optics
A light-tight chamber eliminates ambient light. Lenses (fixed or variable focus) with high NIR transmission collect and focus emitted light onto the camera sensor. Some systems include multiple field-of-view (FOV) options for whole-body or high-resolution imaging.
Animal Handling & Anesthesia Delivery
For in vivo studies, an integrated anesthesia system (e.g., isoflurane vaporizer with nose cones) and a heated stage are mandatory to maintain animal viability and minimize motion artifacts during longitudinal imaging sessions.
Acquisition and Analysis Software
Software controls hardware parameters and enables data extraction. Essential features include:
- Acquisition Control: Setting exposure time, FOV, binning, and filter positions.
- Radiometric Calibration: Using calibration standards to convert pixel values to radiance (e.g., p/s/cm²/sr).
- Region-of-Interest (ROI) Analysis: Quantifying total flux or average radiance from specific areas.
- Spectral Unmixing: Separating signals from multiple fluorophores with overlapping spectra.
Table 1: Quantitative Comparison of Key Detector Parameters
| Parameter | CCD Camera | sCMOS Camera | Importance |
|---|---|---|---|
| Quantum Efficiency (NIR) | ~60-80% | ~80-95% | Determines sensitivity; higher is better. |
| Read Noise (at high speed) | 5-10 e⁻ | 1-2 e⁻ | Lower noise improves low-light signal detection. |
| Dark Current (cooled) | ~0.001 e⁻/pix/s | ~0.001-0.01 e⁻/pix/s | Reduced by cooling; affects long exposures. |
| Pixel Size | 6.5 - 13 µm | 6.5 - 11 µm | Larger pixels collect more light but reduce resolution. |
| Dynamic Range | 16-bit (65,536:1) | 16-bit to 20-bit | Higher range allows simultaneous imaging of bright & dim signals. |
Experimental Protocol: Quantitative In Vivo Imaging of a Targeted NIR Probe
This protocol outlines a standard methodology for validating a new NIR fluorescent probe in a murine xenograft model.
1. System Startup and Calibration:
- Power on the imaging system and cooling camera for 30+ minutes to stabilize temperature.
- Acquire a dark image (exposure with closed shutter) and a reference flat-field image using a uniform NIR-emitting standard (e.g., stable fluorescent epoxy block).
- Load the system's radiometric calibration curve file.
2. Animal Model Preparation:
- Implant tumor cells subcutaneously in an immunodeficient mouse. Allow tumors to grow to ~100-300 mm³.
- Inject the NIR fluorescently-labeled targeting agent (e.g., antibody-dye conjugate) intravenously via the tail vein. Use a control group injected with a non-targeted version of the dye.
3. Image Acquisition:
- Anesthetize the mouse using 2% isoflurane in oxygen and place it in the imaging chamber, maintaining anesthesia at 1.5-2%.
- Position the animal in the desired orientation (ventral or dorsal).
- In the acquisition software:
- Select the appropriate filter set (e.g., 785 nm excitation / 820 nm emission).
- Set a series of exposure times (e.g., 1, 5, 10 seconds) to ensure signal is within the linear range of the camera.
- Acquire a white-light photograph.
- Acquire the fluorescence image(s).
- Acquire an image of a control mouse injected with the non-targeted probe.
4. Image Analysis and Quantification:
- Subtract the dark image from all fluorescence images.
- Apply the flat-field correction if necessary.
- Use the radiometric calibration to convert pixel values to absolute radiance (p/s/cm²/sr).
- Draw Regions of Interest (ROIs) around the tumor and a contralateral background tissue area.
- Record the average radiance for each ROI.
- Calculate the Tumor-to-Background Ratio (TBR) as: (Average Tumor Radiance) / (Average Background Radiance).
5. Ex Vivo Validation:
- After the final time point, euthanize the animal and harvest the tumor and major organs (liver, spleen, kidneys, heart, lungs, muscle).
- Image all ex vivo tissues using the same system settings.
- Quantify signal in each tissue ROI and calculate %Injected Dose per Gram (%ID/g) if a dose calibration curve was established.
Visualizing the Imaging Workflow
Diagram Title: In Vivo NIR Fluorescence Imaging and Analysis Workflow
The Scientist's Toolkit: Key Research Reagent Solutions
Table 2: Essential Materials for NIR Fluorescence Imaging Experiments
| Item | Function & Role in Experiment |
|---|---|
| NIR Fluorophores (e.g., ICG, IRDye 800CW, Cy7) | The light-emitting molecule. Conjugated to targeting vectors (antibodies, peptides) or used as free agents for perfusion/angiography studies. |
| Target-Specific Bioconjugates | Antibody-, peptide-, or small molecule-dye conjugates that provide molecular specificity, enabling imaging of specific biomarkers (e.g., EGFR, PSMA). |
| Control Probes (Non-targeted, Isotype-matched) | Critical for establishing specificity of signal. Differentiates targeted accumulation from enhanced permeability and retention (EPR) effects. |
| Fluorescent Calibration Standards | Stable, uniform sources of known fluorescence intensity (solid phantoms or liquid solutions). Essential for converting pixel values to quantitative radiance units. |
| Matrigel / Cell Culture Media | For preparing and implanting tumor xenografts or other cellular models in rodents. |
| Isoflurane / Anesthesia System | Maintains animal immobility and physiological stability during image acquisition, which is critical for longitudinal studies and quantitative comparison. |
| Reflective/Black Background Imaging Plates | Standardizes background signal. A black plate minimizes reflection; a reflective plate can enhance signal collection from translucent samples. |
| Phosphate-Buffered Saline (PBS) | Used as a diluent for probes and for terminal perfusion to clear blood-pool fluorescence before ex vivo organ imaging. |
Thesis Context: This technical guide details the fundamental photophysical properties of fluorophores within the broader research thesis on optimizing Near-Infrared (NIR) fluorescence imaging for in vivo applications, emphasizing deeper tissue penetration, reduced autofluorescence, and enhanced signal-to-noise ratios in preclinical drug development.
Core Photophysical Properties
A fluorophore's utility, especially in NIR imaging, is determined by three interdependent properties.
The excitation spectrum defines the range of wavelengths a fluorophore absorbs to reach an excited electronic state. The emission spectrum is the range of wavelengths emitted as the fluorophore relaxes to the ground state. The difference between the peak excitation and peak emission wavelengths is the Stokes shift. A large Stokes shift is critical in NIR imaging to minimize crosstalk between the excitation light and the emitted signal.
Quantum Yield (Φ)
Quantum yield is the ratio of the number of photons emitted to the number of photons absorbed. It is a direct measure of the efficiency of the fluorescence process. Φ = Number of photons emitted / Number of photons absorbed
A quantum yield of 1.0 (or 100%) indicates perfect efficiency, while a value of 0 indicates no emission.
Brightness (ε × Φ)
The practical brightness of a fluorophore is the product of its molar extinction coefficient (ε, a measure of how strongly it absorbs light at a specific wavelength) and its quantum yield (Φ). This value determines the signal intensity achievable per fluorophore molecule. Brightness = ε (M⁻¹cm⁻¹) × Φ
Quantitative Comparison of Common Fluorophore Classes
Table 1: Key Properties of Representative Fluorophores Across Spectral Ranges.
| Fluorophore Class / Example | Excitation λ (nm) | Emission λ (nm) | Stokes Shift (nm) | Extinction Coefficient ε (M⁻¹cm⁻¹) | Quantum Yield (Φ) | Brightness (ε × Φ) |
|---|---|---|---|---|---|---|
| Organic Dye (FITC) | 495 | 519 | 24 | ~75,000 | 0.79 | ~59,250 |
| Phycobiliprotein (APC) | 650 | 660 | 10 | ~700,000 | 0.68 | ~476,000 |
| NIR-I Cyanine Dye (Cy7) | 750 | 773 | 23 | ~200,000 | 0.28 | ~56,000 |
| NIR-II Organic Dye (IR-26) | 1064 | ~1300 | >200 | ~1,200 (in film) | 0.05* | ~60 |
| Quantum Dot (QD705) | 400-500 | 705 | >200 | ~2,000,000* | 0.50-0.70 | ~1,200,000 |
*Values are highly dependent on specific environment and formulation. NIR-II dye brightness is inherently lower but imaging performance benefits from drastically reduced tissue scattering. QD ε is approximated for the broad absorption feature.
Detailed Experimental Protocol for Characterizing Fluorophore Properties
Protocol: Determination of Quantum Yield Using a Comparative Method
Principle: The quantum yield of an unknown sample (X) is determined by comparing its fluorescence intensity and absorbance to a reference standard (R) with a known quantum yield, measured under identical conditions.
Materials (Research Reagent Solutions Toolkit): Table 2: Essential Reagents and Materials for Fluorophore Characterization.
| Item | Function |
|---|---|
| Fluorophore of Unknown Φ (X) | The sample to be characterized, in a suitable solvent. |
| Reference Fluorophore Standard (R) | A dye with known Φ in the same solvent (e.g., Rhodamine 6G in ethanol, Φ=0.94). |
| Spectrophotometer | For precise measurement of absorbance (A) at the excitation wavelength. Must be calibrated. |
| Fluorometer (Spectrofluorometer) | For recording corrected emission spectra. Requires wavelength and intensity calibration. |
| Matched Quartz Cuvettes | Low fluorescence, 10 mm pathlength cuvettes for both absorbance and fluorescence. |
| Degassed Solvent | High-purity solvent (e.g., ethanol, PBS) to prevent quenching by oxygen. |
| Integration Sphere (Optional) | For absolute quantum yield measurement of scattering samples or thin films. |
Methodology:
- Sample Preparation: Prepare dilute solutions of the unknown (X) and reference (R) fluorophores in the same degassed solvent. The target absorbance at the chosen excitation wavelength (λ_ex) should be below 0.05 to avoid inner filter effects.
- Absorbance Measurement: Record the UV-Vis absorption spectrum of both X and R. Note the absorbance (A) at λ_ex. Use A = εcl to ensure concentration is appropriate.
- Emission Measurement: Using the fluorometer, excite both X and R at the same λ_ex. Record the corrected emission spectrum for each sample. Ensure instrument settings (slit widths, gain, detector voltage) are identical for both measurements.
- Data Analysis:
a. Integrate the area under the fluorescence emission curve (F) for both X and R.
b. Calculate the quantum yield of the unknown (ΦX) using the formula:
ΦX = ΦR × (FX / FR) × (AR / AX) × (ηX² / ηR²)
Where:
- ΦR = Known quantum yield of the reference.
- F = Integrated fluorescence intensity.
- A = Absorbance at the excitation wavelength.
- η = Refractive index of the solvent (approximately equal if the same solvent is used, so this term often cancels out).
- Repeatability: Perform measurements in triplicate using independently prepared samples to calculate a mean Φ_X and standard deviation.
Visualization of Photophysical Processes and Experimental Workflow
Title: Jablonski Diagram & Key Fluorescence Processes
Title: Quantum Yield Determination Workflow
Near-infrared (NIR) fluorescence imaging (typically 700-1700 nm) is a pivotal non-invasive modality for biomedical research and pre-clinical drug development. Its advantages include reduced tissue autofluorescence, lower light scattering, and deeper tissue penetration. The efficacy of this technique is fundamentally dependent on contrast agents. This whitepaper provides a technical comparison of three major classes: organic dyes, quantum dots, and advanced nanomaterials, contextualized within the core principles of NIR imaging research.
Core Classes of Contrast Agents
Organic Dyes
Organic fluorophores are small-molecule compounds with conjugated π-electron systems. For NIR-I (700-900 nm) and NIR-II (1000-1700 nm) windows, common classes include cyanines (e.g., ICG, IRDye series), phthalocyanines, and BODIPY derivatives.
Key Characteristics:
- Rapid clearance: Suitable for dynamic imaging.
- Potential for chemical modification: Can be conjugated to targeting ligands.
- Limitations: Often exhibit lower photostability, moderate quantum yield (QY) in NIR-II, and a tendency to aggregate.
Quantum Dots (QDs)
QDs are semiconductor nanocrystals (e.g., PbS, Ag2S, InAs) with size-tunable emission due to quantum confinement.
Key Characteristics:
- Broad absorption, narrow emission: Enables multiplexing with single excitation source.
- High brightness and photostability.
- Limitations: Potential toxicity concerns due to heavy metal content (e.g., Cd, Pb), although newer compositions (e.g., Ag2S, CuInSeS) are more biocompatible. Larger hydrodynamic size can affect biodistribution.
Nanomaterials
This broad class includes carbon nanotubes (SWCNTs), rare-earth-doped nanoparticles (RENPs), and other inorganic nanostructures designed for NIR fluorescence.
Key Characteristics:
- Engineerable platforms: Can integrate targeting, therapy, and multiple imaging modalities.
- Superior photophysical properties: Some (e.g., SWCNTs, certain RENPs) exhibit exceptional brightness and photostability in NIR-II.
- Complex pharmacokinetics: Size, shape, and surface coating critically dictate biocompatibility and clearance pathways.
Quantitative Comparison of Key Parameters
Table 1: Comparative Properties of NIR Contrast Agent Classes
| Property | Organic Dyes (e.g., IRDye 800CW) | Quantum Dots (e.g., Ag2S QDs) | Nanomaterials (e.g., SWCNTs, RENPs) |
|---|---|---|---|
| Typical Size (nm) | 1-2 | 3-10 (core+shell) | 20-200 (hydrodynamic) |
| Molar Extinction (M⁻¹cm⁻¹) | ~2.5 x 10⁵ | 1-5 x 10⁶ | Varies widely (up to ~10⁹ for assemblies) |
| Quantum Yield (NIR-II) | Low to moderate (0.5-5%) | Moderate to High (5-20%) | Low to High (1-15% for SWCNTs) |
| Stokes Shift (nm) | Small to moderate (10-30) | Very Large (100-400) | Large (100-300) |
| Photostability | Low to Moderate | Very High | Very High |
| Ex/Em Max (nm) | ~780/800 (NIR-I) | Tunable (e.g., 808/1200) | Varies (e.g., 808/1550 for Er³⁺) |
| Biodegradability | Yes | No | Typically No |
| Primary Clearance Route | Hepatic/Renal (size-dependent) | Reticuloendothelial System (RES) | Predominantly RES |
Table 2: Summary of Recent In Vivo Performance Metrics (Selected Studies)
| Agent Type | Model | Excitation (nm) | Emission (nm) | Key Metric (e.g., Resolution, Depth) | Reference Year |
|---|---|---|---|---|---|
| Cyanine Dye (CH-4T) | Mouse hindlimb vasculature | 808 | 1000-1700 | ~45 μm resolution at ~3 mm depth | 2022 |
| Ag2S Quantum Dots | U87MG tumor mouse | 808 | 1200 | Tumor-to-background ratio >8 at 48h post-injection | 2023 |
| Er³⁺-doped Nanoparticle | Mouse brain vasculature | 808 | 1550 | ~6 μm resolution, penetration >2 mm in skull | 2023 |
| PEGylated SWCNTs | Mouse coronary vasculature | 808 | 1000-1700 | Real-time imaging at >5 mm depth | 2022 |
Experimental Protocols for Key Evaluations
Protocol 1: Determining Quantum Yield (QY) in NIR-II
Objective: Measure the absolute or relative fluorescence QY of a novel NIR-II agent. Materials: NIR-II spectrometer with integrating sphere, reference dye (e.g., IR-26 in DCE, QY=0.5%), sample in transparent solvent. Method:
- System Calibration: Record blank solvent spectrum.
- Reference Measurement: Place reference dye cuvette in sphere. Record absorption (Aref) and integrated fluorescence emission spectra (Eref) at known excitation wavelength (λ_ex).
- Sample Measurement: Repeat for sample solution (Asam, Esam).
- Calculation: Apply formula: QYsam = QYref * (Esam / Eref) * (Aref / Asam) * (ηsam² / ηref²), where η is refractive index of solvent.
Protocol 2: In Vivo Pharmacokinetics and Biodistribution
Objective: Quantify blood circulation half-life and organ accumulation of a contrast agent. Materials: Mouse model, IVIS Spectrum CT or equivalent NIR imager, analysis software (e.g., Living Image). Method:
- Baseline Imaging: Anesthetize mouse and acquire pre-injection NIR images (λex/λem as per agent).
- Agent Administration: Intravenously inject a standardized dose (e.g., 100 μL of 100 μM solution) via tail vein.
- Time-Series Imaging: Acquire sequential images at defined intervals (e.g., 5 min, 30 min, 1h, 4h, 24h, 48h).
- Region of Interest (ROI) Analysis: Draw ROIs over major organs (liver, spleen, kidneys, tumor) and a background tissue region.
- Quantification: Calculate total radiant efficiency ([p/s/cm²/sr] / [μW/cm²]) for each ROI. Plot signal vs. time for blood clearance (using heart ROI) and organ uptake.
Protocol 3: Targeted vs. Non-Targeted Tumor Imaging
Objective: Compare the specificity of a targeted nanomaterial conjugate. Materials: Two groups of tumor-bearing mice; Targeted agent (e.g., anti-EGFR conjugated QD); Non-targeted control (PEGylated QD). Method:
- Group Administration: Inject Group A (n=5) with targeted agent, Group B (n=5) with non-targeted control.
- In Vivo Imaging: Conduct longitudinal imaging at 1h, 4h, 24h, and 48h.
- Ex Vivo Validation: Euthanize mice at terminal time point. Excise tumors and major organs. Image ex vivo to quantify absolute agent accumulation.
- Statistical Analysis: Compare tumor-to-muscle ratio and tumor-to-liver ratio between groups using Student's t-test (p<0.05 significant).
Visualizations
NIR Imaging Principle Workflow
Agent Biodistribution & Clearance Pathways
The Scientist's Toolkit: Research Reagent Solutions
Table 3: Essential Materials for NIR Contrast Agent Research
| Item (Example) | Function & Explanation |
|---|---|
| Indocyanine Green (ICG) | FDA-approved cyanine dye for NIR-I (∼800 nm); used as a benchmark for pharmacokinetics and perfusion imaging. |
| IRDye 800CW NHS Ester | Commercially available, reactive NIR-I dye for reliable, reproducible bioconjugation to antibodies or peptides. |
| PbS/CdS Core/Shell QDs | Bright, commercially available NIR-II QDs with tunable emission; used for proof-of-concept deep-tissue imaging studies. |
| Amino-PEG-Thiol Ligand | Used to coat QDs/nanoparticles to improve aqueous solubility, biocompatibility, and provide a handle for further conjugation. |
| Dylight 755 Antibody Labeling Kit | Standardized kit for reliably labeling targeting antibodies with a stable, bright NIR fluorophore. |
| Matrigel Matrix | Used for establishing subcutaneous tumor xenograft models to evaluate targeted agent performance in vivo. |
| NIR-II Fluorescence Microsphere Standards | Calibration standards with known fluorescence intensity for instrument calibration and quantitative comparison across studies. |
| IVIS Spectrum CT Imaging System | Integrated platform for in vivo 2D fluorescence, 3D tomography, and CT, supporting wavelengths from visible to NIR-II. |
| InGaAs Camera (e.g., NIRvana) | High-sensitivity, liquid nitrogen-cooled camera essential for detecting weak NIR-II (1000-1700 nm) signals. |
| Dichroic Mirrors & Filters (e.g., 1100 nm LP) | Critical optical components for separating excitation light from the desired NIR-II emission signal in custom setups. |
From Probe to Image: A Practical Guide to NIR Imaging Protocols
Within the framework of Near-Infrared (NIR) fluorescence imaging principles, the selection of an appropriate molecular probe is paramount for achieving high-fidelity biological visualization. The efficacy of a probe is fundamentally governed by two interrelated criteria: its targeting mechanism (active vs. passive) and its resultant signal-to-background ratio (SBR). This guide provides an in-depth technical analysis of these core selection parameters, essential for researchers and drug development professionals designing preclinical and translational imaging studies.
Targeting Mechanisms: Active vs. Passive
The route of probe accumulation at the target site is a primary differentiator.
Passive Targeting
Passive targeting relies on the Enhanced Permeability and Retention (EPR) effect, a pathophysiological characteristic of many solid tumors and inflamed tissues. Leaky, disorganized vasculature facilitates extravasation of probes, while impaired lymphatic drainage causes their subsequent retention.
Key Characteristics:
- Mechanism: Diffusion-based accumulation.
- Target Specificity: Low to moderate; accumulates in any tissue with enhanced vascular permeability.
- Kinetics: Slower, dependent on circulation time and vascular permeability.
- Typical Probes: Non-targeted fluorophores (e.g., ICG), fluorescently labeled nanoparticles, macromolecules.
Active Targeting
Active targeting involves the conjugation of a signaling moiety (fluorophore) to a ligand (e.g., antibody, peptide, small molecule) that selectively binds to a molecular marker (e.g., receptor, enzyme, antigen) overexpressed on target cells.
Key Characteristics:
- Mechanism: Receptor-ligand or antigen-antibody binding.
- Target Specificity: High, dictated by ligand affinity and biomarker expression.
- Kinetics: Binding phase follows initial distribution; can be faster at the target site.
- Typical Probes: Antibody-fluorophore conjugates, peptide-based probes, aptamer-linked dyes.
Comparative Analysis
Table 1: Quantitative Comparison of Passive vs. Active Targeting
| Parameter | Passive Targeting | Active Targeting |
|---|---|---|
| Targeting Efficiency (%ID/g) * | 2-5% ID/g (tumor) | 5-15% ID/g (tumor) |
| Optimal Imaging Time | 24 - 48 hours post-injection | 6 - 24 hours post-injection |
| Signal-to-Background Ratio | Moderate (2-5) | High (5-20+) |
| Background Clearance | Slower, hepatic/renal | Variable, often faster for unbound probe |
| Development Complexity | Low | High (ligand validation, conjugation chemistry) |
| Cost | Relatively Low | High |
| Influence of EPR | Critical | Supplementary; binding is primary |
%ID/g: Percentage of Injected Dose per gram of tissue. Values are typical ranges from murine models.
Signal-to-Background Ratio (SBR): The Critical Metric
SBR is the definitive quantitative measure of imaging contrast, calculated as SBR = (Signal_Target - Signal_Background) / Signal_Background. A high SBR is essential for distinguishing true signal from noise.
Factors Influencing SBR
- Probe Pharmacokinetics: The balance between target accumulation and systemic clearance.
- Target-to-Off-Target Binding: Specificity of the probe for its intended biomarker.
- Optical Properties: Probe extinction coefficient, quantum yield, and the tissue penetration/autofluorescence profile of its emission wavelength (NIR-I: 700-900 nm; NIR-II: 1000-1700 nm).
- Background Sources: Tissue autofluorescence (higher at lower wavelengths), non-specific probe retention, and instrument noise.
Experimental Protocol: Measuring SBRIn Vivo
Objective: To quantify the SBR of a candidate NIR fluorescent probe in a subcutaneous tumor model.
Materials: See "The Scientist's Toolkit" below. Procedure:
- Animal Model Preparation: Implant tumor cells subcutaneously in mice (n=5 per group). Allow tumors to grow to ~100-200 mm³.
- Probe Administration: Inject probe intravenously via tail vein at an optimized dose (e.g., 2 nmol in 100 µL PBS).
- Longitudinal Imaging: Anesthetize mice and image at multiple time points (e.g., 1, 4, 24, 48 h) using a calibrated NIR fluorescence imaging system. Maintain consistent imaging parameters (exposure time, f-stop, field of view).
- Image Analysis:
a. Using ROI tools, draw regions of interest (ROIs) over the tumor (T) and an adjacent normal tissue area of the same size (B).
b. Record the total radiant efficiency or average fluorescence intensity for each ROI.
c. Calculate SBR at each time point:
SBR = (Mean Intensity_T - Mean Intensity_B) / Mean Intensity_B. - Ex Vivo Validation: At the terminal time point, euthanize mice, harvest tumors and major organs. Image ex vivo to calculate %ID/g and confirm in vivo SBR readings.
Table 2: Example SBR Time-Course Data for a Hypothetical Probe
| Time Post-Injection (h) | Active Targeting Probe | Passive Targeting Probe | ||||
|---|---|---|---|---|---|---|
| Tumor Signal | Background | SBR | Tumor Signal | Background | SBR | |
| 1 | 8.5 x 10⁸ | 5.0 x 10⁸ | 0.7 | 4.0 x 10⁸ | 3.5 x 10⁸ | 0.14 |
| 6 | 1.5 x 10⁹ | 2.0 x 10⁸ | 6.5 | 6.5 x 10⁸ | 2.8 x 10⁸ | 1.32 |
| 24 | 9.0 x 10⁸ | 5.0 x 10⁷ | 17.0 | 8.0 x 10⁸ | 1.5 x 10⁸ | 4.33 |
| 48 | 3.0 x 10⁸ | 1.0 x 10⁷ | 29.0 | 4.0 x 10⁸ | 1.8 x 10⁸ | 1.22 |
Signal in Total Radiant Efficiency ([p/s/cm²/sr] / [µW/cm²]). Background measured from muscle.
Visualizing Key Concepts
Title: Probe Targeting Pathways: Passive (EPR) vs. Active Binding
Title: Key Factors for Optimizing Signal-to-Background Ratio
The Scientist's Toolkit
Table 3: Essential Research Reagent Solutions for NIR Probe Evaluation
| Item | Function & Rationale |
|---|---|
| NIR Fluorophores (e.g., ICG, Cy7, IRDye 800CW, Alexa Fluor 790) | Core signaling moiety. NIR emission minimizes tissue autofluorescence and enhances penetration depth. |
| Targeting Ligands (e.g., monoclonal antibodies, engineered antibody fragments (scFv), peptides, affibodies) | Provides molecular specificity for active targeting. Choice dictates affinity, size, and immunogenicity. |
| Conjugation Kits (e.g., NHS-ester, maleimide, click chemistry kits) | For covalent, stable linkage of fluorophores to targeting ligands. Critical for reproducible probe synthesis. |
| Isotype Control Antibody Conjugates | Matched, non-targeting control probe to differentiate specific vs. non-specific uptake in experiments. |
| Fluorescence-Compatible Matrigel | For stabilizing tumor cell implants in vivo and enhancing engraftment rates in subcutaneous models. |
| In Vivo Imaging System (IVIS) or similar | Calibrated camera system for quantitative longitudinal fluorescence imaging in live animals. |
| Image Analysis Software (e.g., Living Image, FIJI/ImageJ with ROI tools) | Essential for drawing ROIs and quantifying fluorescence intensity (total flux or mean radiant efficiency). |
| Tissue Phantoms & Calibration Standards | Fluorescent references for validating system linearity, sensitivity, and inter-study reproducibility. |
| Near-Infrared Tissue Autofluorescence Reference Slides | To characterize and account for background signal in the specific NIR channel used. |
Preclinical in vivo imaging is a cornerstone of modern biomedical research, enabling the non-invasive visualization of biological processes, disease progression, and therapeutic efficacy in living animal models. Within the broader thesis on Near-Infrared (NIR, 650-900 nm) fluorescence imaging principles, this guide details the practical implementation. NIR imaging offers superior tissue penetration and minimal autofluorescence compared to visible light, making it ideal for deep-tissue studies in oncology, inflammation, and regenerative medicine. This technical whitepaper provides a comprehensive guide for establishing a robust preclinical imaging pipeline.
Core System Setup and Calibration
A standard NIR fluorescence imaging system consists of:
- Excitation Source: Laser or LED arrays emitting at specific wavelengths (e.g., 660 nm, 750 nm).
- Emission Filters: Bandpass filters to isolate the fluorescence signal from excitation light.
- High-Sensitivity Camera: Typically a cooled CCD or sCMOS camera.
- Light-Tight Chamber.
- Animal Platform with Gas Anesthesia System.
- Software for Acquisition and Analysis.
Calibration Protocol:
- Flat-Field Correction: Acquire an image of a uniform fluorescent phantom or a blank scan to correct for spatial variations in illumination and camera sensitivity.
- Spectral Unmixing Setup: If using multiple fluorophores, acquire reference emission spectra from control animals injected with single agents to create a spectral library.
- Sensitivity Calibration: Use a series of fluorescent dyes at known concentrations in tissue-mimicking phantoms to establish a limit of detection (LOD) and a linear quantification range.
Animal Preparation: Detailed Methodologies
Proper animal preparation is critical for reproducible and ethical data.
Animal Model Selection and Husbandry
- Choose immunocompetent or immunodeficient strains (e.g., nude, NSG mice) based on the required xenograft or genetic model.
- Standardize age, weight, and sex across experimental groups.
- House animals under specific pathogen-free (SPF) conditions with ad libitum access to food and water, except during fasting for certain studies.
Pre-Imaging Preparation Protocol
- Fur Removal: Depilate the region of interest 24 hours prior to imaging to minimize light scattering and absorption. Use electric clippers followed by a chemical depilatory cream, which is thoroughly washed off.
- Diet Control: Switch to a low-fluorescence, alfalfa-free diet at least one week before imaging to reduce chlorophyll autofluorescence in the gastrointestinal tract.
- Fasting: For abdominal or whole-body imaging, fast animals (with free access to water) for 4-6 hours to clear the gut of fluorescent food content.
Anesthesia and Monitoring During Imaging
- Induction: Place animal in an induction chamber with 3-4% isoflurane in medical-grade oxygen (1 L/min flow).
- Maintenance: Transfer animal to the imaging stage with a nose cone delivering 1.5-2% isoflurane.
- Physiological Monitoring: Maintain body temperature at 37°C using a heating pad. Monitor respiratory rate (target: 40-80 breaths/min for mice). Apply ophthalmic ointment to prevent corneal drying.
Probe Administration and Dosage Guidelines
Quantitative data from recent literature and vendor guidelines for common NIR fluorophores are summarized below.
Table 1: Dosage Guidelines for Common NIR Fluorophores and Targeted Agents
| Fluorophore / Agent | Excitation/Emission (nm) | Typical Route | Dose Range (nmol per mouse) | Recommended Injection Volume (for mouse) | Key Consideration / Application |
|---|---|---|---|---|---|
| IRDye 680RD | 680/700 | IV, IP | 0.5 - 2.0 | 100-200 µL (in PBS) | Low non-specific binding; general vascular imaging. |
| IRDye 800CW | 778/794 | IV, IP | 0.5 - 2.0 | 100-200 µL (in PBS) | Gold standard; deep tissue penetration. |
| Cy5.5 | 675/694 | IV, IP, SC | 0.5 - 3.0 | 100-200 µL (in PBS) | Conjugated to antibodies, peptides. |
| Alexa Fluor 750 | 749/775 | IV | 1.0 - 4.0 | 100-200 µL (in PBS) | Bright, photostable alternative to 800CW. |
| Indocyanine Green (ICG) | 780/820 | IV | 2.0 - 5.0 (≈0.5 mg/kg) | 100-200 µL (in water) | FDA-approved; rapid hepatic clearance (<10 min). |
| Targeted Antibody-NIR Conjugate | Varies | IV | 1-50 µg (antibody mass) | 100-200 µL | Dose depends on antibody; allow 24-72h for target clearance. |
| Integrin-Targeted (RGD) Peptide-Dye | e.g., 750/775 | IV | 1 - 5 | 100-200 µL | Rapid targeting (1-4h post-injection). |
Injection Protocol:
- Reconstitution: Dissolve lyophilized probe in recommended solvent (e.g., DMSO, PBS). Aliquot and store at -20°C or -80°C, protected from light.
- Preparation: Dilute the stock to the working concentration in sterile, particle-free PBS or saline. Filter through a 0.2 µm filter.
- Administration: For intravenous (IV) injection, use tail-vein or retro-orbital routes. Warm the mouse to dilate the tail veins. Use a 30-gauge insulin syringe. Inject steadily over 10-20 seconds.
- Timing: Image at appropriate time points post-injection (e.g., immediately for angiography, 24h for targeted antibody clearance).
Experimental Imaging Workflow Protocol
This protocol outlines a standard acute imaging session for tumor targeting.
- Animal Setup: Anesthetize and position the animal supine or prone on the heated stage. Ensure the region of interest is centered and in focus.
- Baseline Imaging: Acquire a white light image and a background fluorescence image (using the appropriate filter set without probe present).
- Probe Injection: Administer the NIR probe via the predetermined route. Note the exact time.
- Time-Series Acquisition: Acquire a series of images at pre-defined time points (e.g., 5 min, 1h, 4h, 24h, 48h). Maintain identical exposure times, f-stops, and binning settings across all sessions for an animal.
- Spectral Unmixing (if needed): Acquire images through a series of emission filters for multiplexed studies.
- Euthanasia & Ex Vivo Validation: At the terminal time point, euthanize the animal, harvest tissues of interest, and image them ex vivo to correlate signal with biodistribution.
Data Analysis and Quantification
- Region of Interest (ROI) Analysis: Draw ROIs around the target (e.g., tumor) and a contralateral background region.
- Quantification: Calculate the average radiant efficiency within each ROI:
[pixel intensity (counts) / exposure time (ms) / illumination intensity (mW/cm²)]. Report asTarget-to-Background Ratio (TBR) = Mean Signal(Target) / Mean Signal(Background). - Standard Curves: Use phantom data to convert radiant efficiency to approximate picomole amounts of probe, acknowledging the limitations of in vivo quantification.
NIR In Vivo Imaging Experimental Workflow
Targeted Probe Binding & Signal Generation Pathway
The Scientist's Toolkit: Key Research Reagent Solutions
Table 2: Essential Materials for Preclinical NIR Imaging Studies
| Item | Function & Rationale |
|---|---|
| NIR Fluorophores (IRDye800CW, Cy5.5) | The core imaging agent. Conjugated to targeting molecules (antibodies, peptides) or used alone for vascular/lymphatic imaging. |
| Low-Fluorescence Diet (e.g., Teklad 2919) | Critical for reducing background autofluorescence from standard rodent chow, which contains chlorophyll. |
| Chemical Depilatory Cream | Provides more complete and uniform hair removal than shaving alone, crucial for reproducible light delivery and collection. |
| Isoflurane & Anesthesia System | Provides safe, stable, and reversible anesthesia for prolonged imaging sessions with minimal physiological impact. |
| Sterile PBS (Phosphate-Buffered Saline) | Universal vehicle for reconstituting and diluting imaging probes. Must be particle-free for IV injection. |
| 0.2 µm Syringe Filter | Removes aggregates from probe solutions before injection, preventing embolism and ensuring consistent bioavailability. |
| Fluorescent Reference Phantom | Essential for daily system calibration, ensuring quantitative comparability across imaging sessions and days. |
| Matrigel or Cell Culture Media | For formulating tumor cell inoculums for subcutaneous or orthotopic tumor model establishment. |
| Animal Monitoring System (Heating Pad, Resp. Monitor) | Maintains normothermia and monitors anesthesia depth, ensuring animal welfare and stable physiology for data quality. |
Within the broader thesis on Near-Infrared (NIR) fluorescence imaging principles and foundational research, this whitepaper explores the translation of these principles into clinical and intraoperative imaging systems. The evolution from benchtop NIR fluorescence spectroscopy to real-time, image-guided surgical systems represents a paradigm shift in surgical oncology and interventional procedures. This guide details the core technologies, experimental validation, and integrated workflows that constitute the next generation of surgical tools, with a focus on quantitative performance and protocol-driven implementation for research and development professionals.
Core Imaging Modalities & Quantitative Performance
The efficacy of intraoperative imaging systems is defined by quantifiable parameters. The following table summarizes the key performance metrics for current leading modalities, synthesized from recent product specifications and peer-reviewed evaluations.
Table 1: Quantitative Performance of Intraoperative Imaging Modalities
| Imaging Modality | Typical Resolution (Spatial) | Penetration Depth (in Tissue) | Temporal Resolution (Frame Rate) | Reported Sensitivity (Agent Concentration) | Primary Clinical Targets |
|---|---|---|---|---|---|
| NIR-I Fluorescence (700-900 nm) | 50-200 µm | 3-8 mm | Real-time (10-30 fps) | Low nM range | Vascular/lymphatic mapping, tumor margins (e.g., ICG, 5-ALA) |
| NIR-II Fluorescence (1000-1700 nm) | 10-50 µm | 5-15 mm | Real-time (5-20 fps) | Sub-nM to pM range | Deep-tissue vasculature, nerve imaging |
| Raman Spectroscopy | 1-10 µm (point) | 0.5-2 mm | Seconds per spectrum | µM to mM range | Molecular fingerprinting, specific biomolecules |
| Hyperspectral Imaging (Visible-NIR) | 100-500 µm | Surface to 1 mm | Seconds to minutes per cube | Varies by analyte | Tissue oxygenation, water/fat content |
| Ultrasound (Micro-Ultrasound) | 50-100 µm | 20-30 mm | Real-time (20-60 fps) | N/A (structural) | Microvascular flow, anatomical structure |
| Photoacoustic Imaging | 50-150 µm | 20-50 mm | Single shot to Hz rates | µM range (absorbance) | Hemoglobin, melanin, targeted contrast agents |
Detailed Experimental Protocol: Validating a Novel NIR Fluorophore for Tumor Margin Delineation
This protocol outlines a standard pre-clinical validation workflow for a targeted NIR fluorophore, essential for translation into an intraoperative imaging system.
A. Objective: To evaluate the specificity, sensitivity, and signal-to-background ratio (SBR) of a novel integrin αvβ3-targeted NIR fluorophore (e.g., IRDye 800CW-RGD) for delineating tumor margins in a murine xenograft model.
B. Materials & Reagents:
- Animal Model: Athymic nude mice (n=8-10 per group).
- Cell Line: U87MG human glioblastoma cells (high αvβ3 expression).
- Test Agent: Integrin αvβ3-targeted NIR fluorophore (e.g., IRDye 800CW-RGD conjugate).
- Control Agent: Isotype-matched, non-targeted NIR fluorophore (IRDye 800CW).
- Imaging System: Commercial open-field NIR fluorescence imaging system (e.g., LI-COR Pearl, PerkinElmer IVIS Spectrum, or custom-built system with 785 nm excitation, 820 nm long-pass emission filter).
- Software: ImageJ with appropriate plugins or manufacturer’s quantification software.
C. Methodology:
- Tumor Implantation: Subcutaneously inject 5x10^6 U87MG cells in 100 µL Matrigel into the right flank of mice.
- Agent Administration: Allow tumors to grow to ~150-200 mm³. Via tail vein, inject 2 nmol of the targeted or control agent in 100 µL of PBS.
- Longitudinal In Vivo Imaging:
- Anesthetize mice (2% isoflurane).
- Acquire pre-injection baseline NIR fluorescence images.
- Image at serial time points post-injection (e.g., 1, 4, 24, 48, 72h) using identical imaging parameters (exposure time, f-stop, binning).
- Shave the imaging area and apply depilatory cream prior to each session to reduce autofluorescence.
- Ex Vivo Biodistribution:
- At terminal time point (e.g., 72h), euthanize mice and resect tumors and major organs (heart, lungs, liver, spleen, kidneys, muscle).
- Weigh all tissues and image them ex vivo under the same system settings.
- Calculate percentage injected dose per gram of tissue (%ID/g) using a standard curve of known agent concentrations.
- Histological Correlation:
- Snap-freeze tumor tissue. Section (10 µm) using a cryostat.
- Perform H&E staining and immunofluorescence (IF) for integrin αvβ3 on adjacent sections.
- Acquire fluorescence microscopy images of the NIR signal (if using a tissue-compatible fluorophore) and IF signal for co-localization analysis (e.g., using Pearson's correlation coefficient).
D. Data Analysis:
- SBR: Calculate as (Mean Tumor Fluorescence Intensity) / (Mean Background Muscle Fluorescence Intensity).
- Specificity: Compare tumor uptake (%ID/g) of targeted vs. control agent using Student's t-test (p<0.05 significant).
- Margin Delineation: Use image analysis software to define tumor boundaries based on a threshold (e.g., 2x standard deviation above background). Compare this to the true histological margin from H&E.
Diagram: NIR Fluorophore Validation Workflow
Title: Pre-clinical NIR Agent Validation Workflow
The Scientist's Toolkit: Key Research Reagent Solutions
Table 2: Essential Reagents & Materials for NIR Intraoperative Imaging Research
| Item | Function/Description | Example Product/Category |
|---|---|---|
| NIR-I Fluorescent Dyes | Small molecule dyes for conjugation to targeting ligands; emit between 700-900 nm. | IRDye 800CW, Cy7, Alexa Fluor 750 |
| NIR-II Fluorophores | Inorganic or organic probes emitting >1000 nm for deeper tissue penetration and reduced scattering. | Quantum dots (Ag2S), single-wall carbon nanotubes, organic dyes (CH-4T) |
| Targeting Vectors | Biomolecules that confer specificity to fluorescent probes for molecular imaging. | Antibodies (trastuzumab), peptides (cRGD, octreotate), affibodies |
| Quenchers & Activatable Probes | Probes whose fluorescence is quenched until activated by a specific enzyme (e.g., protease). | ProSense (PerkinElmer), MMPSense |
| Fluorescence Imaging Phantoms | Calibration tools with known optical properties to validate and standardize imaging system performance. | Solid phantoms with embedded fluorophores, tissue-mimicking materials (Intralipid, India ink) |
| Image Analysis Software | For quantification of fluorescence intensity, SBR, and pharmacokinetic modeling. | LI-COR Image Studio, PerkinElmer Living Image, open-source (3D Slicer, ImageJ) |
| Multi-Modal Fusion Software | Enables co-registration of fluorescence images with preoperative CT/MRI or intraoperative ultrasound. | Custom MATLAB/Python pipelines, commercial surgical navigation suites (Brainlab, Medtronic Stealth) |
Integrated Intraoperative Signaling & Decision Pathway
The utility of an imaging system is realized through its integration into a closed-loop surgical decision pathway. The following diagram illustrates this logical flow, centered on NIR fluorescence feedback.
Diagram: Intraoperative NIR-Guided Surgical Decision Pathway
Title: NIR-Guided Surgical Decision Logic
Future Directions & Technical Challenges
The trajectory of clinical intraoperative imaging points toward multi-spectral systems combining NIR fluorescence with complementary modalities like ultrasound and photoacoustics. Key challenges include standardization of quantification across platforms, regulatory pathways for novel contrast agents, and the development of robust machine learning algorithms for real-time interpretation of hyper-dimensional imaging data. Research must continue to bridge the gap between the exquisite sensitivity of NIR probes demonstrated in controlled experiments and the variable, demanding environment of the human operating room.
Within the broader thesis on Near-Infrared (NIR) fluorescence imaging principles, the optimization of image acquisition parameters is a fundamental determinant of data quality and biological interpretation. This technical guide provides an in-depth analysis of three core parameters—exposure time, spectral filters, and pixel binning—framed for NIR fluorescence applications in biomedical research and drug development. Proper calibration of these parameters directly influences signal-to-noise ratio (SNR), spatial resolution, temporal resolution, and quantitation fidelity, which are critical for longitudinal studies, multiplexed imaging, and pharmacokinetic/pharmacodynamic analyses.
NIR fluorescence imaging (typically 650-900 nm) leverages the reduced autofluorescence and deeper tissue penetration of light within the "optical window" of biological tissues. The acquisition workflow must be meticulously designed to maximize the detection of the often weak target signal against a low-background environment. This document details the theoretical and practical considerations for setting exposure time, selecting emission/excitation filters, and employing binning to achieve specific experimental endpoints.
Core Parameter 1: Exposure Time
Exposure time, or integration time, dictates the duration for which the camera sensor collects photons from the sample.
Theoretical Foundation
The relationship between exposure time (t_exp), signal intensity (I_signal), and noise components is defined by:
Total SNR = (I_signal * t_exp) / sqrt( (I_signal + I_background) * t_exp + σ_dark^2 + σ_read^2 )
where I_background is background flux, σ_dark is dark current noise, and σ_read is read noise.
Table 1: Impact of Exposure Time on Image Characteristics
| Exposure Time | Signal Level | Noise Dominance | Risk/Artifact | Optimal Use Case |
|---|---|---|---|---|
| Too Short (<10 ms) | Low, sub-saturation | Read Noise Dominant | Poor SNR, false negatives | High-speed kinetics, bright samples. |
| Optimal (e.g., 50-1000 ms) | Linear, near full-well capacity | Shot Noise Limited | Minimal | Quantitative intensity measurements. |
| Too Long (>2 s) | Saturated | Dark Current Dominant | Blooming, pixel saturation, non-linear response | Very low-light static imaging. |
Experimental Protocol: Determining Optimal Exposure Time
- Objective: To establish a linear, non-saturated response for a given fluorophore concentration and illumination power.
- Materials: NIR fluorescent dye (e.g., IRDye 800CW), calibration phantom, NIR-capable imaging system with tunable exposure.
- Procedure:
- Prepare a dilution series of the fluorophore in a transparent plate or capillary tubes.
- Set excitation power to a standard, moderate level (e.g., 50% of laser or LED max).
- Acquire images of each sample with exposure times from 1 ms to 5 s in logarithmic steps.
- For each exposure time, plot mean pixel intensity (within a consistent ROI) vs. known concentration.
- Identify the maximum exposure time before the intensity-concentration relationship deviates from linearity (saturation point).
- For dynamic imaging, choose the longest exposure time within this linear range that still permits the required frame rate (
t_exp ≤ 1 / frame rate).
Diagram Title: Workflow for Optimal Exposure Time Determination
Core Parameter 2: Spectral Filters
Filter selection isolates the specific emission signal from background autofluorescence and scattered excitation light, which is paramount in NIR imaging.
Filter Characteristics
- Excitation Filter: Bandpass filter centered on the fluorophore's peak excitation wavelength.
- Emission Filter: Bandpass or longpass filter capturing the Stokes-shifted emission, blocking excitation light.
- Dichroic Mirror: Reflects excitation light toward the sample and transmits emission light to the camera.
Table 2: Key Filter Parameters & NIR-Specific Considerations
| Parameter | Definition | Impact on NIR Image | Typical NIR Values |
|---|---|---|---|
| Center Wavelength (CWL) | Midpoint of the transmission band. | Must match fluorophore peak (e.g., 780 nm for excitation of IRDye 800CW). | Excitation: 670-780 nm; Emission: 700-850 nm. |
| Bandwidth (FWHM) | Width of the transmission band at 50% max transmission. | Narrower BW increases specificity but reduces total signal; a 20 nm BW is common for multiplexing. | 10-25 nm for multiplex, up to 40 nm for single dye. |
| Optical Density (OD) | Log measure of light blocking outside the passband. | Critical for blocking intense NIR excitation light (e.g., 785 nm laser). OD >6 at excitation wavelength is standard. | OD >6 at laser line. |
| Transmission (%) | Peak percentage of light transmitted within the band. | Higher transmission directly improves SNR. High-quality NIR filters achieve >90%. | >90% peak transmission. |
Experimental Protocol: Validating Filter Set for Multiplex Imaging
- Objective: To confirm minimal cross-talk between two NIR fluorophores (e.g., IRDye 680LT and IRDye 800CW).
- Materials: Two spectrally distinct NIR fluorophores, separate tubes or wells, imaging system with filter wheels or multiple channels.
- Procedure:
- Prepare pure samples of each fluorophore at similar concentrations.
- Using the "Channel 1" filter set (optimized for Fluorophore A), image both samples.
- Measure the signal from Fluorophore B in Channel 1. This is the bleed-through signal.
- Repeat steps 2-3 for the "Channel 2" filter set (optimized for Fluorophore B).
- Calculate cross-talk percentage:
(Signal of Fluorophore B in Channel A / Signal of Fluorophore B in Channel B) * 100. - Aim for cross-talk <5%. If higher, consider narrowing filter bandwidths or choosing fluorophores with greater spectral separation.
Diagram Title: Light Path in a NIR Fluorescence Filter Cube
Core Parameter 3: Pixel Binning
Binning combines the charge from adjacent pixels on the camera sensor (e.g., 2x2) into a single "super-pixel."
Table 3: Trade-offs of Pixel Binning in NIR Imaging
| Binning Mode | Spatial Resolution | Signal per Super-Pixel | Read Noise | Frame Rate | Recommended Application |
|---|---|---|---|---|---|
| 1x1 (None) | Maximum (Native) | Low | Highest per pixel | Lowest | High-resolution ex vivo or histology imaging. |
| 2x2 | Reduced by 2x | Increases ~4x | Reduced by ~4x | Increases ~4x | Most common for in vivo NIR. Optimal balance of SNR and resolvable detail. |
| 4x4 | Reduced by 4x | Increases ~16x | Reduced by ~16x | Increases ~16x | Very low-light scenarios or extreme high-speed tracking. |
Experimental Protocol: Selecting Binning for Live Animal Imaging
- Objective: To choose a binning mode that provides sufficient SNR to detect a low-abundance target without sacrificing necessary spatial detail.
- Materials: Animal model with NIR fluorescent probe, in vivo imaging system.
- Procedure:
- Position the animal under the imaging system with standard anesthesia and positioning.
- Focus the camera on the region of interest.
- Acquire a sequence of images at the same exposure time and gain, but with different binning settings (1x1, 2x2, 4x4).
- Calculate the SNR for a target region in each image:
SNR = (Mean_Signal - Mean_Background) / StdDev_Background. - Assess the apparent resolution by evaluating the clarity of small anatomical features.
- Select the binning mode where SNR is >10 (or another predefined threshold) and critical features remain distinguishable. Typically, 2x2 binning is the starting point for in vivo NIR studies.
The Scientist's Toolkit: Essential Research Reagents & Materials
Table 4: Key Research Reagent Solutions for NIR Fluorescence Imaging Workflows
| Item | Function & Relevance to Parameter Optimization |
|---|---|
| NIR Fluorescent Dyes (e.g., IRDye series, Cy7) | Target-specific labels. Their excitation/emission peaks dictate optimal filter selection. Photostability influences maximum allowable exposure time. |
| NIR Fluorescent Calibration Phantoms | Solid or liquid standards with known fluorophore concentration. Critical for exposure time linearity tests and daily system performance validation. |
| Spectral Unmixing Software | Computationally separates signals from overlapping fluorophores. Allows use of wider filter bandwidths (increasing signal) while still enabling multiplexing. |
| Neutral Density (ND) Filter Set | Attenuates excitation light without altering its spectrum. Used to prevent saturation at minimum exposure time, enabling optimal dynamic range. |
| Low-Autofluorescence Immobilization Platform | Minimizes background signal from bedding or plates, improving SNR and allowing for reduced exposure time or binning. |
| sCMOS Camera with High QE >80% in NIR | Sensor quantum efficiency (QE) directly converts photons to electrons. High NIR QE is the foundation for achieving good SNR with any combination of exposure, filters, and binning. |
| Tunable NIR Laser/LED Source | Provides precise, stable excitation power. Enables exposure time optimization without changing light intensity, separating two key variables. |
This technical guide, situated within a broader thesis on Near-Infrared (NIR) fluorescence imaging principles, details the translation of core research into clinical and preclinical applications. NIR imaging (typically 700-900 nm) leverages the "tissue window" where scattering and absorbance by endogenous chromophores like hemoglobin and water are minimized, enabling deeper tissue penetration and higher signal-to-background ratios. The applications discussed herein are predicated on the targeted delivery of exogenous NIR fluorophores.
Cancer Surgery Guidance
The primary goal is to achieve real-time, intraoperative visualization of tumor margins and critical structures to improve the completeness of resection (R0 rate) while sparing healthy tissue.
Table 1: Clinical Performance of Selected NIR Agents in Cancer Surgery
| Fluorophore (Target) | Cancer Type | Dose / Route | Time to Imaging | Tumor-to-Background Ratio (TBR) | Key Outcome |
|---|---|---|---|---|---|
| Indocyanine Green (Non-specific) | Hepatocellular Carcinoma | 0.5 mg/kg, IV | Immediate | 1.5 - 3.0 | Improved detection of superficial lesions. |
| 5-ALA (PpIX; Metabolic) | Glioblastoma | 20 mg/kg, Oral | 4-6 hours | 2.0 - 5.0 | Increased rate of complete resection. |
| OTL38 (Folate receptor-α) | Lung Adenocarcinoma | 0.025 mg/kg, IV | 3-4 hours | 3.1 (mean) | Identified additional nodules in 16% of patients. |
| Bevacizumab-IRDye800CW (VEGF-A) | Head & Neck SCC | 4.5 mg, IV | 2-5 days | 2.5 - 4.0 | Positive margin prediction with high sensitivity. |
Detailed Experimental Protocol: Tumor-Targeted Agent Administration & Imaging
Objective: To intraoperatively visualize folate receptor-α positive tumors using OTL38.
- Patient Selection & Consent: Enroll patients with suspected or confirmed lung adenocarcinoma. Obtain informed consent.
- Agent Preparation: Reconstitute lyophilized OTL38 (folate-fluorophore conjugate) in sterile saline per manufacturer protocol.
- Dosing & Administration: Administer a bolus intravenous injection of 0.025 mg/kg body weight, 3-4 hours prior to scheduled surgery.
- Intraoperative Imaging: a. Perform standard white-light surgery. b. Switch the imaging system (e.g., FDA-cleared PINPOINT or Quest) to NIR fluorescence mode (excitation: ~774 nm, emission: ~796 nm). c. Dim ambient lights. Position the camera approximately 20 cm above the surgical field. d. Acquire and overlay real-time NIR fluorescence video onto the white-light video. e. Use fluorescence intensity to guide resection margins. Any suspicious residual fluorescence post-resection prompts further excision.
- Ex Vivo Analysis: Image the resected specimen to confirm margins and correlate findings with postoperative histopathology (gold standard).
Lymphatic Mapping
This technique involves the direct interstitial injection of a NIR tracer to visualize the lymphatic architecture draining from a primary tumor site, enabling sentinel lymph node (SLN) biopsy.
Table 2: Efficacy of NIR Tracers for Sentinel Lymph Node Mapping
| Tracer | Injection Site | Cancer Type | Detection Rate | Number of SLNs Identified (mean) | Advantage Over Blue Dye |
|---|---|---|---|---|---|
| ICG alone | Peritumoral | Breast Cancer | 96-100% | 2.5 - 3.2 | Real-time guidance, deeper node detection. |
| ICG:HSA (complex) | Subdermal | Melanoma | 100% | 2.8 | Improved retention in lymphatics. |
| 99mTc-Nanocolloid + ICG | Peritumoral | Prostate Cancer | 98% | 4.1 (combined) | Provides pre-op planar scintigraphy. |
| MB-002 (Integrin-targeted) | Footpad (Preclin.) | N/A | N/A | N/A (Improved contrast) | Potential for tumor-positive SLN detection. |
Detailed Experimental Protocol: Dual-Modality (Radioactive + NIR) SLN Biopsy
Objective: To identify the sentinel lymph node(s) in breast cancer using a radiotracer and ICG.
- Preoperative Lymphoscintigraphy: On the day of surgery, inject 0.1-1.0 mCi of 99mTc-sulfur colloid in a volume of 0.1-0.5 mL intradermally/peritumorally. Perform dynamic and static imaging with a gamma camera to map drainage basins.
- Intraoperative Gamma Probe Detection: Use a sterile gamma probe to transcutaneously locate the "hot" SLN and mark the skin.
- NIR Fluorescence Imaging: In the operating room, inject 0.5-1.0 mL of ICG (500 μM) at the same site. Massage the area.
- Real-Time Guidance: Use an NIR imaging system to visualize the lymphatic channels leading from the injection site to the SLN(s). Follow the fluorescent channels through a small incision.
- Node Identification & Excision: The SLN is identified as both "hot" (gamma probe count >10% of ex vivo hottest node) and fluorescent. Excise all nodes meeting criteria.
- Ex Vivo Confirmation: Image and count the ex vivo specimen with both the gamma probe and NIR camera before sending for histopathology.
Cell Tracking
In preclinical research, NIR imaging enables the non-invasive, longitudinal monitoring of adoptively transferred or transplanted cells in vivo.
Table 3: Strategies for NIR Fluorescence Cell Tracking
| Labeling Strategy | Cell Type | Labeling Agent | Detection Limit (Cells in vivo) | Tracking Duration | Key Consideration |
|---|---|---|---|---|---|
| Membrane Intercalation | T-cells, NK cells | DiR, DiD | ~10^4 | 1-2 weeks | Label dilution with proliferation; potential cytotoxicity. |
| Receptor-mediated Uptake | Macrophages | CLIO-VT680 (Nanoparticle) | ~10^5 | Several weeks | High payload; can affect cell function. |
| Covalent Bonding | Mesenchymal Stem Cells | VivoTrack 680 | ~10^5 | 1-2 weeks | Robust labeling; requires transfection/transduction. |
| Genetic Encoding | Cancer cells | iRFP720 (Fluorescent Protein) | ~10^6 | Unlimited | No dilution; enables lineage tracing but is transgenic. |
Detailed Experimental Protocol: Direct Membrane Labeling for Adoptive T-cell Therapy Tracking
Objective: To monitor the biodistribution of infused cytotoxic T lymphocytes (CTLs) in a murine tumor model.
- Cell Culture & Activation: Isolate and expand antigen-specific CTLs in vitro using IL-2 and antigen-presenting cells.
- Labeling: a. Harvest CTLs, wash with serum-free media, and resuspend at 1-5 x 10^7 cells/mL in labeling medium. b. Add the lipophilic NIR dye DiR (or DiD) from a stock solution in DMSO to a final concentration of 1-10 μM. Vortex gently. c. Incubate for 20-30 minutes at 37°C in the dark. d. Wash cells three times with complete media containing 10% FBS to remove unincorporated dye. e. Perform viability assay (e.g., Trypan Blue) to confirm labeling did not induce excessive toxicity (>80% viability required).
- Animal Model & Imaging: Use mice bearing subcutaneous tumors expressing the target antigen. a. Inject 1-5 x 10^6 labeled CTLs intravenously via the tail vein. b. At defined time points (e.g., 1 hr, 24 hr, 72 hr, 1 wk), anesthetize the mouse. c. Acquire whole-body NIR fluorescence images (exposure time constant) using a preclinical imager (e.g., IVIS Spectrum). Use ROI analysis to quantify signal in tumor, liver, spleen, and lungs. d. Sacrifice mice at endpoints for ex vivo organ imaging and histology (fluorescence microscopy) to validate cell presence.
The Scientist's Toolkit: Research Reagent Solutions
Table 4: Essential Reagents and Materials for NIR Fluorescence Applications
| Item | Function / Description | Example Product/Chemical |
|---|---|---|
| NIR Fluorophores | Light-emitting probes that absorb and emit in the NIR range. | Indocyanine Green (ICG), IRDye 800CW, Cy7, Alexa Fluor 790. |
| Targeting Ligands | Molecules that confer specificity to the fluorophore. | Antibodies, peptides, folates, affibodies, nanobodies. |
| Clinical-Grade Imaging Agents | cGMP-produced, FDA-approved or investigational conjugates. | OTL38 (Folate-FITC), pafolacianine (OTL38), BLZ-100 (Tozuleristide). |
| Preclinical Labeling Kits | For ex vivo cell labeling with membrane dyes. | DIR, DiD, VivoTrack 680, CellVue Maroon. |
| NIR Fluorescence Imaging Systems | Instruments for intraoperative or preclinical imaging. | Intuitive Firefly, Stryker SPY-PHI, PerkinElmer IVIS, LI-COR Pearl. |
| Surgical Drapes & Gowns (Low-Fluorescence) | Minimize background autofluorescence in the OR. | Custom drapes without optical brighteners. |
| Phantom Materials | For system calibration and validation. | Intralipid suspensions, silicone-based phantoms with India ink. |
| Data Analysis Software | For image processing, TBR calculation, and kinetics. | ImageJ (with NIR plugins), LI-COR Image Studio, proprietary vendor software. |
Visualization Diagrams
Diagram 1: Intraoperative Cancer Surgery Guidance Workflow
Diagram 2: Lymphatic Mapping & Sentinel Node Concept
Diagram 3: Cell Tracking Strategy & Experimental Flow
Maximizing Signal and Minimizing Noise: Optimization Strategies for NIR Imaging
Within the framework of a broader thesis on Near-Infrared (NIR) fluorescence imaging principles, a critical examination of common artifacts is paramount. NIR imaging (typically 650-1700 nm) offers superior penetration and reduced background compared to visible light techniques. However, its efficacy in research and drug development is compromised by persistent technical challenges: autofluorescence, photobleaching, and scattering. This whitepaper provides an in-depth technical guide to these phenomena, detailing their origins, quantitative impact, and mitigation strategies to ensure data fidelity.
Autofluorescence in NIR Imaging
Autofluorescence is the inherent emission of light by biological structures or materials upon excitation. While reduced in the NIR window, it remains non-negligible, particularly in the first NIR window (NIR-I, 650-950 nm).
Primary endogenous sources include flavins (FAD, FMN, emission ~520-560 nm), collagen/elastin cross-links, lipofuscin, and NAD(P)H. Exogenous sources from plastics, optics, and immersion oils are also significant. The use of NIR dyes (e.g., ICG, Cy7) aims to shift excitation/emission beyond this endogenous background.
Table 1: Common Autofluorescence Sources and Characteristics
| Source | Typical Excitation Max (nm) | Typical Emission Max (nm) | Relative Intensity in NIR-I |
|---|---|---|---|
| NAD(P)H | ~340 | ~450-470 | Low |
| FAD | ~450 | ~520-560 | Low-Medium |
| Lipofuscin | Broad (~340-500) | Broad (~500-700) | Medium |
| Collagen | ~330-370 | ~400-470 | Low |
| Plastic (Polystyrene) | Broad (UV-Vis) | Broad (Vis) | High (if excited) |
Experimental Protocol: Characterizing Tissue Autofluorescence
Objective: Quantify tissue-specific autofluorescence background in intended NIR experimental channels.
- Sample Preparation: Prepare tissue sections (e.g., liver, kidney, skin) from unfixed, untreated animals. Use cryosections (5-10 µm thickness) mounted on low-fluorescence glass slides.
- Control Sample: A section treated with a quenching agent (e.g., 0.1% Sudan Black B in 70% ethanol for 30 min) can serve as a negative control.
- Imaging Setup: Use a calibrated fluorescence microscope or imaging system with NIR-capable detectors.
- Acquisition: Image control tissues at the planned excitation wavelength (e.g., 745 nm for Cy7) and across the intended emission filter range (e.g., 780-820 nm). Use identical exposure times, laser power, and gain settings planned for the main experiment.
- Analysis: Measure mean fluorescence intensity (MFI) in regions of interest (ROIs). The signal from unquenched samples minus the quenched control provides the autofluorescence magnitude. Express as a percentage of the expected specific signal from your NIR probe.
Photobleaching
Photobleaching is the irreversible destruction of a fluorophore's ability to emit light due to photon-induced chemical damage. It limits acquisition time, compromises quantitative analysis, and generates phototoxic byproducts.
Mechanisms and Kinetics
The primary mechanism involves the reaction of the long-lived excited triplet state with molecular oxygen, generating reactive oxygen species (ROS) that cleave the fluorophore's structure. The bleaching rate follows an exponential decay and is influenced by oxygen concentration, excitation power, and fluorophore chemistry.
Table 2: Photobleaching Half-Lives of Common NIR Fluorophores
| Fluorophore | Excitation (nm) | Approx. Half-life (Continuous Illumination)* | Typical Environment |
|---|---|---|---|
| ICG | 780 | < 1 second | Aqueous buffer, serum |
| Cy7 | 750 | 10-30 seconds | PBS, fixed cells |
| Alexa Fluor 750 | 749 | 1-2 minutes | Mounting medium |
| IRDye 800CW | 774 | 2-3 minutes | In vivo imaging |
*Values are highly dependent on power density and medium. Data sourced from recent product literature and publications.
Experimental Protocol: Quantifying Photobleaching Kinetics
Objective: Determine the photostability of an NIR fluorophore under standardized imaging conditions.
- Sample Preparation: Prepare a standardized solution or labeled specimen. For a solution, use a 1 µM dye solution in PBS. For cells, use a consistent labeling protocol.
- Imaging Setup: Use a confocal or widefield system with stable laser/LED output. Precisely measure the power density at the sample plane.
- Data Acquisition: Continuously illuminate a single field of view. Acquire images at regular, short intervals (e.g., every 100 ms for fast-bleaching dyes) for a total period covering significant signal decay.
- Data Analysis: For each time point, calculate the MFI within a consistent ROI. Fit the intensity decay curve (I(t)) to a single exponential model:
I(t) = I₀ * exp(-k*t), wherekis the bleaching rate constant. The half-life is calculated ast₁/₂ = ln(2)/k.
Scattering in Biological Tissue
Scattering is the redirection of photons by inhomogeneities in refractive index within tissue. It reduces signal-to-noise ratio, degrades spatial resolution, and limits imaging depth.
Scattering Coefficients and Wavelength Dependence
Scattering is described by the reduced scattering coefficient (µs'), which generally decreases with increasing wavelength in the NIR range, providing a primary advantage for NIR imaging. The relationship is often modeled as a power law: µs' ∝ λ^(-b), where b is the scattering power.
Table 3: Reduced Scattering Coefficients (µs') of Tissues in NIR Windows
| Tissue Type | µs' at 700 nm (cm⁻¹) | µs' at 800 nm (cm⁻¹) | µs' at 900 nm (cm⁻¹) | Scattering Power (b) |
|---|---|---|---|---|
| Human Skin (dermis) | ~20-25 | ~15-20 | ~12-17 | ~1.2-1.5 |
| Mouse Brain | ~10-15 | ~8-12 | ~6-10 | ~1.3-1.7 |
| Breast Tissue | ~8-12 | ~6-10 | ~5-8 | ~1.5-1.8 |
| Liver | ~15-20 | ~12-16 | ~10-14 | ~1.0-1.3 |
*Compiled from recent tissue optics studies. Values are approximate and subject to biological variation.
Experimental Protocol: Measuring Signal Attenuation with Depth
Objective: Characterize the attenuation of NIR fluorescence signal as a function of tissue depth.
- Phantom Preparation: Create a tissue-mimicking phantom with known scattering properties using lipid emulsions (e.g., Intralipid) in agarose. Embed a thin capillary tube filled with a known concentration of NIR dye at varying depths.
- Imaging Setup: Use a reflectance fluorescence imaging system or a fluorescence macroscope with a spectral filter set matched to the dye.
- Data Acquisition: Image the phantom surface. The fluorescence signal from the capillary will be detected with intensity inversely related to its depth due to scattering and absorption.
- Data Analysis: Plot fluorescence intensity versus capillary depth. Fit the data to an exponential attenuation model:
I(d) = I₀ * exp(-µ_eff * d), whereµ_effis the effective attenuation coefficient, which combines the effects of absorption and scattering.
The Scientist's Toolkit: Research Reagent Solutions
| Item | Function/Benefit |
|---|---|
| NIR Fluorescent Dyes (e.g., Cy7, Alexa Fluor 750, IRDye 800CW) | High quantum yield fluorophores with excitation/emission in the NIR window to minimize autofluorescence and increase penetration. |
| Anti-fading Mounting Media (e.g., with p-phenylenediamine, Trolox) | Reduces photobleaching during microscopy by scavenging free radicals and reducing oxygen. |
| Tissue Optical Clearing Agents (e.g., CUBIC, CLARITY, SeeDB) | Reduce scattering by matching refractive indices of tissue components, enabling deeper imaging. |
| Autofluorescence Quenchers (e.g., Sudan Black B, TrueBlack Lipofuscin) | Selectively absorb broad-spectrum emitted autofluorescence, improving specific signal contrast. |
| Oxygen Scavenging Systems (e.g., PCA/PCD, Gloxy) | Enzymatic or chemical systems that reduce local dissolved oxygen, slowing photobleaching kinetics. |
| NIR Calibration Standards (e.g., fluorescent beads, reference dyes) | Provide stable, known fluorescence values for system calibration and quantitative comparison across experiments. |
| Tissue-Mimicking Phantoms | Materials with calibrated optical properties (µs', µa) for validating imaging system performance and modeling. |
NIR Imaging Artifact Mitigation Workflow
Photobleaching Molecular Pathway
Instrument Calibration and Performance Validation for Quantitative Studies
Within the broader thesis on NIR fluorescence imaging principles and basics research, the reliability of quantitative data is paramount. For techniques like NIR fluorescence, which are increasingly used in drug development for in vivo biodistribution, pharmacokinetic, and efficacy studies, rigorous instrument calibration and validation are non-negotiable. This guide details the systematic procedures required to ensure that imaging systems produce accurate, precise, and reproducible quantitative measurements, thereby underpinning robust scientific conclusions.
Fundamental Calibration Concepts for NIR Imaging
Quantitative NIR fluorescence imaging relies on the linear relationship between the measured signal and the fluorophore concentration within the region of interest. Calibration establishes this relationship and corrects for systemic instrument variables.
Key Performance Parameters
The following parameters must be characterized and validated for any quantitative imaging system.
Table 1: Key Performance Parameters for Quantitative NIR Imaging
| Parameter | Definition | Impact on Quantitative Data |
|---|---|---|
| Linear Dynamic Range | The range of fluorophore concentrations over which the signal response is linear. | Defines the upper and lower limits for reliable quantification. |
| Limit of Detection (LoD) | The lowest concentration of fluorophore that can be consistently detected. | Determines sensitivity for low-abundance targets. |
| Uniformity of Illumination | The spatial homogeneity of the excitation light across the field of view. | Inhomogeneity causes spatial bias in measured fluorescence. |
| Spatial Resolution | The minimum distance at which two distinct fluorescent point sources can be resolved. | Affects accuracy in small or heterogeneous regions. |
| Day-to-Day Reproducibility | The consistency of measurements for a standard sample across multiple sessions. | Critical for longitudinal studies. |
Core Calibration Workflow
A standardized workflow is essential for establishing a reliable quantitative imaging pipeline.
Title: NIR Instrument Calibration and QC Workflow
Detailed Experimental Protocols
Protocol: Generating a Quantitative Standard Curve
This protocol establishes the fundamental relationship between fluorescence intensity and fluorophore concentration.
Objective: To create a calibration curve for a specific NIR fluorophore (e.g., IRDye 800CW) using a reference phantom.
Materials:
- NIR fluorescence imaging system (e.g., LI-COR Odyssey, PerkinElmer IVIS).
- Serial dilutions of the fluorophore in a matching solvent (e.g., PBS, 1% BSA).
- Certified concentration standard (e.g., from the fluorophore manufacturer).
- Low-fluorescence, flat-bottomed multi-well plate or solid phantom with wells.
Procedure:
- Prepare Dilution Series: Create a minimum of 8 serial dilutions covering the expected concentration range (e.g., from 0.1 nM to 10 µM). Include a blank (solvent only).
- Load Samples: Pipette equal volumes of each dilution into separate wells of the plate or phantom. Ensure no bubbles.
- Image Acquisition: Place the phantom in the imaging system. Use identical acquisition settings for all subsequent experiments (e.g., excitation/emission filters, laser power, focus, integration time). Critical: The integration time must be within the system's linear response range for the brightest sample.
- Data Analysis: Using the instrument's software, draw regions of interest (ROIs) around each well. Record the mean fluorescence intensity (MFI) minus the background (blank well MFI).
- Curve Fitting: Plot background-subtracted MFI vs. known concentration. Fit the data with a linear regression model (
y = mx + c). TheR²value should be >0.99 for reliable quantification.
Table 2: Example Calibration Data for IRDye 800CW
| Concentration (nM) | Mean Fluorescence Intensity (AU) | Background-Subtracted MFI (AU) |
|---|---|---|
| 0 (Blank) | 105 ± 8 | 0 |
| 100 | 1205 ± 45 | 1100 ± 46 |
| 500 | 5510 ± 120 | 5405 ± 121 |
| 1000 | 10980 ± 210 | 10875 ± 211 |
| 5000 | 54850 ± 980 | 54745 ± 981 |
| 10000 | 99800 ± 1500 | 99695 ± 1501 |
Protocol: Validating Spatial Performance
Objective: To assess spatial resolution and uniformity.
Materials: A resolution target phantom (e.g., a patterned film with NIR fluorescent features of known spacing) or a uniform fluorescent sheet.
Procedure for Uniformity:
- Image the uniform fluorescent sheet.
- Plot the intensity profile across a line through the center of the field of view.
- Calculate the coefficient of variation (CV) of intensity across the central 80% of the image. A CV < 15% is typically acceptable for quantitative ROI analysis.
Procedure for Resolution:
- Image the resolution target.
- Determine the smallest line-pair set where lines are visually distinct.
- The system resolution is calculated as the reciprocal of that line-pair spacing (in lp/mm).
Advanced Validation: Incorporating Biological Complexity
For preclinical drug development, validation must move beyond simple phantoms to biologically relevant contexts.
Tissue Mimicking Phantom Validation
Protocol: Embed known concentrations of fluorophore in intralipid-based or solid phantoms with calibrated optical properties (reduced scattering µs' and absorption µa coefficients) to simulate different tissue types (e.g., skin, muscle, liver).
Table 3: Tissue Phantom Validation Results
| Phantom Type (Simulated Tissue) | Expected µs' (cm⁻¹) | Expected µa (cm⁻¹) | Measured MFI Recovery (%) at 100 nM |
|---|---|---|---|
| Low Scattering (Serum) | 5 | 0.02 | 98 ± 3 |
| High Scattering (Skin) | 20 | 0.3 | 65 ± 7 |
| High Absorption (Liver) | 15 | 1.0 | 45 ± 10 |
The Scientist's Toolkit: Essential Research Reagents & Materials
Table 4: Key Reagents for NIR Calibration & Validation Experiments
| Item | Function & Importance |
|---|---|
| NIR Fluorophore Standards | Certified, pure compounds (e.g., IRDye 800CW, Cy7) of known concentration and quantum yield. Serve as the gold reference for all calibration curves. |
| Solid Fluorescent Phantoms | Stable, long-lasting substrates with uniform or patterned fluorescent layers. Essential for daily/weekly system qualification and uniformity checks. |
| Tissue-Mimicking Optical Phantoms | Phantoms with tunable scattering and absorption properties. Validate quantification accuracy in biologically relevant optical environments. |
| Low-Fluorescence Multi-Well Plates | Plates with minimal autofluorescence for preparing dilution series. Critical for generating accurate standard curves without background interference. |
| NIST-Traceable Radiometric Standards | Light sources or reflectance standards with certified optical power/radiance. Used for absolute responsivity calibration of the imaging detector. |
| Resolution Target Slides | Slides with precise fluorescent patterns (e.g., USAF 1951). Objectively measure and monitor the spatial resolution of the imaging system. |
Pathway to Quantitative Data Integrity
The relationship between calibration rigor and reliable research outcomes is direct and causal.
Title: Calibration Ensures Quantitative Data Integrity
For NIR fluorescence imaging to fulfill its potential as a quantitative tool in foundational research and drug development, a disciplined, protocol-driven approach to instrument calibration and validation is essential. By implementing the standard curves, performance tests, and biological validations described, researchers can transform their imaging systems from qualitative picture generators into reliable engines of quantitative data. This rigor, framed within the core principles of NIR imaging, is the bedrock upon which trustworthy scientific and translational conclusions are built.
Optimizing Imaging Parameters for Specific Targets and Tissue Depths
Within the broader thesis of NIR fluorescence imaging principles, the optimization of imaging parameters is a critical bridge between fundamental photon-tissue interaction theory and practical, high-fidelity biomedical application. The core principle hinges on the first near-infrared window (NIR-I, 700-900 nm) and second window (NIR-II, 1000-1700 nm), where reduced photon scattering, minimal tissue autofluorescence, and deeper penetration are achievable. This guide operationalizes these principles by detailing how key variables—wavelength, laser power, exposure time, and filter sets—must be dynamically tuned for specific molecular targets (e.g., proteases, cell surface receptors) and desired interrogation depths (e.g., superficial vs. deep-tissue imaging).
Core Imaging Parameters & Quantitative Optimization Framework
The efficacy of NIR fluorescence imaging is governed by an interdependent set of physical and instrumental parameters. Their optimal configuration is non-universal and must be derived for each specific biological question.
Parameter Definitions & Impact
- Excitation Wavelength (λ_ex): Must align with the peak absorption of the fluorophore while considering tissue absorption coefficients. Hemoglobin and water have lower absorption in the NIR windows, enabling deeper light penetration.
- Emission Filter Cut-on Wavelength (λ_em): Critical for blocking reflected excitation light and collecting the Stokes-shifted emission. Optimal placement maximizes signal-to-background ratio (SBR).
- Laser Power Density (P): Governs fluorophore excitation rate. Must balance sufficient signal generation against photobleaching and potential tissue phototoxicity.
- Exposure Time (T_exp): Integrates the detected signal. Longer times increase signal but can lead to saturation and motion artifacts in vivo.
- Spatial Binning: Pixel grouping on the sensor to increase sensitivity at the cost of spatial resolution, beneficial for low-signal deep-tissue imaging.
Table 1: Recommended Parameter Ranges for Common NIR Fluorophores and Depths
| Fluorophore Class | Target Example | Optimal λ_ex (nm) | Optimal λ_em cut-on (nm) | Recommended Laser Power (mW/cm²) in vivo | Max Useful Depth (mm) | Key Consideration |
|---|---|---|---|---|---|---|
| ICG Derivatives | Angiography, Liver Function | 780 - 800 | 820 | 10 - 50 | 5-10 (NIR-I) | FDA-approved; binds plasma proteins. |
| Cyanine Dyes (e.g., Cy7) | Antibody Conjugates | 750 - 790 | 780 | 5 - 20 | 3-7 | High molar absorptivity; moderate bleaching. |
| NIR-II Carbon Nanotubes | Vascular Imaging | 808 | >1000 (NIR-II) | 50 - 100 | 10-20 | Very low scattering in NIR-II; requires InGaAs cameras. |
| Lanthanide Nanoparticles | Multiplex Imaging | 808 | 1525 (Er³⁺) | 100 - 200 | >20 | Stark, narrow emissions enable multichannel detection. |
| Activatable Probes | Protease (e.g., MMP) | 680 (Quenched) 790 (Activated) | 720 / 820 | 10 - 30 | 2-5 (Superficial) | Low background; signal reports activity, not just presence. |
Table 2: Impact of Instrument Settings on Key Image Metrics
| Parameter Adjustment | Signal Intensity | Background Noise | SBR | Photobleaching Rate | Practical Guidance |
|---|---|---|---|---|---|
| Increase Laser Power | ↑↑ | ↑ (Autofluorescence) | ↑ then ↓ | ↑↑ | Increase until background rise outpaces signal. |
| Increase Exposure Time | ↑↑ | ↑ (Dark current) | ↑ then → | ↑ | Increase until camera saturation or motion blur limits. |
| Enable 2x2 Binning | ↑ (4x) | ↑ (2x) | ↑ (2x) | → | Use for real-time, low-light imaging; sacrifice resolution. |
| Widen Emission Bandpass | ↑ | ↑↑ (More ambient) | ↓ | → | Use only with very specific fluorophores; narrow is generally better. |
Detailed Experimental Protocols for Parameter Optimization
Protocol: Determining Optimal λex/λem for a New FluorophoreIn Vivo
Objective: To empirically determine the excitation/emission filter set that maximizes the SBR for a novel NIR probe in a live mouse model.
Materials: See "The Scientist's Toolkit" below. Method:
- Prepare Phantom & Animal: Create a tissue-mimicking phantom (1% Intralipid in agarose). Subcutaneously inject the fluorophore of interest (e.g., 100 pmol in 50 µL PBS) in a nude mouse.
- System Calibration: Power on the NIR imaging system and cool the camera to -80°C. Set initial parameters to a safe baseline (λex: 760 nm, Power: 5 mW/cm², Texp: 100 ms).
- Spectral Scanning: a. Fix the emission filter to a long-pass filter (e.g., 785 nm LP). b. Sequentially cycle the laser excitation wavelength (e.g., 700, 730, 760, 780, 800, 820 nm). At each λex, acquire an image of the injection site and a contralateral background region. c. Plot Mean Signal Intensity (ROI over injection) vs. λex.
- Eission Optimization: a. Set λex to the peak from Step 3. b. Sequentially acquire images using different emission long-pass or bandpass filters (e.g., 810 LP, 830 LP, 850/40 nm BP). c. For each image, calculate SBR = (SignalMean - BackgroundMean) / BackgroundSTD.
- Data Analysis: The combination (λex, λem) yielding the highest SBR is optimal. Confirm by imaging a control animal without the fluorophore to check for autofluorescence artifacts.
Protocol: Depth-Phantom Study for Penetration Limits
Objective: To quantify the relationship between imaging depth and detectable signal for a given parameter set.
Method:
- Phantom Construction: Prepare a series of black-walled wells. Fill each with a tissue-simulating scattering solution (e.g., 1% Intralipid, µs' ~10 cm⁻¹). Create a capillary tube filled with a known concentration of fluorophore.
- Depth Variation: Place the capillary at measured depths (0.5, 1, 2, 5, 10 mm) below the surface of the scattering medium in separate wells.
- Image Acquisition: Using a fixed, optimized parameter set (from Protocol 3.1), acquire an image of each well. Ensure the camera is not saturated at the most superficial depth.
- Quantification: Measure the mean pixel intensity within a ROI over the capillary at each depth. Plot Intensity vs. Depth. Fit the curve to an exponential decay model I = I₀ * exp(-µeff * d), where µeff is the effective attenuation coefficient, quantifying the penetration limit for that probe/parameter set.
Visualizing the Optimization Workflow & Key Relationships
Title: NIR Imaging Parameter Optimization Decision Workflow
Title: Photon-Tissue Interaction Pathway for NIR Signal
The Scientist's Toolkit: Key Research Reagent Solutions
Table 3: Essential Materials for NIR Fluorescence Imaging Optimization
| Item | Example Product/Category | Function in Optimization |
|---|---|---|
| NIR Fluorophores | ICG, Cy7, IRDye 800CW, NIR-II Quantum Dots | The light-emitting agent; conjugated to targeting molecules (antibodies, peptides). |
| Tissue-Simulating Phantoms | Intralipid, India Ink, Agarose, Silicone | Provide standardized, reproducible media to test penetration depth and scattering effects. |
| Tunable Laser Source | 680-850 nm Ti:Sapphire, OPO Lasers | Allows precise scanning of excitation wavelength to find the optimal λ_ex for a given probe/tissue. |
| Modular Filter Sets | Long-pass (785, 830, 1000 nm), Bandpass (820/10, 850/40 nm) | Isolate the emission signal; testing different sets is key to maximizing SBR. |
| Cooled CCD/CMOS Camera | -80°C cooled, high QE >80% (NIR-I) | Detects low-intensity photons with minimal thermal noise. Essential for quantitative imaging. |
| InGaAs Camera | Stirling-cooled SWIR camera | Required for detection in the NIR-II (1000-1700 nm) region for deepest penetration. |
| Image Analysis Software | ImageJ (FIJI), Living Image, MATLAB | Enables ROI quantification, SBR calculation, kinetic analysis, and 3D reconstruction. |
| Animal Model | Nude mice, orthotopic/PDX models | Provides the in vivo context for testing parameter efficacy in real, heterogeneous tissue. |
Spectral unmixing represents a critical advancement in the field of near-infrared (NIR) fluorescence imaging, a core modality within preclinical and biomedical research. The fundamental thesis of modern NIR imaging emphasizes the penetration depth, reduced tissue autofluorescence, and potential for multiplexing. However, the practical realization of multiplexing is hindered by the broad emission spectra of fluorophores and pervasive background signals, including tissue autofluorescence and non-specific probe accumulation. Spectral unmixing addresses these limitations by mathematically isolating the contribution of each spectral component within a mixed pixel, enabling accurate multicolor imaging and effective background subtraction. This guide details the advanced principles, protocols, and computational techniques essential for implementing spectral unmixing to enhance the fidelity and quantitative power of NIR imaging studies in drug development.
Core Principles of Spectral Unmixing
Spectral unmixing operates on the principle that the measured signal intensity I(λ) at each pixel is a linear combination of the contributions from n distinct spectral sources (fluorophores, autofluorescence).
The Linear Mixing Model:
I(λ) = Σ [a_i * S_i(λ)] + ε(λ) for i = 1 to n
where:
I(λ)= Measured intensity vector across wavelengths.a_i= Abundance coefficient of the i-th fluorophore in the pixel.S_i(λ)= Reference spectral signature (emission spectrum) of the i-th fluorophore.ε(λ)= Additive noise or error term.
The goal is to solve for the unknown abundances a_i given I(λ) and known S_i(λ). Accurate unmixing requires a priori knowledge of the pure spectral signatures (S_i), which must be acquired from control samples.
Detailed Experimental Protocols
Protocol: Acquisition of Reference Spectral Libraries
Objective: To obtain the pure emission spectrum (S_i) for each fluorophore and autofluorescence for use in the unmixing algorithm.
Sample Preparation:
- Prepare separate slide-mounted specimens or animal models for each fluorophore used in the multiplex panel (e.g., ICG, IRDye 680RD, IRDye 800CW).
- Include a control specimen (no fluorophore) to capture the tissue autofluorescence signature.
- Ensure imaging parameters (exposure, gain, laser power) are identical to those planned for the multiplex experiment.
Imaging & Data Acquisition:
- Use a spectral imaging system (e.g., Maestro, IVIS Spectrum, or confocal/multispectral microscopes).
- Acquire a lambda scan (or emission scan) across the relevant wavelength range (e.g., 700-950 nm for NIR).
- For each specimen, define a Region of Interest (ROI) over the fluorescent signal (or tissue for autofluorescence).
- Export the mean spectral curve from each ROI. This curve, normalized to its maximum, becomes
S_i(λ).
Protocol: In Vivo Multicolor NIR Imaging with Unmixing
Objective: To simultaneously image multiple targeted fluorescent probes in a live animal model.
Probe Administration:
- Administer fluorescently-labeled targeting agents (e.g., antibodies, peptides) via tail vein injection. Allow appropriate circulation/clearance time (e.g., 24-48 hrs).
- Dosage: Refer to Table 1 for typical quantities.
Spectral Image Acquisition:
- Anesthetize the animal and place it in the imaging chamber.
- Acquire a multispectral image cube: a series of 2D images across sequential emission filters (e.g., 10-20 filters spanning the emission range).
- Maintain sub-saturating pixel intensities to preserve linearity.
Spectral Unmixing Analysis (Workflow Diagram):
- Load the multispectral image cube and the reference spectral library into analysis software (e.g., PerkinElmer's Maestro software, Cygnus, ENVI, or custom code in Python/MATLAB).
- Execute a linear least-squares or non-negative least squares (NNLS) algorithm to solve for abundance maps (
a_imaps) for each component. - Apply a threshold to remove noise-derived false positives (typically values below 1-3% of max signal).
- Generate unmixed grayscale or pseudocolored images representing the spatial distribution of each individual fluorophore and the subtracted autofluorescence.
Title: Spectral Unmixing & Background Subtraction Workflow
Data Presentation: Fluorophore Characteristics & Performance
Table 1: Common NIR Fluorophores for Multiplexed Imaging
| Fluorophore | Peak Excitation (nm) | Peak Emission (nm) | Typical In Vivo Dose (nmol) | Common Conjugate | Key Application |
|---|---|---|---|---|---|
| ICG | 780 | 820 | 50-200 (clinical) | Non-specific | Angiography, Perfusion |
| IRDye 680RD | 680 | 700 | 1-4 | Antibody, Peptide | Target Engagement (e.g., HER2) |
| IRDye 800CW | 775 | 795 | 1-4 | Antibody, Peptide | Target Engagement (e.g., EGFR) |
| CF750 | 750 | 775 | 1-4 | Antibody, Small Molecule | Biodistribution |
| Alexa Fluor 750 | 749 | 775 | 1-4 | Antibody | Intracellular Targets |
Table 2: Unmixing Algorithm Performance Comparison
| Algorithm | Principle | Advantages | Limitations | Best For |
|---|---|---|---|---|
| Linear Least Squares (LLS) | Minimizes sum squared error | Fast, simple, deterministic | Can yield negative abundances (non-physical) | Well-separated spectra, high SNR |
| Non-Negative Least Squares (NNLS) | LLS with constraint a_i ≥ 0 | Physically meaningful results, reduces crosstalk | Slightly slower than LLS | General purpose, most biological imaging |
| Principal Component Analysis (PCA) | Dimensionality reduction | Identifies dominant components, good for unknown signals | Unmixed components may not match pure spectra | Exploratory analysis, autofluorescence ID |
The Scientist's Toolkit: Research Reagent Solutions
Table 3: Essential Materials for Spectral Unmixing Experiments
| Item | Function & Explanation | Example Vendor/Product |
|---|---|---|
| NIR Fluorescent Dyes | Provide the multiplexing signals. Must have distinct but overlapping spectra for unmixing. | LI-COR Biosciences (IRDye), Cyanine (Cy dyes), Thermo Fisher (Alexa Fluor) |
| Target-Specific Conjugates | Antibodies, peptides, or small molecules labeled with NIR dyes to target biomarkers of interest. | Custom conjugation services (e.g., Vector Labs, BioVision) |
| Spectral Imaging System | Instrument capable of capturing the multispectral image cube (lambda stacks). | PerkinElmer IVIS Spectrum, Azure Biosystems Sapphire, Maestro 2 (CRi) |
| Fluorescence Reference Standards | Stable, solid-state or liquid samples with known spectra for instrument calibration and validation. | Horizon (Mega-10), Bio-Rad Fluorescent Checkers |
| Tissue-Mimicking Phantoms | Optical phantoms with known fluorophore concentrations and scattering properties to validate unmixing accuracy. | Institute of Cancer Research Phantoms, custom agarose/Intralipid phantoms |
| Analysis Software with Unmixing Module | Software to perform the mathematical unmixing and generate abundance maps. | PerkinElmer Living Image, ImageJ/Fiji with Plugins (TauSplit), MATLAB Image Processing Toolbox |
| Autofluorescence Reduction Reagents | Agents to reduce endogenous background (e.g., Evans blue, Sudan Black B for tissue sections). | Sigma-Aldrich |
Advanced Considerations & Pathway Analysis
Effective background subtraction often targets specific autofluorescence pathways. A common source is the metabolic cofactor Flavin Adenine Dinucleotide (FAD).
Title: FAD Autofluorescence Pathway & Unmixing Solution
Spectral unmixing transforms multicolor NIR fluorescence imaging from a challenging endeavor into a robust, quantitative tool. By rigorously applying the protocols for spectral library acquisition and employing appropriate unmixing algorithms, researchers can dissect complex molecular events in vivo, monitor multiple drug targets simultaneously, and achieve superior signal-to-background ratios. This capability is foundational for advancing the thesis of NIR imaging in translational research, directly impacting the precision and efficiency of drug development pipelines. Future directions involve the integration of artificial intelligence for improved unmixing accuracy and the development of fluorophores with optimized spectral properties for higher-order multiplexing.
An In-depth Technical Guide Framed Within NIR Fluorescence Imaging Research
The quantification of Near-Infrared (NIR) fluorescence signals is fundamental to preclinical and translational research in oncology, inflammation, and drug development. The accurate selection and quantification of Regions of Interest (ROI) directly dictate the reliability of key pharmacokinetic and pharmacodynamic metrics, such as target engagement, biodistribution, and treatment efficacy. This guide details best-practice pipelines for ROI selection and quantification, framed within the technical context of NIR imaging principles, to maximize data integrity and return on investment (ROI) in research endeavors.
Foundational Principles: NIR Fluorescence and Signal Characteristics
NIR fluorescence imaging (typically 650-900 nm) offers reduced tissue autofluorescence and deeper penetration compared to visible light. Accurate quantification requires understanding key signal properties:
- Signal-to-Background Ratio (SBR): The primary metric for distinguishing specific signal from noise.
- Photon Attenuation: Signal intensity decreases exponentially with depth.
- Fluorophore Quenching: Signal is not linearly proportional to fluorophore concentration at high levels.
Table 1: Key NIR Fluorophores and Their Properties
| Fluorophore | Excitation (nm) | Emission (nm) | Common Application | Key Consideration for Quantification |
|---|---|---|---|---|
| ICG | 780 | 820 | Angiography, Liver Function | Binding to plasma proteins alters fluorescence yield. |
| Cy5.5 | 675 | 694 | Antibody Conjugation | pH sensitivity can affect signal stability. |
| IRDye 800CW | 774 | 789 | Small Molecule & Antibody Imaging | High photostability, suitable for longitudinal studies. |
| Alexa Fluor 750 | 749 | 775 | Receptor Targeting | Consistent quantum yield across a range of pH. |
Core Pipeline: ROI Selection & Quantification
Pre-Processing: Calibration and Normalization
Protocol: Flat-field correction must be performed using a uniform fluorescent slide or reference standard imaged under identical acquisition settings (exposure time, gain, f-stop). Pixel values are normalized to the reference standard to correct for illumination inhomogeneity. Background subtraction is performed using an ROI from an adjacent, non-fluorescent tissue region.
ROI Selection Methodologies
A tiered approach to ROI selection ensures robustness.
Protocol A: Anatomical ROI Definition (Manual)
- Coregister fluorescent image with a white light or anatomical reference image (e.g., MRI, CT).
- Manually delineate the ROI boundary using anatomical landmarks (e.g., organ margins, tumor boundary from palpable mass).
- Apply the defined ROI mask to all subsequent images in a time series for consistent measurement. Best for: Distinct anatomical targets, validating automated methods.
Protocol B: Threshold-Based ROI Definition (Semi-Automated)
- Calculate the mean (μ) and standard deviation (σ) of background signal from a reference tissue ROI.
- Set a global threshold:
Threshold = μ_background + n*σ_background(where n is typically 3-5). - Apply threshold to create a binary mask. Use morphological operations (e.g., erosion/dilation) to remove noise pixels.
- Define contiguous pixel clusters above threshold as the signal ROI. Best for: High-contrast images, ex vivo tissue analysis.
Protocol C: Kinetic Modeling-Guided ROI (Advanced)
- Perform non-negative matrix factorization (NMF) or principal component analysis (PCA) on an image time series (e.g., 0-72h post-injection).
- Identify components with kinetic profiles matching expected pharmacokinetics.
- Generate ROI masks based on the spatial weighting of the relevant component. Best for: Separating specific binding from non-specific uptake or clearing signal.
Quantification Metrics and Their Calculation
Quantify within the selected ROI using multiple complementary metrics.
Protocol for Metric Calculation:
- Total Fluorescence Intensity (TFI):
TFI = Σ (Pixel Intensity_i - Mean Background)for all i pixels in ROI. Sums total signal burden. - Mean Fluorescence Intensity (MFI):
MFI = TFI / Area_pixels. Normalizes for ROI size, indicating signal concentration. - Signal-to-Background Ratio (SBR):
SBR = MFI_ROI / MFI_Background. Measures contrast and specificity. - % Injected Dose per Gram (%ID/g):
%ID/g = (MFI_ROI / Slope_Standard_Curve) / Tissue_Weight_g * 100. Requires an ex vivo standard curve of fluorophore concentration vs. MFI.
Table 2: Quantitative Output Table for a Typical NIR Experiment
| Animal ID | Treatment Group | ROI (Tumor) MFI | ROI Area (px²) | Background MFI | SBR | %ID/g (Ex Vivo) | Notes (e.g., necrosis) |
|---|---|---|---|---|---|---|---|
| M1 | Control | 8550 | 1200 | 550 | 15.5 | 3.2 | Homogeneous signal |
| M2 | Control | 9010 | 1150 | 510 | 17.7 | 3.5 | - |
| M3 | Therapeutic A | 4220 | 1100 | 490 | 8.6 | 1.5 | Peripheral rim pattern |
| M4 | Therapeutic A | 3870 | 1050 | 505 | 7.7 | 1.4 | - |
The Scientist's Toolkit: Essential Research Reagents & Materials
Table 3: Key Research Reagent Solutions for NIR Fluorescence ROI Studies
| Item | Function & Relevance to ROI Analysis |
|---|---|
| NIR Fluorescent Probes (e.g., targeted antibodies, small molecules) | Generate the specific signal for quantification. Conjugation purity and dye:protein ratio directly affect signal specificity and SBR. |
| Fluorescent Reference Standards (e.g., serial dilutions in epoxy resin or tissue phantoms) | Enable calibration for intra- and inter-study comparison and conversion of MFI to %ID/g. |
| Matrigel or Tissue Phantoms | Mimic tissue optical properties for pre-validation of ROI protocols and depth correction algorithms. |
| Image Analysis Software (e.g., FIJI/ImageJ, Living Image, AIVIA) | Platforms for executing pre-processing, applying ROI masks, and extracting quantitative metrics. Scriptable for pipeline consistency. |
| Statistical Analysis Software (e.g., GraphPad Prism, R) | Essential for comparing quantified ROI metrics (MFI, SBR, %ID/g) between experimental groups with appropriate tests (t-test, ANOVA). |
Visualization of Core Workflows and Relationships
A rigorous, multi-metric approach to ROI selection and quantification in NIR fluorescence imaging transforms qualitative images into robust, statistically evaluable data. By implementing standardized pre-processing, justifying ROI selection methodology based on signal kinetics, and employing complementary quantification metrics, researchers can ensure their data withstands scrutiny, directly supporting critical decisions in drug development and mechanistic research.
Benchmarking NIR Fluorescence: Validation, Quantification, and Modal Comparison
This whitepaper, framed within a broader thesis on Near-Infrared (NIR) fluorescence imaging principles, addresses the critical validation paradigm for in vivo NIR imaging data. The core thesis posits that quantitative NIR signals acquire biological and translational relevance only when rigorously correlated with established ex vivo analytical standards. This guide details the experimental and analytical frameworks for validating NIR imaging findings through correlation with ex vivo histology and Liquid Chromatography-Mass Spectrometry (LC-MS), thereby bridging non-invasive functional imaging with molecular and morphological truth.
Foundational Principles & Validation Rationale
NIR imaging (typically 700-900 nm) offers deep tissue penetration and low autofluorescence. Validation is required to:
- Confirm Target Specificity: Distinguish specific probe binding from passive accumulation.
- Quantify Biodistribution: Translate pixel intensity (Counts/s/cm²/sr) into absolute analyte concentration (e.g., pmol/mg tissue).
- Contextualize Signal: Relate optical signals to histological anatomy and pathology.
A tripartite validation strategy is employed:
- In vivo NIR Fluorescence Imaging
- Ex vivo Histological Analysis (spatial context)
- Ex vivo LC-MS (absolute quantification)
Experimental Protocols for Correlation Studies
Protocol 1: IntegratedIn VivotoEx VivoWorkflow
- Animal Model & Probe Administration: Implant tumor xenografts or disease model. Inject NIR fluorescent probe (e.g., receptor-targeted agent or protease-activatable probe).
- In Vivo NIR Imaging: At predetermined time points, anesthetize animal and image using a calibrated NIR fluorescence imager. Acquire data in both epi-illumination and transillumination modes if possible. Record radiometric efficiency (µW/cm²/sr) / (mW/cm²) for quantitative analysis.
- Tissue Harvest: Euthanize animal at imaging endpoint. Excise organs/tumors of interest. Weigh and photograph under brightfield and NIR ex vivo.
- Tissue Sectioning: Snap-freeze organs in optimal cutting temperature (OCT) compound. Serially section tissue cryostat (e.g., 10 µm thickness).
- Section Set A (for Histology): Mount on standard slides for H&E and immunohistochemistry (IHC).
- Section Set B (for NIR Microscopy): Mount on non-fluorescent slides for direct NIR fluorescence scanning.
- Adjacent Tissue (for LC-MS): Allocate a separate, non-sectioned portion of the same tissue, weighed and stored at -80°C.
Protocol 2: LC-MS/MS for Absolute Probe Quantification
- Tissue Homogenization: Homogenize weighed frozen tissue in appropriate buffer (e.g., PBS with protease inhibitors).
- Probe Extraction: Add solvent (e.g., DMSO:MeOH, 1:1) to extract probe. Vortex, sonicate, and centrifuge.
- Calibration Standards: Prepare a dilution series of the pure NIR probe in blank tissue homogenate.
- LC-MS/MS Analysis:
- Chromatography: Reverse-phase C18 column. Mobile phase: Water/Acetonitrile with 0.1% Formic Acid.
- Mass Spectrometry: Operate in Multiple Reaction Monitoring (MRM) mode. Optimize for probe-specific parent ion → product ion transition.
- Quantification: Integrate peak areas. Generate a linear standard curve (concentration vs. area). Calculate probe concentration in unknown samples (pmol/mg tissue).
Protocol 3: Correlative Histology and Digital Image Analysis
- H&E Staining: Perform on Section Set A for morphological assessment.
- IHC/Fluorescence IHC: Stain adjacent sections for the target protein (e.g., receptor, protease) to confirm probe co-localization.
- NIR Fluorescence Slide Scanning: Digitally scan Section Set B using a NIR-capable slide scanner or microscope with consistent exposure settings.
- Image Co-Registration: Use image analysis software (e.g., ImageJ, HALO, Indica Labs) to align the H&E, IHC, and NIR scan images of serial/adjacent sections.
- Region of Interest (ROI) Analysis: Define ROIs based on histology (e.g., tumor core, necrotic area, healthy parenchyma). Extract mean fluorescence intensity (MFI) from the co-registered NIR scan for each ROI.
Data Integration & Correlation Analysis
The core validation lies in statistically correlating datasets from the three modalities.
Table 1: Example Correlation Data from a Hypothetical Tumor-Targeting NIR Probe Study
| Tissue Sample | In Vivo NIR Signal (Avg Radiant Efficiency) | Ex Vivo NIR Scan MFI (a.u.) | LC-MS Quantification (pmol/mg tissue) | IHC Target Score (0-3+) |
|---|---|---|---|---|
| Tumor Core | 8.5 x 10⁹ | 15,200 | 125.4 | 3+ |
| Tumor Margin | 4.2 x 10⁹ | 7,850 | 58.7 | 2+ |
| Liver | 1.8 x 10⁹ | 950 | 12.1 | 0 |
| Muscle | 0.5 x 10⁹ | 210 | 2.3 | 0 |
| Correlation (r) with LC-MS | r = 0.98 | r = 0.99 | — | r = 0.94 |
Statistical Analysis: Perform Pearson or Spearman correlation between:
- In vivo NIR radiant efficiency vs. LC-MS tissue concentration.
- Ex vivo NIR scan MFI vs. LC-MS tissue concentration.
- IHC target expression score vs. LC-MS tissue concentration. A high correlation coefficient (r > 0.9) validates the NIR signal as a quantitative biomarker of probe concentration and, by inference, target biology.
The Scientist's Toolkit: Essential Research Reagents & Materials
Table 2: Key Research Reagent Solutions for NIR Validation Studies
| Item | Function & Rationale |
|---|---|
| NIR Fluorescent Probes (e.g., IRDye 800CW, Cy7 conjugates) | High-quantum-yield fluorophores emitting in the NIR window for deep tissue imaging with minimal background. |
| Anti-Fluorophore Antibodies | For IHC, to amplify or confirm the presence of the probe itself in tissue sections, distinguishing it from autofluorescence. |
| LC-MS Internal Standard (Isotope-labeled analog of probe) | Added to tissue homogenates before extraction to correct for procedural losses and matrix effects, ensuring quantification accuracy. |
| Cryostat & OCT Compound | For producing high-quality, thin tissue sections that preserve morphology and fluorescence for correlative analysis. |
| NIR Fluorescence Slide Scanner | Enables high-resolution, quantitative digital imaging of fluorescence in tissue sections, producing data compatible with histology image analysis pipelines. |
| Tissue Homogenization Kit (Bead Mill) | Ensines complete and uniform tissue lysis for reproducible probe extraction prior to LC-MS. |
| Reverse-Phase LC Column (C18, 2.1 x 50 mm, 1.7-1.8 µm) | Provides efficient chromatographic separation of the probe from complex tissue metabolites, reducing ion suppression in MS. |
| Image Co-Registration Software | Critical for spatially aligning digital images from different modalities (H&E, IHC, NIR) to perform pixel- or ROI-based correlation. |
Visualizing the Validation Workflow & Logic
Title: Integrated NIR Data Validation Workflow
Title: Hypothesis-Driven NIR Signal Validation Logic
Quantitative Analysis for Pharmacokinetics (PK) and Biodistribution Studies
This technical guide details the quantitative analytical methods used in pharmacokinetics (PK) and biodistribution studies, framed within the ongoing research on NIR fluorescence imaging principles. These analyses are critical for translating imaging data into robust, quantitative parameters that inform drug development.
Core Quantitative Parameters from NIR Imaging Data
NIR fluorescence imaging provides spatially resolved data that, when quantified, yields standard and advanced PK/biodistribution metrics.
Table 1: Core Quantitative PK/Biodistribution Parameters Derived from NIR Imaging
| Parameter | Definition (from Imaging Data) | Formula/Description | Key Insight Provided |
|---|---|---|---|
| Fluorescence Intensity (FI) | Raw signal from region of interest (ROI). | Mean pixel intensity within ROI (AU). | Proportional to tracer concentration in tissue. |
| % Injected Dose per Gram (%ID/g) | Standard biodistribution metric. | (FItissue / FIstandard) * (Weightstandard / Weighttissue) * 100%. FI_standard from a reference with known tracer concentration. | Normalized tissue uptake; enables cross-study comparison. |
| Area Under the Curve (AUC) | Total systemic exposure. | ∫ FI_blood(t) dt from t=0 to t=last time point. Calculated via trapezoidal rule. | Governs efficacy and toxicity; used to calculate clearance. |
| Clearance (CL) | Volume of blood cleared of tracer per unit time. | Dose / AUC. | Indicates elimination efficiency (hepatic/renal). |
| Volume of Distribution (Vd) | Apparent volume into which tracer distributes. | Dose / C0 (estimated initial concentration from back-extrapolation of blood curve). | Indicates tissue penetration and sequestration. |
| Terminal Half-life (t1/2) | Time for blood concentration to halve in terminal phase. | ln(2) / λz, where λz is terminal slope of ln(FI) vs. time curve. | Determines dosing frequency. |
| Target-to-Background Ratio (TBR) | Specificity of tracer accumulation. | Mean FItarget tissue / Mean FIadjacent normal tissue. | Critical for diagnostic and therapeutic window assessment. |
Experimental Protocols for Quantitative NIR PK/Biodistribution Studies
Protocol 1: In Vivo Longitudinal PK and Biodistribution Imaging
- Objective: To non-invasively determine blood clearance and organ distribution kinetics of an NIR-labeled therapeutic agent (e.g., antibody-dye conjugate).
- Materials: See "The Scientist's Toolkit" below.
- Procedure:
- Animal Preparation: Anesthetize and depilate mice (n=5-8/group). Place on heated imaging stage.
- Baseline Imaging: Acquire pre-injection images at correct NIR excitation/emission wavelengths (e.g., 745/800 nm for ICG-derivatives).
- Tracer Administration: Inject tracer intravenously via tail vein at a standardized dose (e.g., 2 nmol in 100 µL PBS).
- Time-point Imaging: Image animals at serial time points (e.g., 5 min, 1h, 4h, 24h, 48h, 72h post-injection). Maintain consistent anesthesia, positioning, and imaging parameters (exposure time, lamp voltage).
- ROI Analysis: Draw ROIs over major organs (heart, liver, spleen, kidneys, tumor) and a background region. Record mean fluorescence intensity for each ROI.
- Calibration: Image a reference tube with known tracer concentration alongside animals to convert FI to concentration or %ID/g.
- Data Processing: Apply background subtraction. Calculate PK parameters (AUC, t1/2) from blood pool (heart ROI) kinetics and biodistribution (%ID/g, TBR) from tissue ROIs.
Protocol 2: Ex Vivo Validation and Absolute Quantification
- Objective: To validate in vivo imaging data and obtain absolute tracer quantification in tissues.
- Procedure:
- Terminal Time Points: At selected endpoints post-injection (e.g., 24h and 72h), euthanize animals (n=3-5/time point).
- Organ Harvest: Excise all organs of interest, tumors, and a blood sample.
- Ex Vivo Imaging: Rapidly image all harvested tissues under the same settings as in vivo.
- Homogenization: Homogenize weighed tissues in a suitable buffer.
- Standard Curve: Prepare a dilution series of the tracer in matched control tissue homogenates.
- Fluorescence Measurement: Measure fluorescence of homogenates and standards using a plate reader with appropriate NIR filters.
- Calculation: Calculate %ID/g from standard curve. Correlate with ex vivo and in vivo ROI intensities to validate the imaging data.
Visualization of Workflows and Relationships
Short Title: Quantitative NIR PK/BD Study Workflow
Short Title: Two-Compartment PK Model with Target Binding
The Scientist's Toolkit: Essential Research Reagent Solutions
Table 2: Key Reagents and Materials for Quantitative NIR PK/BD Studies
| Item | Function/Description |
|---|---|
| NIR Fluorescent Probes (e.g., IRDye 800CW, Cy7, Alexa Fluor 750) | High quantum yield dyes with low tissue autofluorescence, enabling deep tissue imaging. Conjugated to therapeutics (antibodies, peptides, nanoparticles). |
| NIR Fluorescence Imaging System (e.g., LI-COR Pearl, PerkinElmer IVIS) | Instrument with appropriate excitation lasers/ filters and sensitive CCD cameras for quantitative 2D epi-fluorescence or 3D tomography imaging. |
| Image Analysis Software (e.g., LI-COR Image Studio, Living Image Software, Fiji/ImageJ) | For drawing ROIs, quantifying mean fluorescence intensity, applying calibration, and managing time-series data. |
| Calibration Standards | Tubes or wells containing known concentrations of the NIR tracer, imaged alongside subjects to convert Fluorescence Intensity to concentration or %ID. |
| Matrix-Matched Homogenization Kits | For ex vivo tissue processing. Buffers and protease inhibitors to maintain tracer integrity during homogenization for plate reader validation. |
| Reference Compounds (e.g., Indocyanine Green (ICG)) | Well-characterized control tracer for validating instrument performance and comparing against novel agents. |
| Anesthetic System (Isoflurane/O2 vaporizer) | For safe, prolonged animal anesthesia during longitudinal imaging sessions, ensuring no motion artifacts. |
| Animal Depilatory Cream | To remove hair that scatters and absorbs NIR light, ensuring consistent and maximal signal detection from the tissue. |
This whitepaper situates the comparative analysis of Near-Infrared (NIR) fluorescence imaging within a broader thesis on its foundational principles. NIR imaging (typically 700-900 nm) leverages the interaction of light with tissue, offering a unique set of biophysical contrasts. Understanding its capabilities relative to established clinical modalities like Magnetic Resonance Imaging (MRI), Computed Tomography (CT), and Positron Emission Tomography (PET) is crucial for researchers and drug development professionals aiming to select or combine modalities for specific preclinical and clinical applications.
Comparative Analysis of Imaging Modalities
The core strengths and weaknesses of each modality arise from their underlying physical principles, which dictate their spatial resolution, depth penetration, sensitivity, and the type of information they provide.
Table 1: Core Technical and Performance Comparison
| Modality | Physical Principle | Primary Contrast/Probe | Spatial Resolution | Depth Penetration | Temporal Resolution | Key Quantitative Metric (Typical) |
|---|---|---|---|---|---|---|
| NIR Fluorescence | Light absorption & emission | Exogenous fluorophores (e.g., ICG, IRDye800CW) | High (1-3 mm) | Low (<1-5 cm) | Very High (sec-min) | Fluorescence Intensity (RFU), %ID/g |
| MRI | Nuclear magnetic resonance | Endogenous tissue (T1/T2), Gd-/Iron-based agents | Very High (50-500 µm) | Unlimited | Low (min-hr) | Relaxation times (T1, T2), Contrast Enhancement |
| CT | X-ray attenuation | Iodinated/Barium agents | High (50-200 µm) | Unlimited | High (sec-min) | Hounsfield Units (HU) |
| PET | Positron annihilation | Radiotracers (e.g., ¹⁸F-FDG) | Low (2-5 mm) | Unlimited | Moderate (min) | Standardized Uptake Value (SUV) |
Table 2: Functional and Practical Comparison for Research & Development
| Parameter | NIR Fluorescence | MRI | CT | PET |
|---|---|---|---|---|
| Molecular Sensitivity | Very High (nM-pM) | Low (µM-mM) | Very Low (mM-M) | Extremely High (pM-fM) |
| Functional/ Metabolic Info | Agent-dependent (e.g., protease sensing) | Excellent (Diffusion, Perfusion, fMRI) | Poor (anatomy only) | Excellent (Glucose metabolism, receptor density) |
| Quantification Difficulty | High (scattering, attenuation) | Moderate | Straightforward | Robust (absolute) |
| Throughput | Very High | Very Low | High | Low |
| Cost per Scan | Low | Very High | Moderate | High |
| Ionizing Radiation | No | No | Yes | Yes |
| Real-Time Capability | Yes (intraoperative) | No | Limited | No |
Detailed Methodologies for Key NIR Experiments
To illustrate NIR's application, here are protocols for two cornerstone experiments in drug development.
Protocol 1: In Vivo Biodistribution and Tumor Targeting Study
- Objective: Quantify the accumulation of a NIR-labeled therapeutic antibody in tumor vs. normal tissues.
- Reagents: Target-specific antibody conjugated to IRDye800CW, PBS, Isoflurane, hair removal cream.
- Animal Model: Mice bearing subcutaneous xenografts.
- Procedure:
- Preparation: Anesthetize mice (2% isoflurane). Administer dye-antibody conjugate (2-4 nmol in 100 µL PBS) via tail vein.
- Longitudinal Imaging: At set time points (1, 4, 24, 48, 72h), image anesthetized mice using a NIR imager. Use consistent exposure settings and collect both bright-field and fluorescent (ex: 785 nm, em: 820 nm) images.
- Ex Vivo Analysis: At terminal time point, euthanize mice. Excise tumors and key organs (liver, spleen, kidney, muscle). Image ex vivo to quantify fluorescence.
- Data Analysis: Draw regions of interest (ROIs). Subtract background (autofluorescence from control mouse). Express data as Mean Fluorescence Intensity (MFI) or as % Injected Dose per gram of tissue (%ID/g) using a calibration curve.
Protocol 2: Intraoperative Sentinel Lymph Node (SLN) Mapping
- Objective: Visually identify the first-draining lymph node from a tumor site during surgery.
- Reagents: Clinical-grade Indocyanine Green (ICG).
- Procedure:
- Tracer Injection: At surgery start, inject 0.5-1.0 mL of ICG (250-500 µM) peritumorally or intradermally.
- Real-Time Imaging: Use a commercial FDA-cleared NIR imaging system (e.g., PINPOINT, SPY). Switch the camera to NIR fluorescence mode.
- Identification & Resection: Observe the lymphatic channel draining from the injection site in real-time. The first node(s) to fluoresce is the SLN. Visually guide resection.
- Confirmation: Excise the fluorescent node and re-image ex vivo. The absence of residual fluorescence in the basin confirms removal.
Visualizing Key Signaling Pathways and Workflows
Title: NIR Probe Development and Validation Pipeline
Title: NIR Imaging Molecular Principle
The Scientist's Toolkit: Key Research Reagent Solutions
Table 3: Essential Materials for NIR Fluorescence Imaging Research
| Item | Function | Example/Typical Use |
|---|---|---|
| NIR Fluorophores | Light-emitting reporter molecules. | IRDye800CW: Protein conjugation. ICG: Clinical SLN mapping, angiography. Cy7: Small molecule/peptide labeling. |
| Targeting Ligands | Provide specificity to biomarkers. | Monoclonal Antibodies: High-affinity target binding. Peptides: Rapid penetration, smaller size. Affibodies: Engineered scaffold proteins. |
| Conjugation Kits | Facilitate covalent attachment of dye to ligand. | NHS-ester based kits for amine coupling. Maleimide kits for thiol coupling. Click chemistry kits. |
| Blocking Agents | Reduce non-specific background signal. | Mouse/rat serum: For in vivo rodent studies. BSA/PBS-T: For in vitro assays. |
| Calibration Phantoms | Enable fluorescence quantification. | Solid or liquid phantoms with known dye concentrations for system calibration and defining %ID/g. |
| Matched Imaging Systems | Dedicated hardware for excitation/emission capture. | Preclinical: LI-COR Pearl, PerkinElmer IVIS. Clinical: Stryker SPY, Quest Spectrum. |
| Analysis Software | Quantify fluorescence intensity and kinetics. | LI-COR Image Studio, Living Image (PerkinElmer), FIJI/ImageJ with NIR plugins. |
Near-infrared (NIR) fluorescence imaging has become a cornerstone technique in preclinical research, enabling non-invasive visualization of biological processes in vivo. Its utility hinges on two fundamental performance benchmarks: sensitivity (the ability to detect low target concentrations) and spatial resolution (the ability to distinguish proximate structures). This whitepaper, framed within a broader thesis on NIR imaging principles, delineates the realistic measurement capabilities of modern NIR imaging systems by synthesizing current benchmark data, detailing standardized experimental protocols, and providing a toolkit for researchers and drug development professionals.
Biological tissues exhibit reduced scattering and absorption of light in the NIR spectrum (typically 650-900 nm), the so-called "first biological window." This allows for deeper photon penetration (up to several centimeters) and minimal autofluorescence compared to visible light, resulting in superior signal-to-background ratios. The realistic measurement limits of NIR imaging are dictated by the interplay between instrumentation, probe chemistry, and experimental design.
Quantitative Benchmarks: System Performance
Performance benchmarks are derived from standardized tests using phantom models and in vivo models. The following tables consolidate current data from leading commercial systems and recent literature.
Table 1: Sensitivity Benchmarks of Common NIR Imaging Systems
| System Type | Excitation (nm) | Emission (nm) | Minimum Detectable Radiance (p/s/cm²/sr) | Minimum Detectable Fluorophore Concentration (in vivo) | Reference Year |
|---|---|---|---|---|---|
| Continuous Wave (CW) 2D | 745 | 800 | ~ 5 x 10⁵ | 100-500 pM | 2023 |
| Frequency-Domain (FD) | 750 | 780 | ~ 1 x 10⁵ | 50-200 pM | 2024 |
| Time-Resolved (TR) | 770 | 795 | ~ 5 x 10⁴ | 10-50 pM | 2024 |
| Hybrid FMT-CT | 785 | 820 | ~ 1 x 10⁴ | < 10 pM (deep tissue) | 2023 |
Note: pM = picomolar. Concentrations are approximate and depend heavily on probe brightness and target depth.
Table 2: Spatial Resolution Benchmarks
| Modality | Lateral Resolution (Surface) | Axial Resolution | Effective Depth Limit | Key Determining Factors |
|---|---|---|---|---|
| Planar Reflectance Imaging | 50-200 µm | N/A | 1-2 mm | Lens NA, Camera Pixel Size |
| Diffuse Optical Tomography | 1-2 mm | 1-3 mm | 5-10 cm | Source-Detector Geometry, Reconstruction Algorithm |
| Fluorescence Molecular Tomography (FMT) | 1-3 mm | 1-3 mm | 5-8 cm | Tomographic Probes, Co-registration (CT/MRI) |
| Hybrid MSOT (Multispectral Optoacoustic) | 100-300 µm | 100-300 µm | 1-3 cm | Ultrasound Frequency, Wavelength Tuning |
Experimental Protocols for Benchmarking
To ensure reproducible and comparable results, standardized protocols are essential.
Protocol 3.1: System Sensitivity Calibration Using Ependorf Phantoms
Objective: To determine the minimum detectable fluorophore concentration of an imaging system. Materials:
- Serial dilutions of IRDye 800CW or ICG in 1% Intralipid (tissue-mimicking phantom).
- Black-walled 96-well plate or capillary tubes embedded in 1% Intralipid.
- NIR imaging system. Methodology:
- Prepare fluorophore dilutions in a logarithmic series (e.g., 10 nM to 0.1 pM) in phantom solution.
- Load solutions into wells/tubes. Include a phantom-only blank.
- Acquire images using standardized system settings (exposure time, binning, f-stop).
- Plot mean radiant efficiency ([p/s/cm²/sr] / [µW/cm²]) vs. concentration.
- Calculate limit of detection (LOD) as mean blank signal + 3*SD of the blank. Analysis: The LOD defines the system's sensitivity under ideal, shallow conditions.
Protocol 3.2: In Vivo Resolution Assessment via Subcutaneous Implant Model
Objective: To quantify in vivo spatial resolution and detectability of closely spaced targets. Materials:
- Mouse model.
- Fluorescent beads or hydrogel capsules containing known NIR fluorophore concentrations.
- Surgical tools. Methodology:
- Anesthetize and prepare the animal.
- Create subcutaneous pockets at varying depths (2-5 mm).
- Implant pairs of fluorescent sources (beads/capsules) with known inter-source distances (0.5 mm to 5 mm).
- Acquire 2D planar and/or 3D tomographic images.
- Measure the Full Width at Half Maximum (FWHM) of the imaged source profile and determine the minimum distance at which two sources are discernible (Rayleigh-like criterion). Analysis: This provides a practical, in vivo measure of spatial resolution as a function of depth.
Title: NIR System Benchmarking Workflow
Pathways and Workflows in NIR Imaging Applications
A typical application in drug development involves targeting a specific biomarker. The following diagram illustrates the signaling pathway and corresponding imaging workflow for a common target, VEGFR2 (Vascular Endothelial Growth Factor Receptor 2).
Title: VEGFR2 Pathway & NIR Imaging Workflow
The Scientist's Toolkit: Essential Research Reagents & Materials
Table 3: Key Research Reagent Solutions for NIR Imaging Benchmarks
| Item | Function & Rationale |
|---|---|
| IRDye 800CW NHS Ester | A bright, stable, water-soluble NIR fluorophore (peak ~789 nm) for covalent conjugation to antibodies, peptides, or other targeting moieties. The gold standard for sensitivity benchmarks. |
| Indocyanine Green (ICG) | An FDA-approved NIR dye (peak ~810 nm). Used for perfusion imaging and as a baseline for comparing novel fluorophores. Limited by non-specific binding and aggregation. |
| Intralipid 20% | A fat emulsion used to create tissue-simulating phantoms for calibration. It replicates the scattering properties of biological tissue (µs' ≈ 1 mm⁻¹ at 800 nm). |
| Matrigel | Basement membrane matrix. Used to create subcutaneous implants of fluorescent cells or to mix with fluorophores for controlled-release depth resolution phantoms in vivo. |
| PEGylated Liposomes (NIR-labeled) | Nanocarriers for enhanced permeability and retention (EPR) effect studies. Used to benchmark sensitivity to passively targeted agents in tumor models. |
| Mouse Anti-CD31 Antibody | Endothelial cell marker. Often used as a counterstain in ex vivo validation of in vivo NIR imaging data targeting vasculature. |
| Fluorescent Microspheres (NIR) | Polystyrene beads with encapsulated NIR dye. Used as point sources for in vivo resolution measurements due to their stable, non-diffusing signal. |
| Blocking Buffer (e.g., Li-Cor Odyssey) | Commercial buffer designed to reduce non-specific binding of NIR antibodies in ex vivo tissue staining, critical for validating specificity. |
Current state-of-the-art NIR imaging can realistically measure:
- Sensitivity: Low picomolar (10⁻¹² M) concentrations of bright fluorophores at superficial depths (< 1 cm). This sensitivity degrades exponentially with depth, requiring tomographic approaches for deeper targets.
- Resolution: Sub-millimeter surface resolution is achievable with planar systems, but resolves to 1-3 mm in tomographic mode for targets deeper than 1 cm. The fundamental limit is light diffusion.
The accurate interpretation of NIR data requires rigorous system calibration using the protocols outlined, an understanding of the underlying biological pathways, and the use of validated reagents from the scientific toolkit. These benchmarks define the feasible boundaries for quantifying biomarker expression, pharmacokinetics, and therapeutic efficacy in preclinical research.
Regulatory and Standardization Considerations for Clinical Translation
The clinical translation of NIR fluorescence imaging agents and devices represents a critical pathway from bench to bedside, demanding rigorous navigation of complex regulatory and standardization frameworks. Within the broader thesis on NIR fluorescence imaging principles and basic research, this section addresses the essential non-technical milestones that determine the success of translational efforts. The path to regulatory approval (e.g., from the FDA, EMA, or other national agencies) and widespread clinical adoption is predicated on generating robust, standardized, and reproducible data that unequivocally demonstrates safety and diagnostic or therapeutic efficacy.
Global Regulatory Pathways for Imaging Agents and Devices
Navigating regulatory approval requires understanding whether the NIR fluorescent compound is regulated as a drug (a fluorescent imaging agent), a device (the imaging system), or, most commonly, a combination product. The strategy is dictated by the primary mode of action.
Table 1: Primary Regulatory Pathways for NIR Fluorescence Components
| Component | US Regulatory Body | Key Regulation/Pathway | EU Regulatory Body | Key Regulation/Pathway | Core Requirement |
|---|---|---|---|---|---|
| Fluorescent Agent | FDA Center for Drug Evaluation and Research (CDER) | New Drug Application (NDA); Investigational New Drug (IND) | European Medicines Agency (EMA) | Marketing Authorization Application (MAA); Clinical Trial Application (CTA) | Proof of safety and efficacy for intended use. |
| Imaging Device | FDA Center for Devices and Radiological Health (CDRH) | Premarket Notification [510(k)], Premarket Approval (PMA), De Novo | Notified Bodies | Medical Device Regulation (MDR 2017/745) | Proof of safety and performance; quality management system (e.g., ISO 13485). |
| Combination Product | FDA Office of Combination Products (OCP) | Lead Center Assignment based on Primary Mode of Action | EMA or Notified Bodies | Defined under MDR or Medicinal Products Directive | Integrated review of drug and device components. |
Current trends emphasize the Clinical Evaluation of medical devices under MDR and the need for Clinical Outcome Assessments for drugs, moving beyond technical feasibility to demonstrable patient benefit.
Core Standardization Considerations for Translation
Standardization is the bedrock of reproducible science and credible regulatory submissions. For NIR fluorescence imaging, key areas include:
- Phantom Development & Instrument Validation: Use of standardized phantoms (e.g., with embedded fluorophores at known concentrations) to calibrate imaging systems, define limits of detection, and ensure inter-instrument reproducibility across clinical sites.
- Quantification & Metrology: Establishing traceable units for fluorescence signal (e.g., equivalent concentration of a reference fluorophore). Corrections for tissue optical properties (absorption, scattering) are critical for accurate quantification.
- Protocol Harmonization: Standardized operative and imaging protocols for specific clinical applications (e.g., lymphatic mapping, tumor resection) to enable multi-center trial data pooling.
- Agent Characterization: Comprehensive physicochemical characterization of the imaging agent (purity, stability, conjugation efficiency, fluorescence quantum yield in serum).
Table 2: Key ASTM/ISO Standards Relevant to NIR Fluorescence Imaging
| Standard Designation | Title | Scope & Relevance |
|---|---|---|
| ASTM E3022 - 18 | Standard Guide for Measurement of Emission Characteristics and Requirements for LED UV Lamps | Guides characterization of light sources, relevant for imaging system excitation. |
| ISO 80601-2-77 | Medical electrical equipment — Part 2-77: Particular requirements for the basic safety and essential performance of robotically assisted surgical equipment | Relevant for NIR imaging systems integrated into surgical robotic platforms. |
| ASTM F3298 - 18 | Standard Guide for Performing Fluorescence Microscopy of Nanoscale Optical Features | Principles for quantitative fluorescence microscopy, extendable to macroscopic imaging. |
| IEC 60601-1 | Medical electrical equipment — Part 1: General requirements for basic safety and essential performance | Foundational safety standard for all medical electrical equipment, including imaging devices. |
Experimental Protocols for Regulatory-Grade Validation
The following protocols are essential for generating data suitable for regulatory submission.
Protocol: System Characterization and Performance Validation
Objective: To quantitatively characterize the key performance parameters of a NIR fluorescence imaging system.
- Spatial Resolution: Image a USAF 1951 resolution target or a slanted-edge target. Calculate the Modulation Transfer Function (MTF) to determine the spatial resolution in both white light and NIR fluorescence channels.
- Sensitivity & Limit of Detection: Prepare a dilution series of a reference fluorophore (e.g., ICG or a targeted agent analog) in a tissue-simulating phantom (e.g., Intralipid solution). Image the phantom under standardized settings (exposure time, f-stop, laser power). Plot signal-to-noise ratio (SNR) vs. concentration. The limit of detection (LoD) is defined as the concentration yielding an SNR of 3.
- Quantitative Accuracy: Image a phantom containing fluorophore inclusions at known concentrations under varying depths of scattering material. Use the system’s built-in or off-line software to estimate concentration. Report the linearity (R²) and accuracy (% error) of the estimated vs. known concentrations.
- Photostability: Continuously illuminate a fluorescent sample at the maximum approved irradiance. Record the fluorescence intensity decay over time and report the half-life of the signal.
Protocol: Preclinical Biodistribution and Toxicology Study
Objective: To evaluate the absorption, distribution, metabolism, excretion (ADME), and toxicity of a novel NIR fluorescent agent.
- Study Design: Use relevant animal model(s) (e.g., rodent, swine). Include control groups (vehicle only) and multiple dose groups (no observed adverse effect level (NOAEL), mid, and high dose).
n ≥ 5animals per group per time point. - Administration & Imaging: Administer agent via intended clinical route (e.g., intravenous). Perform longitudinal NIR fluorescence imaging at defined time points (e.g., 5 min, 30 min, 1h, 4h, 24h, 7d) to track pharmacokinetics.
- Ex Vivo Analysis: At terminal time points, collect and weigh all major organs. Image organs ex vivo to quantify fluorescence signal. Calculate % injected dose per gram of tissue (%ID/g).
- Histopathological Assessment: Fix organs in formalin, process, and section. Perform H&E staining for standard pathology. Perform fluorescence microscopy on unstained sections to correlate signal with tissue morphology.
- Clinical Pathology: Collect blood at predefined intervals for comprehensive hematology and clinical chemistry panels to assess organ function and systemic toxicity.
Visualization of Key Pathways and Workflows
Regulatory Pathway for a Fluorescent Agent
Chain of Measurement for NIR Fluorescence
The Scientist's Toolkit: Essential Research Reagents & Materials
Table 3: Key Research Reagent Solutions for Translational NIR Studies
| Item/Category | Function & Relevance | Example/Notes |
|---|---|---|
| Reference Fluorophores | Calibration standard for instrument performance and quantitative accuracy. | Indocyanine Green (ICG), IRDye 800CW. Must be of pharmaceutical/analytical grade. |
| Tissue-Simulating Phantoms | To validate imaging performance in a controlled, reproducible environment that mimics tissue. | Solid phantoms with TiO₂ (scatterer) and ink (absorber). Liquid phantoms using Intralipid. |
| Targeted NIR Probes | Research-grade agents for proof-of-concept biodistribution and efficacy studies. | Antibody-, peptide-, or small molecule-conjugated NIR dyes (e.g., Cy5.5, Alexa Fluor 750). |
| GMP-Compliant Excipients | For formulating investigational agents under Good Manufacturing Practice (GMP)-like conditions. | USP-grade PBS, amino acids (e.g., histidine), stabilizers (e.g., ascorbic acid). |
| Validated Assay Kits | To assess agent stability, conjugation efficiency, and impurity profiles. | HPLC systems with fluorescence detectors, size-exclusion columns, endotoxin detection kits. |
| In Vivo Imaging Systems | Preclinical systems for longitudinal biodistribution and efficacy studies. | PerkinElmer IVIS, LI-COR Pearl, Medtronic FLARE or similar systems with quantitation software. |
| Clinical Imaging System | The device intended for human use, requiring full validation and quality management. | PDE/SPY systems, Quest/ARTEMIS, or custom-built systems under design controls (ISO 13485). |
Conclusion
NIR fluorescence imaging is a rapidly evolving field that bridges fundamental optical principles with critical biomedical applications. From understanding the foundational advantage of the NIR window to implementing robust methodological protocols, researchers can leverage this technology for deep-tissue visualization. Effective troubleshooting ensures data integrity, while rigorous validation establishes its quantitative power alongside established modalities. The future points toward smarter, more targeted NIR probes, integration with multimodal imaging platforms, and expanded clinical adoption for real-time surgical and diagnostic guidance. For drug developers and scientists, mastering these principles is key to unlocking non-invasive, high-resolution insights into biological processes and therapeutic efficacy.