NIR-II Imaging Window 1000-1700 nm: The Complete Guide for Biomedical Research and Drug Development
This article provides a comprehensive examination of the Second Near-Infrared (NIR-II, 1000-1700 nm) imaging window, a transformative modality for in vivo biological research.
NIR-II Imaging Window 1000-1700 nm: The Complete Guide for Biomedical Research and Drug Development
Abstract
This article provides a comprehensive examination of the Second Near-Infrared (NIR-II, 1000-1700 nm) imaging window, a transformative modality for in vivo biological research. Tailored for researchers and drug development professionals, the content systematically covers the fundamental photophysical principles underpinning the NIR-II window's superiority in penetration depth, resolution, and signal-to-background ratio. It details the latest methodologies for probe development and imaging instrumentation, explores common experimental challenges with optimization strategies, and offers a critical validation framework comparing NIR-II to traditional NIR-I and visible-light imaging. The synthesis aims to empower scientists to effectively implement and advance NIR-II imaging in preclinical studies and translational applications.
What is the NIR-II Window? Unpacking the Photophysical Principles (1000-1700 nm)
1. Introduction
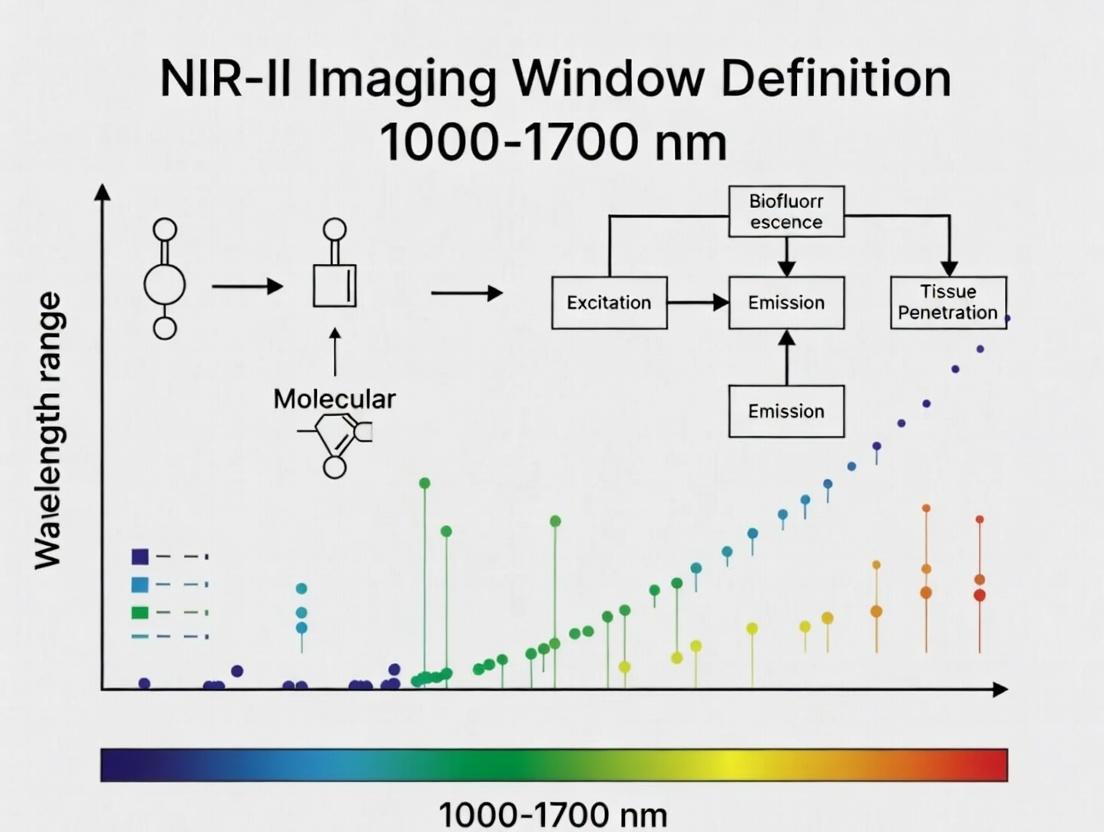
Near-infrared (NIR) fluorescence imaging has revolutionized biomedical research by enabling non-invasive visualization of biological structures and processes deep within living tissue. The definition of imaging windows is based on the attenuation of light in biological tissue, primarily due to absorption (by water, hemoglobin, lipids) and scattering. The progression from the first NIR window (NIR-I) to the second (NIR-II, 1000-1700 nm) and its sub-windows represents a concerted effort to minimize these attenuating factors. This guide, framed within the broader thesis of defining the 1000-1700 nm NIR-II window, details the spectral regions, their physical basis, and the experimental methodologies driving this frontier of optical imaging.
2. Defining the Imaging Windows
The classification is based on the dramatic reduction in scattering (∝ λ^-α, with α typically between 0.2 and 4 for biological tissue) and the presence of low-absorption valleys between water absorption peaks.
Table 1: Definition and Characteristics of NIR Imaging Windows
| Window | Wavelength Range (nm) | Primary Attenuation Factors | Key Advantages |
|---|---|---|---|
| NIR-I | 700 - 900 | Hemoglobin absorption, tissue scattering | Established dyes (e.g., ICG), first clinical translation. |
| NIR-II | 1000 - 1700 | Water absorption, reduced scattering | Significantly reduced scattering, deeper penetration, higher resolution. |
| NIR-IIa | 1300 - 1400 | Local water absorption peak | Often defined to exclude the ~1380 nm water peak; used for high-fidelity imaging with specific lasers/detectors. |
| NIR-IIb | 1500 - 1700 | Higher water absorption, very low scattering | Minimal scattering, exceptional clarity for vasculature imaging, requires sensitive detectors (e.g., InGaAs). |
3. Experimental Protocols for NIR-II Imaging
3.1. In Vivo NIR-II Fluorescence Angiography Protocol
- Objective: To visualize the vascular system in a living mouse model.
- Materials:
- Animal model (e.g., nude mouse).
- NIR-II fluorophore (e.g., PEGylated single-walled carbon nanotubes [SWCNTs], Ag₂S quantum dots, or organic dye IR-1061).
- NIR-II imaging system (see Toolkit).
- Anesthesia system (isoflurane).
- Procedure:
- Prepare Fluorophore: Dilute stock solution in PBS (e.g., 200 µL at ~100 µM for SWCNTs).
- Anesthetize Mouse: Induce and maintain anesthesia with 2% and 1.5% isoflurane, respectively.
- Administration: Inject 100-200 µL of fluorophore solution via tail vein.
- Image Acquisition: Place mouse prone on a heated stage. Use a 1064 nm laser (or relevant excitation) at a power density of ~100 mW/cm². Acquire video-rate images using a 2D InGaAs array with a 1100 nm long-pass or 1300/1500 nm band-pass filter.
- Data Analysis: Calculate signal-to-background ratio (SBR) and full-width at half-maximum (FWHM) of intensity profiles across blood vessels.
3.2. Quantum Yield Measurement Protocol for NIR-II Fluorophores
- Objective: To determine the fluorescence quantum yield (QY) relative to a standard.
- Materials:
- Test fluorophore in solvent (e.g., IR-26 in dichloroethane for ~1550 nm emission).
- Standard fluorophore with known QY in the target region (e.g., IR-26, QY=0.5% @ 1550 nm).
- Spectrofluorometer equipped with NIR detectors (e.g., integrating sphere with InGaAs).
- Procedure:
- Match Absorbance: Prepare solutions of the standard and the sample with identical absorbance (A<0.05) at the excitation wavelength (e.g., 808 nm).
- Measure Emission Spectra: Using an integrating sphere, collect the corrected, integrated fluorescence emission spectra (I) from 1000-1700 nm for both samples.
- Calculate QY: Apply the formula: QYsample = QYstandard * (Isample / Istandard) * (nsample² / nstandard²), where n is the refractive index of the solvent.
4. The Scientist's Toolkit: Research Reagent Solutions
Table 2: Essential Materials for NIR-II Imaging Research
| Item | Function & Example |
|---|---|
| NIR-II Fluorophores | Organic Dyes (e.g., CH-4T): Small molecule emitters; tunable synthesis. Quantum Dots (e.g., Ag₂S, PbS/CdS): Bright, size-tunable emission; may contain heavy metals. Single-Walled Carbon Nanotubes (SWCNTs): Photostable, emitting in NIR-IIb; require surface functionalization for biocompatibility. Lanthanide Nanoparticles: Long lifetime, potential for time-gated imaging. |
| Excitation Source | Continuous Wave (CW) Lasers: 808 nm, 980 nm, 1064 nm diode lasers; common for angiography. Pulsed Lasers: Ti:Sapphire (tunable) or OPO systems; essential for lifetime or phosphorescence imaging. |
| Detection System | 2D InGaAs Array Camera: Standard for real-time NIR-II imaging (900-1700 nm). Cooled Linear InGaAs Array: For spectroscopy. PMT/APD with InGaAs/Extended InGaAs Cathode: For high-sensitivity, single-point or scanning detection in NIR-IIb. |
| Optical Filters | Long-Pass (LP) Filters: 1000 nm, 1200 nm, 1500 nm LP to block excitation/autofluorescence. Band-Pass (BP) Filters: e.g., 1000/40, 1550/50 nm to isolate specific sub-windows (NIR-IIa/b). |
5. Visualization of Pathways and Workflows
NIR-II Imaging Workflow from Injection to Detection
Spectral Windows and Their Dominant Attenuation Characteristics
Within the field of biomedical optical imaging, the definition of the second near-infrared window (NIR-II, 1000-1700 nm) represents a pivotal advancement. This spectral region offers significantly reduced scattering and minimal absorption by endogenous chromophores compared to the traditional first NIR window (NIR-I, 650-950 nm), enabling deeper tissue penetration, higher spatial resolution, and superior signal-to-background ratios. This whitepaper details the fundamental optical principles, provides quantitative comparisons, and outlines experimental protocols central to NIR-II research.
Fundamental Optical Principles in Biological Tissue
2.1 Light-Tissue Interaction The depth of light penetration in tissue is governed by the effective attenuation coefficient (μeff), which is a function of absorption (μa) and reduced scattering (μs') coefficients: μeff = √[3μa(μa + μs')]. Deeper penetration is achieved when both μa and μ_s' are minimized.
2.2 Scattering (μs') Light scattering in tissue is primarily caused by spatial variations in refractive index, most notably at cellular and subcellular structures. Scattering intensity follows an approximate power-law dependence on wavelength (λ): μs' ∝ λ^(-b), where the scattering power b is tissue-dependent (typically 0.2 to 4 for soft tissues). This inverse relationship means that longer wavelengths encounter less scattering.
2.3 Absorption (μ_a) Key endogenous absorbers in the NIR spectrum are water (H₂O), hemoglobin (Hb/HbO₂), and lipids. Their absorption profiles create distinct "optical windows" where absorption is locally minimized.
Table 1: Optical Properties of Key Tissue Chromophores Across Spectral Windows
| Chromophore | Peak Absorption Regions (nm) | Absorption in NIR-I (750-900 nm) | Absorption in NIR-II (1000-1700 nm) | Functional Impact |
|---|---|---|---|---|
| Hemoglobin (Oxy & Deoxy) | < 600 nm (Strong) | Moderate (Lower than visible) | Very Low (>1000 nm) | Minimized background, reduced blood vessel masking. |
| Water (H₂O) | ~980 nm, >1400 nm | Low at 750-900 nm | Local minima at ~1100 nm, rises after 1150 nm | Optimal window exists between 1100-1350 nm. |
| Lipids | ~930 nm, 1200 nm | Moderate peak at 930 nm | Varies; peak at 1200 nm | Consideration needed for adipose tissue. |
| Overall Tissue μ_a | - | Relatively Higher | Significantly Lower (in 1100-1350 nm) | Lower attenuation enables deeper photon penetration. |
| Reduced Scattering μ_s' | - | Higher (μ_s' ~ 10-20 cm⁻¹ at 800 nm)* | Lower (μ_s' ~ 5-10 cm⁻¹ at 1300 nm)* | Less photon diffusion, sharper imaging. |
*Representative values for soft tissue; exact values vary by tissue type.
Quantitative Comparison of Penetration Depth
The combined reduction in scattering and absorption in the NIR-II window directly translates to increased penetration depth and improved resolution.
Table 2: Comparative Performance Metrics: NIR-I vs. NIR-II Windows
| Parameter | NIR-I Window (e.g., 800 nm) | NIR-II Sub-windows | Experimental Basis |
|---|---|---|---|
| Penetration Depth | ~1-3 mm (high resolution) | > 5-10 mm possible | Measured in tissue phantoms & in vivo models. |
| Spatial Resolution | Degrades rapidly with depth due to scattering. | Sub-10 μm resolution maintained at several mm depth. | Modulation transfer function (MTF) measurement. |
| Signal-to-Background Ratio (SBR) | Limited by high scattering background. | 5-10x higher than NIR-I for same target. | In vivo imaging of vasculature with NIR-II fluorophores. |
| Tissue Autofluorescence | Significant from proteins (e.g., collagen). | Negligible beyond 1100 nm. | Spectral measurement of control tissues. |
Experimental Protocols for Validating NIR-II Advantage
4.1 Protocol: Measuring Tissue Optical Properties Objective: Quantify μa and μs' of tissue samples across 1000-1700 nm. Materials: Fourier Transform Infrared (FTIR) spectrometer with integrating sphere, Intralipid phantoms, fresh tissue slices (100-500 μm thick), NIR-II compatible substrates. Method:
- Prepare a series of Intralipid phantoms with known scattering coefficients for calibration.
- Mount tissue sample in the spectrometer's sample holder.
- Collect total transmission (Tt) and diffuse reflectance (Rd) spectra using the integrating sphere.
- Employ an inverse adding-doubling (IAD) algorithm to calculate μa(λ) and μs'(λ) from Tt(λ) and Rd(λ) measurements.
- Validate results against established values for tissue types (e.g., skin, brain, muscle).
4.2 Protocol: In Vivo NIR-IIb (1500-1700 nm) Vascular Imaging Objective: Demonstrate deep-tissue, high-resolution vascular imaging. Materials: NIR-IIb fluorescent probe (e.g., Ag₂S quantum dots, organic dye IR-1061), murine model, NIR-II InGaAs camera with 1500 nm long-pass filter, laser diode at 1064 nm or 1300 nm for excitation, anesthesia system. Method:
- Anesthetize the mouse and place it on a warming stage.
- Administer the NIR-IIb probe via tail vein injection (e.g., 200 μL, 100 μM).
- After 5-10 min circulation, excite the region of interest with the NIR laser at a safe power density (<100 mW/cm²).
- Acquire fluorescence images using the InGaAs camera with the long-pass filter to block excitation light.
- Capture images at multiple time points. Use software to analyze vessel width, contrast, and penetration depth. Compare with an NIR-I (800 nm channel) image from a separate experiment.
4.3 Protocol: Penetration Depth Measurement in Tissue-Mimicking Phantoms Objective: Objectively compare the penetration limit of NIR-I and NIR-II light. Materials: Agarose, Intralipid (scattering agent), India ink (absorption agent), NIR-I dye (e.g., ICG), NIR-II dye (e.g., IR-12), thin capillary tubes, NIR-I and NIR-II imaging systems. Method:
- Create a tissue-mimicking phantom with μa and μs' matching skin (~0.2 cm⁻¹ and ~10 cm⁻¹ at 800 nm, respectively).
- Fill capillary tubes with fluorescent dyes, one for each window.
- Embed tubes at progressively deeper depths (1-10 mm) in the phantom.
- Image the phantom from the top using respective excitation/emission filters for each window.
- Plot fluorescence intensity vs. depth for each spectral window to determine the depth at which the signal falls below the noise floor.
Visualization of Core Concepts
Title: How Longer Wavelength Reduces Attenuation for Deeper Penetration
Title: NIR-II In Vivo Vascular Imaging Workflow
The Scientist's Toolkit: Key Research Reagent Solutions
Table 3: Essential Materials for NIR-II Imaging Research
| Item | Function & Application | Example Product Types |
|---|---|---|
| NIR-II Fluorophores | Emit light in 1000-1700 nm window for labeling and contrast. | Inorganic: Ag₂S, PbS/CdS Quantum Dots. Organic: IR-12, IR-26, CH-4T dyes. Single-Walled Carbon Nanotubes (SWCNTs). |
| NIR-II Imaging System | Detects faint NIR-II emission. | Cooled InGaAs (Indium Gallium Arsenide) camera (900-1700 nm range). NIR-enhanced optics. |
| Excitation Sources | Provides NIR light to excite fluorophores. | Diode Lasers (808, 980, 1064, 1300 nm). Optical Parametric Oscillators (OPO) for tunability. |
| Spectral Filters | Isolates emission signal from excitation/background light. | Long-pass (LP), Short-pass (SP), and Band-pass (BP) filters optimized for NIR-II wavelengths. |
| Tissue-Mimicking Phantoms | Calibrates systems & quantifies performance in controlled media. | Agarose/Intralipid phantoms with India ink or NIR dyes. Commercial optical phantom kits. |
| Image Analysis Software | Quantifies signal, resolution, and penetration depth. | Fiji/ImageJ with NIR-II plugins, custom MATLAB/Python scripts for SBR and MTF analysis. |
The scientific foundation for the NIR-II window's superiority in deep-tissue optical imaging is robust, rooted in the fundamental wavelength-dependent decline of scattering and the strategic avoidance of water and hemoglobin absorption peaks. The experimental protocols and tools detailed herein provide a framework for researchers to validate and exploit this window, driving forward innovations in in vivo imaging, surgical guidance, and therapeutic monitoring within drug development and biomedical research. The 1000-1700 nm range, particularly the sub-windows like NIR-IIa (1300-1400 nm) and NIR-IIb (1500-1700 nm), represents the frontier for non-invasive optical interrogation of living systems at unprecedented depth and clarity.
The NIR-II imaging window (1000-1700 nm) represents a transformative advancement in biomedical optics. This technical guide details its three core advantages: significantly enhanced spatial resolution due to reduced scattering, superior signal-to-background ratio (SBR) from minimized tissue autofluorescence, and an increased maximum permissible exposure (MPE) enabling higher excitation power. Framed within ongoing research to define and exploit this spectral region, this document provides a quantitative analysis, standardized protocols, and essential resource guidelines for researchers and drug development professionals.
Biological tissue exhibits a unique optical landscape. While visible light (400-700 nm) is strongly absorbed by hemoglobin and pigments, and the traditional near-infrared region (NIR-I, 700-900 nm) still suffers from significant scattering and autofluorescence, the NIR-II window offers a pronounced improvement. The primary thesis driving current research posits that systematic exploitation of the 1000-1700 nm range can overcome fundamental limitations in in vivo imaging depth, clarity, and safety, directly impacting preclinical research and therapeutic monitoring.
Quantitative Analysis of Core Advantages
Enhanced Resolution
Reduced scattering of longer wavelengths within the NIR-II window allows photons to travel in more ballistic paths, preserving spatial information and yielding sharper images.
Table 1: Comparison of Resolution and Scattering Properties Across Spectral Windows
| Spectral Window | Wavelength Range (nm) | Reduced Scattering Coefficient (μs') in Muscle (cm⁻¹)* | Achievable Lateral Resolution (in tissue) | Typical Imaging Depth (mm) |
|---|---|---|---|---|
| Visible | 400-700 | 150-300 | >10 µm (highly superficial) | 0.5-1 |
| NIR-I | 700-900 | 80-150 | 15-25 µm | 1-3 |
| NIR-IIa | 1300-1400 | ~20-40 | 5-15 µm | 3-8 |
| NIR-IIb | 1500-1700 | <20 | <10 µm (theoretical) | >5 |
*Representative values; tissue-dependent. Data compiled from recent studies (2021-2023).
Signal-to-Background Ratio (SBR)
Background noise, primarily from tissue autofluorescence and scattered excitation light, plagues visible and NIR-I imaging. Both phenomena diminish drastically beyond 1000 nm.
Table 2: Signal-to-Background Ratio Metrics
| Parameter | NIR-I (800 nm) | NIR-II (1100 nm) | NIR-II (1500 nm) | Improvement Factor (vs NIR-I) |
|---|---|---|---|---|
| Tissue Autofluorescence | High | Very Low | Negligible | 10-100x reduction |
| Scattered Excitation Photons | High | Moderate | Very Low | 10-50x reduction |
| Typical Reported SBR in vivo | 3-10 | 20-100 | 50-200+ | 5x to 20x+ increase |
Maximum Permissible Exposure (MPE)
Laser safety standards (ANSI Z136.1) define MPE as the maximum power or energy density safe for skin exposure. MPE scales with wavelength due to decreasing photon energy and corneal/lens absorption.
Table 3: Maximum Permissible Exposure for Skin (Continuous Wave, 10s exposure)
| Wavelength (nm) | MPE (W/cm²) | Relative to 800 nm |
|---|---|---|
| 800 (NIR-I) | 0.4 | 1.0x (Baseline) |
| 1064 | 1.0 | 2.5x |
| 1300 | ~1.0 | 2.5x |
| 1550 | 1.0 | 2.5x |
Key Implication: The 2.5-fold higher MPE in the NIR-II window permits proportionally higher excitation laser power, which can be used to generate stronger emission signals from probes, further improving SBR and enabling faster imaging or deeper penetration.
Experimental Protocols for Validating NIR-II Advantages
Protocol 3.1: Measuring Resolution in Scattering Phantoms
Objective: Quantify point spread function (PSF) broadening in NIR-I vs. NIR-II. Materials: NIR-IIb imaging system (e.g., InGaAs camera, 1550 nm laser), NIR-I system (e.g., Si camera, 785 nm laser), scattering phantom (Intralipid or lipid emulsion in agarose), sub-resolution fluorescent bead (e.g., 1 µm Er-doped particle). Method:
- Prepare phantoms with reduced scattering coefficients (µs') of 5, 10, and 20 cm⁻¹.
- Embed a sparse layer of beads at a defined depth (e.g., 1 mm).
- Image the same bead cluster with both systems using identical objectives and field of view.
- Fit the intensity profile of individual beads to a 2D Gaussian function. The full width at half maximum (FWHM) is the measured resolution.
- Plot FWHM vs. µs' and depth for both spectral windows.
Protocol 3.2: Quantifying In Vivo Signal-to-Background Ratio
Objective: Compare SBR for a dual-emissive probe in a mouse model. Materials: NIR-I/NIR-II dual-emissive probe (e.g., Ag2S quantum dot), mouse model, dual-channel imaging system. Method:
- Administer probe intravenously to an anesthetized mouse.
- At peak circulation time, acquire co-registered images in NIR-I (e.g., 820 nm emission) and NIR-II (e.g., 1200 nm emission) channels with identical geometry and exposure.
- Define a region of interest (ROI) over a vessel (Signal) and an adjacent tissue area without large vessels (Background).
- Calculate SBR = (Mean Signal Intensity - Mean Background Intensity) / (Standard Deviation of Background).
- Calculate the SBR improvement ratio: SBR(NIR-II) / SBR(NIR-I).
Protocol 3.3: Verifying MPE-Limited Performance Gain
Objective: Demonstrate increased signal intensity at NIR-II MPE limits. Materials: Bright NIR-II fluorophore (e.g., CH1055 dye), tissue phantom, power-adjustable 808 nm and 1064 nm lasers, calibrated power meter. Method:
- Prepare a sample with a fixed concentration of fluorophore.
- For the 808 nm laser (NIR-I), set power density to its MPE of 0.4 W/cm². Acquire image and record mean signal intensity (I808MPE).
- For the 1064 nm laser (NIR-II), first set power density to 0.4 W/cm² and acquire image (I1064low). Then increase to the NIR-II MPE of 1.0 W/cm² and acquire image (I1064MPE).
- Compare I1064MPE to I808MPE. The theoretical maximum gain is 2.5x, modified by the fluorophore's relative absorption at the two wavelengths.
Visualization of Core Concepts and Workflows
Diagram Title: Logical Flow of NIR-II Imaging Advantages
Diagram Title: Experimental Protocol for SBR Quantification
The Scientist's Toolkit: Essential Research Reagents & Materials
Table 4: Key Research Reagent Solutions for NIR-II Imaging
| Item Name/Category | Example Product/Type | Function & Rationale |
|---|---|---|
| NIR-II Fluorophores | Ag2S/Ag2Se Quantum Dots, CH-series Dyes, Lanthanide-Doped Nanoparticles | Emit within the 1000-1700 nm window; high quantum yield in NIR-II is critical for bright signals. |
| Targeting Ligands | cRGD, Antibodies (e.g., anti-VEGF), Peptides | Conjugated to fluorophores for specific molecular targeting in disease models (e.g., tumors). |
| Biological Imaging Window | Custom cranial, dorsal skinfold, or abdominal chamber | Provides a stable, optically clear portal for high-resolution deep-tissue imaging in live animals. |
| Scattering Phantoms | Intralipid, India Ink, Polystyrene Beads in Agarose | Calibrated phantoms mimic tissue scattering (µs') and absorption (µa) to validate system performance. |
| NIR-IIb Filters | Long-pass filters >1500 nm (e.g., 1500 nm LP) | Isolate the NIR-IIb sub-window (1500-1700 nm) for ultra-low background imaging. |
| Anesthesia System | Isoflurane vaporizer with nose cone | Provides stable, long-duration anesthesia for in vivo imaging sessions, minimizing motion artifact. |
| Fluorescence Standards | IR-26 dye, Custom nanoshells | Stable reference materials for calibrating and comparing fluorescence intensity across systems and days. |
The coordinated advantages of the NIR-II window—enhanced resolution, superior SBR, and higher MPE—create a synergistic platform for unprecedented in vivo observation. As research continues to refine the definition and optimal sub-windows (e.g., NIR-IIa, IIb), and as probe chemistry evolves, these fundamental optical benefits will continue to drive discoveries in pathophysiology and drug development, enabling clearer, deeper, and more quantitative biological insights.
1. Introduction The definition of the second near-infrared window (NIR-II, 1000-1700 nm) as a superior regime for in vivo optical imaging is fundamentally grounded in the reduced scattering of light and, critically, the unique absorption profiles of endogenous chromophores. While the NIR-I window (700-900 nm) is characterized by a local minimum in hemoglobin absorption, the NIR-II window offers a more complex interplay between the absorptive contributions of water, lipids, and hemoglobin. This whitepaper provides a technical guide to the absorption properties of these key biological molecules within 1000-1700 nm, framing their significance within the context of advancing deep-tissue, high-contrast imaging for biomedical research and therapeutic development.
2. Quantitative Absorption Profiles of Key Chromophores The effective attenuation coefficient (μeff) in tissue across the NIR-II is dominantly influenced by the absorption coefficients (μa) of water, lipids, and hemoglobin derivatives. The following tables consolidate quantitative data from recent spectroscopic studies.
Table 1: Molar Absorption Coefficients (ε) of Hemoglobin Derivatives in NIR-II (Approximate Values at Key Wavelengths)
| Wavelength (nm) | Oxyhemoglobin (HbO₂) ε (M⁻¹cm⁻¹) | Deoxyhemoglobin (Hb) ε (M⁻¹cm⁻¹) | Methemoglobin (MetHb) ε (M⁻¹cm⁻¹) |
|---|---|---|---|
| 1000 | ~0.4 | ~0.6 | ~0.3 |
| 1100 | ~0.3 | ~0.4 | ~0.5 |
| 1200 | ~0.2 | ~0.3 | ~0.7 |
| 1300 | ~0.15 | ~0.25 | ~0.8 |
Table 2: Absorption Coefficients (μa) of Bulk Water and Adipose Tissue (Lipids) in NIR-II
| Wavelength (nm) | Water μa (cm⁻¹) | Adipose Tissue μa (cm⁻¹) | Notes |
|---|---|---|---|
| 1000 | ~0.14 | ~0.4 - 0.6 | Lipid absorption dominates. |
| 1200 | ~0.8 | ~0.7 - 1.0 | Absorption by both increases significantly. |
| 1300 | ~1.8 | ~1.0 - 1.5 | Strong water O-H bond overtone absorption. |
| 1450 | ~25.0 | ~5.0 - 7.0 | Major water absorption peak. |
| 1550 | ~12.0 | ~4.0 - 6.0 | Secondary water peak; used in OCT. |
| 1700 | ~60.0 | ~8.0 - 12.0 | Very strong water & lipid C-H bond absorption. |
3. Experimental Protocols for Chromophore Absorption Measurement 3.1 Protocol: Measuring Hemoglobin Absorption Spectra in NIR-II Objective: To obtain the molar extinction coefficients of HbO₂ and Hb in the 1000-1350 nm range. Materials: Hemoglobin from human blood, sodium dithionite, phosphate-buffered saline (PBS), gas-tight cuvettes, UV-Vis-NIR spectrophotometer. Procedure:
- Purify hemoglobin and prepare a 100 μM solution in PBS.
- For HbO₂: Oxygenate the solution by gently bubbling with O₂ for 10 minutes.
- For Hb: Deoxygenate an aliquot by adding a few grains of sodium dithionite and bubbling with N₂.
- Load each sample into a 1 mm pathlength, sealed cuvette.
- Acquire absorption spectra from 900-1350 nm using a calibrated NIR spectrometer. Correct for baseline scattering using a PBS reference.
- Calculate molar extinction coefficients (ε) using the Beer-Lambert law: A = ε * c * l.
3.2 Protocol: Determining Tissue-Simulating Phantom Absorption Objective: To characterize the combined effect of chromophores in a tissue-mimicking phantom. Materials: Intralipid (scattering agent), India ink (broadband absorber), distilled water, agarose powder, albumin or lipid emulsion. Procedure:
- Prepare a 1% agarose solution in boiling water.
- Cool to ~50°C and add Intralipid to achieve a reduced scattering coefficient μs' ~10 cm⁻¹ at 1064 nm.
- Add India ink serially to simulate baseline blood volume absorption.
- For lipid-rich phantom, add a lipid emulsion. For blood-rich phantom, add lysed blood or hemoglobin solution.
- Cast the phantom in slabs and measure diffuse reflectance/transmittance using a Fourier Transform NIR (FT-NIR) system coupled with an integrating sphere.
- Extract the absorption coefficient (μa) using an inverse adding-doubling algorithm.
4. Visualization of NIR-II Light-Tissue Interaction & Window Definition
Diagram Title: NIR-II Window Advantage from Scattering and Chromophore Profiles
5. The Scientist's Toolkit: Essential Research Reagent Solutions Table 3: Key Reagents and Materials for NIR-II Chromophore Studies
| Item | Function & Relevance |
|---|---|
| FT-NIR Spectrophotometer with Integrating Sphere | Essential for measuring diffuse reflectance/transmittance of turbid samples (tissue, phantoms) to extract accurate μa and μs' coefficients. |
| Sealed, NIR-Optimized Cuvettes (e.g., 1-10 mm pathlength) | For measuring pure chromophore solutions (hemoglobin, lipids, water) without atmospheric interference, especially critical for the 1400+ nm region. |
| Intralipid 20% Intravenous Fat Emulsion | A standardized scattering agent used to create tissue-mimicking phantoms with controllable reduced scattering coefficient (μs'). |
| Hemoglobin Lyophilized Powder (Human) | Provides a consistent source of hemoglobin for generating standard curves and preparing stable oxy/deoxy derivatives for spectroscopy. |
| Sodium Dithionite (Na₂S₂O₄) | A strong reducing agent used to quantitatively convert HbO₂ to deoxyhemoglobin (Hb) for differential absorption studies. |
| NIR-II Transparent Imaging Phantom Materials (e.g., PDMS, Agarose) | Hydrogel or polymer matrices for embedding chromophores and scatterers to validate imaging systems and reconstruction algorithms. |
| Lipid Emulsions (e.g., Soybean Oil Emulsions) | Used to simulate the absorption profile of adipose tissue in phantoms, critical for studying breast, brain, or abdominal imaging. |
6. Implications for NIR-II Imaging and Conclusion The absorption profiles delineated above define optimal sub-windows within the broader NIR-II. The region from 1000-1350 nm, often termed "NIR-IIa," benefits from a local minimum in water absorption while hemoglobin absorption continues to decrease. This window is ideal for high-resolution vascular and functional imaging. The region around 1500-1700 nm ("NIR-IIb") experiences higher water absorption but even lower scattering, potentially offering superior contrast for certain applications. Strategic selection of excitation or emission wavelengths within these sub-windows, guided by the chromophore absorption data, is paramount for optimizing signal-to-background ratio, penetration depth, and target specificity in biomedical imaging and drug development research.
Historical Context and Evolution of the NIR-II Imaging Paradigm
This whitepaper details the historical context and evolution of the second near-infrared window (NIR-II, 1000-1700 nm) imaging paradigm, framed within the broader thesis of defining this optical window for biomedical research. The shift from traditional NIR-I (700-900 nm) to NIR-II imaging represents a fundamental advancement in deep-tissue, high-resolution in vivo visualization, critical for researchers and drug development professionals.
Historical Progression of Imaging Windows
The Pre-NIR-II Era: Limitations of Visible and NIR-I Light
Biological imaging was historically confined to the visible spectrum (400-700 nm) and the first near-infrared window (NIR-I, 700-900 nm). While revolutionary, these techniques suffered from significant photon scattering and autofluorescence, limiting penetration depth and spatial resolution to ~1-3 mm.
The Conceptual Birth of NIR-II (c. 2009)
The paradigm was formally proposed by researchers recognizing that reduced scattering of light (( \propto \lambda^{-\alpha} ), with α~0.2-4 for biological tissue) and minimized autofluorescence in the 1000-1700 nm range could enable superior imaging. Seminal work by Weissleder et al. and Dai et al. around 2009-2010 demonstrated the first in vivo NIR-II imaging using single-walled carbon nanotubes.
Evolution of the Paradigm: Key Technological Drivers
The evolution is characterized by concurrent advancements in:
- Contrast Agent Development: From carbon nanotubes to organic dyes, quantum dots, and rare-earth nanoparticles.
- Detection Technology: Development of sensitive InGaAs cameras with reduced dark noise and cooled detectors for the 1000-1700 nm range.
- Optical Component Refinement: Availability of high-power NIR-II lasers, appropriate optical filters, and lenses.
Quantitative Comparison of Imaging Windows
Table 1: Quantitative Performance Metrics Across Imaging Windows
| Parameter | Visible (400-700 nm) | NIR-I (700-900 nm) | NIR-II (1000-1700 nm) | NIR-IIa (1300-1400 nm) | NIR-IIb (1500-1700 nm) |
|---|---|---|---|---|---|
| Tissue Penetration Depth | 0.5-1 mm | 1-3 mm | 3-8 mm | 5-10 mm | 3-7 mm |
| Spatial Resolution | Low (Diffraction-limited but scattering-dominated) | Moderate (~10-40 µm) | High (5-25 µm) | Very High (3-15 µm) | High (5-20 µm) |
| Scattering Coefficient (µs') | High (10-50 cm⁻¹) | Moderate (5-20 cm⁻¹) | Low (2-10 cm⁻¹) | Very Low (1-5 cm⁻¹) | Low (2-8 cm⁻¹) |
| Autofluorescence | Very High | High | Low | Very Low | Low |
| Signal-to-Background Ratio (SBR) | Low (< 5) | Moderate (5-20) | High (20-100) | Very High (50-200) | High (30-100) |
| Temporal Resolution | High | High | Moderate-High | Moderate | Moderate |
Table 2: Evolution of Key NIR-II Contrast Agent Classes
| Class | Representative Material | Peak Emission (nm) | Quantum Yield (%) | Year of Key Demonstration | Key Advancement |
|---|---|---|---|---|---|
| Carbon Nanomaterials | SWCNTs | 1000-1600 | <1 | 2009 | First in vivo NIR-II proof-of-concept |
| Quantum Dots | PbS/CdS QDs | 1200-1600 | 10-50 | 2011 | Bright, tunable emission |
| Lanthanide Nanoparticles | NaYF4: Nd³⁺ | ~1060, ~1330 | <1 | 2013 | Large Stokes shift, multiplexing capability |
| Organic Dyes | CH-4T, IR-FEP | 900-1100 | 5-15 | 2014, 2016 | Biodegradability, rapid clearance |
| Donor-Acceptor-Donor Dyes | IR-E1, FD-1080 | 1000-1400 | 5-20 | 2016, 2019 | High brightness, synthetic versatility |
| Semiconducting Polymers | pDA | ~1000-1300 | 5-10 | 2019 | High photostability, biocompatible design |
Core Experimental Protocols in NIR-II Research
Protocol: Synthesis of Ag₂S Quantum Dots (QD-based NIR-II Probe)
- Objective: To synthesize water-dispersible, biocompatible Ag₂S QDs emitting at ~1200 nm.
- Materials: Silver nitrate (AgNO₃), sulfur powder (S), 1-dodecanethiol (DDT), oleylamine, poly(maleic anhydride-alt-1-octadecene) (PMAO).
- Method:
- Reaction: Dissolve 0.1 mmol AgNO₃ in 4 mL oleylamine and 1 mL DDT under argon. Heat to 100°C.
- Sulfur Injection: Rapidly inject a solution of 0.05 mmol S in 1 mL oleylamine.
- Growth: Raise temperature to 150°C and maintain for 30 min. Cool to room temperature.
- Purification: Precipitate with ethanol, centrifuge (10,000 rpm, 10 min).
- Ligand Exchange: Redisperse pellet in chloroform. Add PMAO (10 mg/mL) and stir for 12 h for phase transfer to aqueous solution.
- Characterization: Confirm size (~5 nm) via TEM, emission via NIR-II spectrometer.
Protocol:In VivoNIR-II Imaging of Mouse Cerebral Vasculature
- Objective: To achieve high-resolution, real-time imaging of blood vessels through the intact skull.
- Animal Model: Anesthetized BALB/c mouse (IACUC approval required).
- Imaging System: 808 nm laser (50 mW/cm²), 1000 nm long-pass filter, cooled 2D InGaAs camera.
- Procedure:
- Tail Vein Injection: Administer 200 µL of NIR-II probe (e.g., IRDye 800CW derivative, ~1 mg/mL) via tail vein.
- Image Acquisition: Position mouse under laser illumination. Acquire time-series images at 5-10 frames per second for 10-30 minutes post-injection.
- Data Processing: Apply background subtraction (image prior to injection). Calculate signal-to-noise ratio (SNR) and full-width at half-maximum (FWHM) of vessel cross-sections.
- Key Metrics: Vessel resolution (FWHM < 20 µm), penetration depth (>3 mm), and temporal resolution for blood flow dynamics.
Protocol: NIR-II Fluorescence Molecular Tomography (FMT)
- Objective: For 3D quantification of fluorophore distribution in deep tissues.
- Setup: Multi-angle illumination/detection system with a rotational stage, spectral filters (1300 nm, 1500 nm bandpass).
- Workflow:
- Acquire 2D projection images at multiple angles (e.g., 0° to 360° in 10° steps).
- Reconstruct 3D fluorescence map using an inverse model (e.g., normalized born approximation, diffusion equation solvers).
- Coregister with anatomical data (e.g., MRI, CT) for hybrid imaging.
Diagrammatic Representations
Historical Drivers of the NIR-II Paradigm Shift
Core Workflow for In Vivo NIR-II Imaging
The Scientist's Toolkit: Key Research Reagent Solutions
Table 3: Essential Materials for NIR-II Imaging Research
| Item | Category | Function/Benefit | Example Vendor/Product |
|---|---|---|---|
| InGaAs Camera | Detection | Sensitive detection in 900-1700 nm range; essential for capturing NIR-II photons. | Teledyne Princeton Instruments (NIRvana), Hamamatsu (C15550-2012N) |
| NIR-II Laser Diodes | Excitation | Provides high-power, stable excitation at wavelengths (e.g., 808, 980, 1064 nm) optimal for probe excitation. | CNI Laser, Oxxius |
| Long-Pass & Band-Pass Filters | Optics | Blocks excitation and NIR-I light, allowing only NIR-II emission to reach the detector. | Thorlabs, Semrock (e.g., BLPs, FELH series) |
| SWCNTs (Raw Material) | Contrast Agent | First-generation NIR-II probe; used for fundamental scattering/absorption studies. | Sigma-Aldrich, NanoIntegris |
| PbS/CdS Core/Shell QDs | Contrast Agent | Bright, size-tunable NIR-II emitters for high-resolution vascular imaging. | NN-Labs, Ocean NanoTech |
| IRDye 800CW / Derivatives | Organic Dye | Commercially available, FDA-relevant dye for translational NIR-IIb imaging. | LI-COR Biosciences |
| CH-4T / FD-1080 Dyes | Organic Dye | High-performance small molecule dyes with emission >1000 nm. | Custom synthesis (literature protocols) |
| PEGylated Phospholipids | Surface Chemistry | For biocompatible coating and functionalization of nanoparticle probes. | Avanti Polar Lipids (DSPE-PEG) |
| Matrigel | In Vivo Model | For studying tumor microenvironment and angiogenesis in rodent models. | Corning |
| IVIS Spectrum CT | Integrated System | Commercial multimodal platform now offering NIR-II detection capabilities. | PerkinElmer |
Current Frontiers and Thesis Context
The evolution continues toward:
- Further Window Sub-Division: Exploiting the NIR-IIa (1300-1400 nm) and NIR-IIb (1500-1700 nm) for minimum scattering and water absorption, respectively.
- Multiplexed Imaging: Using probes with distinct, narrow emissions across 1000-1700 nm for simultaneous tracking of multiple biological targets.
- Clinical Translation: Developing targeted, excretable NIR-II probes for intraoperative guidance and endoscopic diagnosis.
This historical progression solidifies the NIR-II window (1000-1700 nm) not as a single entity, but as a spectrum of opportunities, each defined by a specific balance of scattering, absorption, and technological accessibility, driving the next generation of in vivo imaging.
Implementing NIR-II Imaging: Probes, Instrumentation, and Preclinical Applications
The second near-infrared (NIR-II) imaging window (1000-1700 nm) offers significant advantages over traditional NIR-I (700-900 nm) and visible-light imaging, including reduced photon scattering, minimal tissue autofluorescence, and deeper penetration depth. This whitepaper, framed within a broader thesis on advancing NIR-II biomedical imaging, provides an in-depth technical guide to the design, synthesis, and application of three principal probe classes: organic dyes, quantum dots (QDs), and single-walled carbon nanotubes (SWCNTs). The development of high-performance probes is critical for translating NIR-II imaging into clinical diagnostics, intraoperative guidance, and drug development.
Organic Dyes for NIR-II Imaging
Organic dye molecules are small-molecule fluorophores engineered to emit within the NIR-II window. Their core design revolves on donor-acceptor-donor (D-A-D) or acceptor-donor-acceptor (A-D-A) structures with strong electron push-pull systems to narrow the bandgap.
Core Molecular Engineering Strategies
- Extended π-Conjugation: Fusing polycyclic aromatic units or employing polymethine chains to shift absorption/emission bathochromically.
- Molecular Rigidification: Reducing vibrational and rotational energy loss via locked bonds or planar structures to enhance fluorescence quantum yield (QY).
- Side-Chain Functionalization: Introducing sulfonate, polyethylene glycol (PEG), or zwitterionic groups to improve aqueous solubility, pharmacokinetics, and target-specificity.
Key Experimental Protocol: Synthesis of a Representative D-A-D Dye (e.g., CH1055 derivative)
Objective: Synthesize a water-soluble, PEGylated D-A-D dye emitting at ~1055 nm. Materials: Benzobisthiadiazole (BBTD) core (acceptor), triphenylamine (TPA) donors, PEG-NH₂, anhydrous dimethylformamide (DMF), palladium catalysts (e.g., Pd(PPh₃)₄). Methodology:
- Suzuki-Miyaura Coupling: Under argon, couple halogenated BBTD core with boronic ester-functionalized TPA donors using Pd(PPh₃)₄ and K₂CO₃ in toluene/water at 90°C for 24h. Purify intermediate via silica gel chromatography.
- Post-Functionalization: React terminal aryl bromide on the donor unit with excess PEG-NH₂ (MW=2000) using a Pd-catalyzed amination in the presence of sodium tert-butoxide in toluene at 110°C for 48h.
- Purification & Characterization: Precipitate in diethyl ether, then purify via size-exclusion chromatography (Sephadex LH-20). Characterize by NMR, high-resolution mass spectrometry (HRMS), and HPLC. Measure absorption/emission spectra in phosphate-buffered saline (PBS) and determine QY relative to IR-26 (QY ~0.5% in 1,2-dichloroethane).
Organic Dye Synthesis and Characterization Workflow
Quantitative Comparison of Prominent NIR-II Organic Dyes
| Dye Name/Class | Core Structure | Peak Emission (nm) | Quantum Yield (QY) | Extinction Coefficient (M⁻¹cm⁻¹) | Key Functionalization | Primary Application |
|---|---|---|---|---|---|---|
| CH1055 | D-A-D (BBTD) | 1055 | ~0.3% (in PBS) | ~1.2 x 10⁴ | PEGylation | Dynamic vascular imaging |
| FDA-approved ICG | Polymethine | ~820 (NIR-I) / tail to 1000+ | <0.1% (NIR-II) | ~1.3 x 10⁵ | Sulfonate groups | Clinical liver/angiography |
| Rare-earth Chelates | Lanthanide (Yb³⁺) | ~980-1000 | Up to 10% (in D₂O) | ~0.1-1 x 10³ | Cryptate ligands | Time-gated imaging |
| Fluorophore-peptide | D-A-D conjugated | 1060-1100 | ~2-5% (in serum) | ~1-5 x 10⁴ | Targeting peptide (e.g., RGD) | Tumor-specific imaging |
Quantum Dots for NIR-II Imaging
NIR-II QDs are inorganic semiconductor nanoparticles with size-tunable emission. They typically offer high brightness and photostability but require careful engineering for biocompatibility.
Design Principles
- Core Composition: Ag₂S, Ag₂Se, PbS, InAs are common cores for NIR-II emission.
- Core-Shell Architecture: Growing a wider bandgap shell (e.g., ZnS) around the core to passivate surface defects and improve QY.
- Surface Ligand Engineering: Exchanging native hydrophobic ligands with hydrophilic polymers (e.g., PEG-dithiol, amphiphilic polymers) or silica coating for aqueous stability.
Key Experimental Protocol: Aqueous Phase Synthesis of Ag₂S QDs
Objective: Synthesize biocompatible Ag₂S QDs emitting at 1200 nm. Materials: Silver nitrate (AgNO₃), sodium sulfide (Na₂S), glutathione (GSH) as a ligand, ultrapure water. Methodology:
- Precursor Preparation: Dissolve 0.1 mmol AgNO₃ and 0.3 mmol GSH in 20 mL water under stirring to form Ag⁺-GSH complex. Adjust pH to 8.5 with NaOH.
- Nucleation & Growth: Rapidly inject 0.05 mmol Na₂S (in 2 mL water) into the stirred Ag⁺-GSH solution at room temperature. The color changes to brown/green.
- Reaction & Purification: Heat the reaction mixture to 60°C for 1 hour under argon to control growth and improve crystallinity. Let cool, then centrifuge at high speed (e.g., 40,000 rpm) to pellet QDs. Wash with ethanol/water mixtures 3 times to remove excess reactants. Redisperse in PBS.
- Characterization: Use transmission electron microscopy (TEM) for size (~3-5 nm), UV-Vis-NIR spectrophotometry for absorption onset, and NIR spectrophotometer with InGaAs detector for photoluminescence (PL) spectrum. Determine QY using a NIR-II dye standard.
Aqueous Synthesis of Ag₂S Quantum Dots
Single-Walled Carbon Nanotubes (SWCNTs)
SWCNTs are intrinsically fluorescent in the NIR-II region (1000-1700 nm) depending on their chirality (n,m). They are exceptionally photostable but require dispersion and functionalization for biological use.
Design and Functionalization
- Chirality Selection: Isolation of specific (n,m) species via density gradient ultracentrifugation (DGU) or aqueous two-phase extraction to achieve monochromatic emission.
- Surface Coating: Non-covalent wrapping with single-stranded DNA (ssDNA) or phospholipid-PEG (PL-PEG) to individualize and solubilize nanotubes while preserving optical properties.
- Targeting: Conjugation of antibodies, peptides, or small molecules to the surface coating via NHS-ester or click chemistry.
Key Experimental Protocol: ssDNA Wrapping and Chirality Sorting of SWCNTs
Objective: Prepare (6,5)-enriched SWCNTs suspended with (GT)₁₀ ssDNA. Materials: Raw HiPco SWCNTs, (GT)₁₀ ssDNA, sodium cholate, iodixanol (Optiprep), Tris-EDTA buffer, probe sonicator, ultracentrifuge. Methodology:
- Dispersion: Add 2 mg raw SWCNTs and 20 mg (GT)₁₀ ssDNA to 10 mL of 1% sodium cholate in TE buffer. Sonicate for 1 hour in an ice bath using a tip sonicator (5-10 W output). Centrifuge at 16,000 x g for 90 min to remove bundles and catalyst.
- Density Gradient Ultracentrifugation (DGU): Prepare a iodixanol gradient (e.g., 10% to 60%) in ultracentrifuge tubes. Layer the supernatant from step 1 on top. Ultracentrifuge at 250,000 x g for 24h at 4°C.
- Fraction Collection: Carefully collect colored bands from the gradient. The (6,5) chirality band (~1130 nm emission) typically appears at a specific density.
- Purification: Dialyze the collected fraction extensively against PBS to remove iodixanol and excess cholate. Characterize by absorption spectroscopy (identify (6,5) peaks at ~570 nm and 990 nm) and NIR PL spectroscopy.
Quantitative Comparison of NIR-II Probe Platforms
| Property | Organic Dyes | Quantum Dots (Ag₂S) | Single-Walled Carbon Nanotubes |
|---|---|---|---|
| Size Range | 1-2 nm | 3-10 nm | Length: 100-1000 nm; Diameter: 0.8-1.2 nm |
| Emission Range | 900-1300 nm | Tunable 900-1600 nm | 900-1700+ nm (Chirality-dependent) |
| Quantum Yield | Low to Moderate (0.1-10%) | Moderate to High (5-30% in water) | Moderate (0.1-3% for individualized) |
| Extinction Coefficient | Moderate (10⁴-10⁵) | High (10⁵-10⁶) | Very High (10⁶-10⁷ per cm) |
| Photostability | Moderate | High | Exceptionally High |
| Biodegradability | Typically Good | Poor (Potential heavy metal) | Poor (Persistence uncertain) |
| Synthetic Complexity | Moderate (Organic synthesis) | Moderate (Colloidal chemistry) | High (Separation & functionalization) |
| Primary Advantage | Rapid renal clearance, potential for clinical translation | High brightness, size-tunable emission | Ultra-broad, stable emission; deep tissue penetration |
The Scientist's Toolkit: Essential Research Reagent Solutions
| Reagent/Material | Function in NIR-II Probe Development | Example Vendor/Product |
|---|---|---|
| IR-26 Dye | Standard reference for determining NIR-II quantum yields in organic solvents. | Sigma-Aldrich (or custom synthesis) |
| Phospholipid-PEG (PL-PEG) | For non-covalent, biocompatible coating of QDs and SWCNTs; provides functional groups for bioconjugation. | Avanti Polar Lipids (e.g., DSPE-PEG2000-amine) |
| N-Hydroxysuccinimide (NHS) Ester | Common chemistry for conjugating targeting ligands (e.g., antibodies, peptides) to amine-functionalized probes. | Thermo Fisher Scientific (Sulfo-NHS esters) |
| Size-Exclusion Chromatography (SEC) Media (e.g., Sephadex, Sepharose) | Critical for purifying conjugated probes from excess, unreacted small molecules and dyes. | Cytiva (Sephadex G-25/G-50) |
| Iodixanol (Optiprep) | Medium for density gradient ultracentrifugation (DGU) to separate SWCNTs by chirality and diameter. | Sigma-Aldrich |
| InGaAs NIR Detector/CCD | Essential instrument for detecting and quantifying NIR-II fluorescence in vitro and in vivo. | Teledyne Princeton Instruments (NIRvana), Hamamatsu |
| Dichloroethane | Solvent for measuring reference quantum yields (e.g., for IR-26). | Sigma-Aldrich (anhydrous) |
| PEGylation Reagents (e.g., mPEG-NH₂, PEG-SH) | Improve hydrodynamic properties, blood circulation time, and reduce nonspecific binding of all probe types. | JenKem Technology, Creative PEGWorks |
Single-Channel vs. Spectral (Hyperspectral) NIR-II Imaging Systems
Within the rapidly evolving field of biomedical optics, the second near-infrared window (NIR-II, 1000-1700 nm) has emerged as a superior modality for deep-tissue, high-resolution in vivo imaging. This whitepaper provides an in-depth technical comparison of two principal imaging architectures utilized within this spectral band: single-channel (broadband) and spectral (hyperspectral) systems. The selection between these systems is fundamental to research outcomes in areas such as drug pharmacokinetics, receptor-targeted probe validation, and dynamic physiological process monitoring.
System Architectures & Operating Principles
Single-Channel NIR-II Imaging
This system employs a single, broadband detection channel. A laser (e.g., 808 nm, 980 nm, 1064 nm) excites fluorophores, and emitted NIR-II light is collected through a long-pass filter (e.g., >1000 nm, >1200 nm, >1500 nm) to block excitation and shorter wavelengths, before detection by a non-spectrally resolving two-dimensional array detector (InGaAs or HgCdTe camera).
Spectral (Hyperspectral) NIR-II Imaging
This system acquires a full spectrum for each pixel in the image. This is achieved via:
- Dispersion-based: Using a spectrograph and line-scanning to disperse light onto a 2D detector, building a spectral data cube (x, y, λ).
- Filter-based: Employing a tunable filter (e.g., liquid crystal tunable filter (LCTF), acousto-optic tunable filter (AOTF)) or a filter wheel with narrow-bandpass filters placed in front of the camera.
- Fourier-transform based: Using an interferometer to modulate spectral information, retrieving it via Fourier transform.
Quantitative Performance Comparison
Table 1: Key Performance Metrics of Single-Channel vs. Spectral NIR-II Systems
| Parameter | Single-Channel System | Spectral (Hyperspectral) System |
|---|---|---|
| Spectral Resolution | Broadband (100-300 nm FWHM) | 1-20 nm |
| Temporal Resolution | Very High (ms to seconds per frame) | Lower (seconds to minutes per data cube) |
| Data Complexity | Low (2D intensity matrix) | High (3D hyperspectral cube: x, y, λ) |
| Multiplexing Capability | None (except via sequential injection) | High (simultaneous multi-probe separation) |
| Quantitative Accuracy | Moderate (vulnerable to background/autofluorescence) | High (spectral unmixing improves specificity) |
| System Cost & Complexity | Lower | Significantly Higher |
| Primary Application | Real-time tracking, angiography, rapid dynamics | Spectral unmixing, biodistribution studies, probe identification |
Table 2: Representative In Vivo Performance Data (Theoretical/Reported Values)
| Imaging Task | Single-Channel (1200LP) | Hyperspectral (Spectral Unmixing) | Notes |
|---|---|---|---|
| Signal-to-Background Ratio (SBR) | 5-15 | Can improve SBR by 2-5x | Unmixing removes tissue autofluorescence. |
| Artery/Vein Contrast | ~1.5 | Can exceed 2.5 | Spectral separation of oxy/deoxy-hemoglobin. |
| Multiplexed Probe Separation | Not possible | 3-5 distinct probes | Limited by probe spectra and system sensitivity. |
| Tumor-to-Background Ratio | 3-8 | 5-15+ | Dependent on probe accumulation and clearance. |
Experimental Protocols
Protocol 1: In Vivo Single-Channel NIR-II Angiography
Objective: To visualize cardiovascular anatomy and blood flow dynamics in real-time.
- Animal Preparation: Anesthetize mouse (e.g., 1.5% isoflurane) and secure in supine position on a heating pad.
- Probe Administration: Intravenously inject 100-200 µL of ICG (1-5 mg/mL in saline) or PEGylated Ag2S quantum dots via tail vein.
- Imaging Setup: Use a 1064 nm laser for excitation (power density: ~100 mW/cm²). Equip InGaAs camera (cooled to -80°C) with a 1250 nm long-pass filter.
- Acquisition: Initiate continuous image acquisition (50-200 ms exposure per frame) just prior to injection. Record for 5-10 minutes.
- Analysis: Generate time-intensity curves from regions of interest (ROI) over major vessels to calculate flow metrics.
Protocol 2: Hyperspectral Unmixing for Multiplexed Drug Carrier Tracking
Objective: To spectrally resolve and quantify the biodistribution of two differently labeled drug carriers.
- Probe Synthesis: Prepare two carriers (e.g., liposomes, polymeric nanoparticles) labeled with distinct NIR-II fluorophores (e.g., Er-doped nanoparticle @ 1550 nm, CNT @ 1300 nm).
- System Calibration: Acquire reference spectra for each pure probe and autofluorescence from an untreated mouse in the same imaging geometry.
- In Vivo Acquisition: Co-inject both carriers intravenously. Using an LCTF-based system, acquire a full spectral data cube from 1100-1600 nm in 10 nm steps (50 ms/step, total ~5 sec/cube). Acquire cubes at multiple time points (e.g., 1, 4, 24 hours).
- Spectral Unmixing: Apply linear unmixing algorithm (e.g., non-negative matrix factorization) to each pixel's spectrum:
I_pixel(λ) = a*S_probe1(λ) + b*S_probe2(λ) + c*S_autofluorescence(λ). - Quantification: The coefficients (a, b) represent the abundance of each probe. Generate separate 2D maps and calculate organ-specific uptake.
Visualizing Workflows and Analysis
NIR-II Single-Channel Imaging Workflow
Hyperspectral NIR-II Imaging and Analysis Pipeline
The Scientist's Toolkit: Essential Research Reagents & Materials
Table 3: Key Reagents and Materials for NIR-II Imaging Research
| Item | Function/Description | Example/Catalog |
|---|---|---|
| NIR-II Fluorophores | Emit light within 1000-1700 nm; the core imaging agent. | Organic dyes (CH-4T), Quantum Dots (PbS, Ag2S), Single-Wall Carbon Nanotubes (SWCNTs), Rare-Earth Nanoparticles (Er, Nd-doped). |
| Targeting Ligands | Conjugated to fluorophores for specific molecular targeting. | Antibodies, Peptides (cRGD), Aptamers, Folate. |
| Biocompatible Coatings | Render probes stable, non-toxic, and stealthy in vivo. | PEG derivatives, DSPE-PEG, Bovine Serum Albumin (BSA). |
| Long-Pass Filters | Block excitation laser light in single-channel systems. | Semrock BLP01-1064R, Thorlabs FELH1000, FELH1200. |
| Tunable Filters | Enable wavelength selection in hyperspectral systems. | Meadowlark Optics LCTF (NIR), Brimrose AOTF. |
| InGaAs Cameras | Primary 2D sensor for NIR-II detection (900-1700 nm). | Princeton Instruments NIRvana, Hamamatsu C12741, Teledyne Lumenera SA-1.7. |
| Extended InGaAs Cameras | Detect into NIR-IIb (>1500 nm). | Sensors Unlimited (Collins) GA1280JS. |
| Cooling Systems | Reduce dark current noise in InGaAs detectors. | Liquid nitrogen pour-fill, Stirling cryocoolers. |
| Excitation Lasers | Provide NIR light to excite fluorophores. | 808 nm, 980 nm, 1064 nm diode or fiber lasers. |
| Phantom Materials | For system calibration and validation. | Intralipid (scattering), India ink (absorption), agarose gel. |
Within the broader thesis on defining the NIR-II (1000-1700 nm) imaging window, this technical guide details protocols for advanced in vivo imaging. The NIR-II window offers superior resolution and penetration depth compared to visible and NIR-I light, due to significantly reduced photon scattering and autofluorescence. This enables high-fidelity visualization of dynamic biological processes in living subjects.
Core NIR-II Imaging Principles
Tissue scattering decreases with increasing wavelength following an approximate λ^-α dependence (α ~0.2-1.4 for biological tissues). Absorption by hemoglobin, water, and lipids reaches local minima within the NIR-II sub-windows (e.g., NIR-IIa: 1300-1400 nm; NIR-IIb: 1500-1700 nm), enabling deeper photon penetration.
Table 1: Optical Properties of Biological Tissues Across Spectral Windows
| Spectral Band | Wavelength (nm) | Scattering Coefficient (μs') [cm⁻¹] | Penetration Depth in Brain Tissue | Key Absorbers |
|---|---|---|---|---|
| Visible | 400-700 | High (~20-50) | < 1 mm | Hemoglobin, Melanin |
| NIR-I | 700-900 | Moderate (~10-20) | 1-2 mm | Hemoglobin, Water (rising) |
| NIR-II | 1000-1350 | Low (~2-10) | 3-6 mm | Water (minima) |
| NIR-IIa/b | 1500-1700 | Very Low (~1-5) | 4-8 mm | Water (peak), Lipids |
Experimental Protocols
Protocol 1: NIR-II Tumor Angiography & Perfusion Mapping
Objective: Quantify tumor vascular architecture and blood perfusion kinetics. Materials: NIR-II fluorescence agent (e.g., IRDye 800CW, SWIR-emitting quantum dots, or single-walled carbon nanotubes (SWCNTs)), NIR-II imaging system (InGaAs or HgCdTe detector), murine xenograft model.
Procedure:
- Agent Administration: Tail vein inject 100-200 µL of NIR-II contrast agent (e.g., 5 nmol of IRDye 800CW in PBS).
- Dynamic Imaging: Initiate high-frame-rate imaging (5-10 fps) pre-injection. Continue for 15-20 minutes post-injection.
- Data Analysis: Generate time-intensity curves (TICs) for regions of interest (ROI: tumor core, periphery, normal tissue). Calculate perfusion parameters:
- Time-to-Peak (TTP)
- Peak Signal Intensity (PSI)
- Area Under the Curve (AUC) for initial 60s (represents relative blood volume/flow).
Table 2: Quantitative Perfusion Parameters from a Representative NIR-II Angiography Study
| Tissue Region | Time-to-Peak (TTP) [s] | Peak Signal Intensity (PSI) [a.u.] | AUC (0-60s) [a.u. * s] | Relative Vascular Density (%) |
|---|---|---|---|---|
| Tumor Core | 45.2 ± 6.7 | 2850 ± 320 | 125,400 ± 15,200 | 38.5 ± 4.1 |
| Tumor Periphery | 32.1 ± 4.3 | 4120 ± 480 | 168,900 ± 18,500 | 62.1 ± 5.8 |
| Contralateral Muscle | 25.5 ± 3.1 | 1550 ± 210 | 68,500 ± 8,300 | 12.4 ± 2.2 |
Diagram 1: NIR-II Tumor Angiography and Perfusion Analysis Workflow
Protocol 2: High-Speed Vascular Dynamics and Leakiness
Objective: Assess real-time blood flow velocity and vascular permeability (K^trans). Materials: High-frame-rate NIR-II system (>100 fps capability), bolus of small-molecule NIR-II dye (e.g., indocyanine green (ICG) for ~1000 nm).
Procedure:
- High-Speed Acquisition: Set imaging system to maximum frame rate (e.g., 150 fps) with short exposure.
- Bolus Injection: Rapidly inject 50 µL of high-concentration ICG (~100 µM) via catheterized vessel.
- Particle Tracking/Velocity Analysis: Use speckle imaging or track discrete dye "fronts" in capillaries. For permeability:
- Fit TIC post-bolus peak with extended Tofts model:
C_t(t) = K_trans ∫_0^t C_p(τ) e^(-k_ep (t-τ)) dτ - Where
C_tis tissue dye concentration,C_pis plasma concentration,k_epis reflux rate.
- Fit TIC post-bolus peak with extended Tofts model:
- Generate parametric maps of flow velocity and K^trans.
Protocol 3: Functional Brain Mapping via NIR-II Hemodynamic Imaging
Objective: Map cerebral blood volume (CBV) and oxygenation changes during stimulus. Materials: NIR-II imaging system with dual-wavelength capability (e.g., 1064 nm & 1300 nm), thinned-skull or cranial window mouse model.
Procedure:
- Baseline Imaging: Acquire co-registered images at λ1 (e.g., 1064 nm, oxy/deoxy-Hb sensitive) and λ2 (e.g., 1300 nm, isosbestic point).
- Stimulus Application: Apply controlled stimulus (e.g., whisker pad vibration, visual stimulus).
- Hemodynamic Calculation: Use the Modified Beer-Lambert Law for NIR-II. Changes in optical density (ΔOD) are related to concentration changes in oxy- (Δ[HbO]) and deoxy-hemoglobin (Δ[HbR]).
- Generate maps of Δ[HbO], Δ[HbR], and total Hb (ΔTHb) with high spatial-temporal resolution.
Table 3: Representative NIR-II Brain Mapping Data During Forepaw Stimulation
| Cortical Area | Δ[HbO] Peak (%) | Δ[HbR] Peak (%) | ΔTHb Peak (%) | Time to Δ[HbO] Peak (s) | Activation Area (mm²) |
|---|---|---|---|---|---|
| Primary Somatosensory | +8.5 ± 1.2 | -3.1 ± 0.7 | +5.4 ± 0.9 | 3.2 ± 0.4 | 1.45 ± 0.21 |
| Contralateral Region | +0.8 ± 0.5 | -0.3 ± 0.3 | +0.5 ± 0.4 | N/A | N/A |
Diagram 2: Neurovascular Coupling Pathway for NIR-II fMRI
The Scientist's Toolkit: Research Reagent Solutions
Table 4: Essential Materials for NIR-II In Vivo Imaging Protocols
| Item / Reagent | Category | Function & Key Notes |
|---|---|---|
| IRDye 800CW | Organic Fluorophore | FDA-approvable agent for angiography; emits ~800 nm but has tail emission into NIR-II for deep imaging. |
| PbS/CdS Quantum Dots | Nanomaterial | Tunable emission (1000-1600 nm); high brightness for vascular labeling and cellular tracking. |
| Single-Walled Carbon Nanotubes (SWCNTs) | Nanomaterial | Intrinsic NIR-IIb (1500-1700 nm) photoluminescence; used for ultra-deep brain angiography. |
| Indocyanine Green (ICG) | Small Molecule | Clinically approved dye; used for high-speed dynamic imaging in the ~1000 nm channel. |
| CH-4 T Dye | Organic Dye | New-generation small molecule with peak emission ~1100 nm; high quantum yield for functional imaging. |
| InGaAs Camera (Cooled) | Detector | Standard for 900-1700 nm detection; requires cooling for low noise in long exposures. |
| 2D InGaAs Array (HgCdTe extended) | Detector | Enables imaging in NIR-IIb (1500-1700 nm) for maximal penetration. |
| Dichroic Mirrors & Filters (1000-1700 nm) | Optics | Isolate NIR-II emission; critical for suppressing shorter wavelength autofluorescence. |
| Fiber-Coupled NIR Laser Diodes | Light Source | Provide uniform, wavelength-specific (e.g., 808 nm, 1064 nm) excitation for reflectance/fluorescence. |
| Stereotaxic Frame with NIR Window | Surgery/Immobilization | Enables stable, long-term cranial window imaging for longitudinal brain studies. |
The second near-infrared (NIR-II) window (1000-1700 nm) represents a significant advance in biomedical optical imaging. Within this spectral region, photon scattering and tissue autofluorescence are markedly reduced, enabling deeper tissue penetration and higher spatial resolution compared to the traditional NIR-I (700-900 nm) window. This whitepaper positions NIR-II imaging not as a standalone modality but as a synergistic component of a multimodal diagnostic and therapeutic platform. The integration of NIR-II with established clinical modalities—Positron Emission Tomography (PET), Magnetic Resonance Imaging (MRI), and Photoacoustic Imaging (PAI)—aims to overcome the inherent limitations of any single technique, providing complementary anatomical, functional, and molecular information for advanced research and drug development.
Core Principles of Integration
Successful multimodal integration hinges on the development of versatile contrast agents and coordinated data acquisition schemes.
- Dual/Multi-Modal Contrast Agents: The foundation of integration is the engineering of nanoplatforms that possess multiple reporting functionalities. These agents must be biocompatible and exhibit distinct signals for each modality (e.g., radioactive isotopes for PET, rare-earth elements for MRI, and NIR-II fluorescent dyes).
- Temporal and Spatial Co-Registration: For quantitative correlation of data, imaging sessions must be meticulously aligned in time (to track the same biological process) and space (to ensure the same region is being analyzed). This often involves fiduciary markers and specialized software algorithms.
- Information Complementarity: Each modality contributes unique data:
- NIR-II: High-resolution, real-time vascular and lymphatic imaging, intraoperative guidance.
- PET: Ultrasensitive, quantitative measurement of metabolic activity and biomarker expression.
- MRI: Excellent soft-tissue contrast and high-resolution anatomical information.
- PAI: Combines optical contrast with ultrasound resolution for hemodynamic and oxygen saturation mapping.
NIR-II/PET Integration
This combination merges the exceptional sensitivity and quantification of PET with the high spatial/temporal resolution and surgical utility of NIR-II imaging.
Mechanism: Agents are typically labeled with both a positron-emitting radionuclide (e.g., ⁶⁴Cu, ⁸⁹Zr, ¹⁸F) and a NIR-II fluorophore (e.g., IRDye800CW, CH1055, or rare-earth-doped nanoparticles). PET provides whole-body biodistribution and pharmacokinetic data, while NIR-II enables detailed visualization of target margins.
Experimental Protocol (Example: Tumor-Targeted Agent Validation):
- Synthesis: Conjugate a targeting moiety (e.g., antibody, peptide) to a NIR-II dye. Subsequently, radiolabel the conjugate with ⁶⁴Cu via a bifunctional chelator (e.g., DOTA).
- In Vitro Validation: Confirm binding affinity and specificity of the dual-labeled agent to target cells via flow cytometry (NIR-II channel) and gamma counting (PET isotope).
- In Vivo Imaging:
- Day 0: Inoculate mice with target-positive and target-negative xenograft tumors.
- Day 14: Inject ~100 µCi/100 µg of the dual-modal agent intravenously.
- PET Scan (24h p.i.): Acquire static or dynamic PET scans under anesthesia. Reconstruct data to obtain standardized uptake value (SUV) maps.
- NIR-II Imaging (24-48h p.i.): Image anesthetized mice using a NIR-II fluorescence system (λex = 808 nm, λem > 1000 nm with a long-pass filter). Acquire both 2D epi-fluorescence and 3D tomography data if available.
- Ex Vivo Analysis: Euthanize mice. Image and quantify fluorescence and radioactivity in excised tumors and major organs.
Data Presentation: Table 1: Quantitative Comparison of NIR-II/PET Agent Performance in a Murine Xenograft Model
| Metric | Target Tumor (Mean ± SD) | Control Tumor (Mean ± SD) | Key Organ (Liver) Uptake | Implication |
|---|---|---|---|---|
| PET SUVmax | 2.5 ± 0.3 | 0.8 ± 0.1 | 15.2 ± 2.1 %ID/g | Confirms specific targeting at the whole-body level. |
| NIR-II TBR | 8.2 ± 1.5 | 1.5 ± 0.4 | N/A | Provides high-contrast visualization for potential surgical guidance. |
| Blood Half-life (PET) | α: 1.2 h, β: 18.5 h | N/A | N/A | Informs dosing and optimal imaging window. |
| Correlation (R²) | 0.92 (Tumor SUV vs. NIR-II Flux) | N/A | N/A | Validates NIR-II signal as a surrogate for quantitative PET uptake. |
Diagram: NIR-II/PET Agent Workflow & Validation
The Scientist's Toolkit: NIR-II/PET Research
- Chelator-Labeled NIR-II Dyes (e.g., DOTA-IRDye800CW): Enables stable complexation of radiometals (⁶⁴Cu, ⁸⁹Zr) for PET labeling.
- Small Animal PET/CT or PET/MRI Scanner: For acquisition of quantitative, time-resolved biodistribution data.
- NIR-II Fluorescence Imager: Requires an InGaAs or cooled SWIR camera, 808 nm or 980 nm laser excitation, and appropriate long-pass emission filters (e.g., 1000 nm LP).
- Radiation Dosimetry Equipment: Essential for safe handling and quantification of radioactive materials.
NIR-II/MRI Integration
This pairing combines the unparalleled soft-tissue anatomical and functional detail of MRI with the dynamic, cellular-scale sensitivity of NIR-II.
Mechanism: Contrast agents incorporate both an MRI-active component (typically Gadolinium (Gd³⁺) for T1-weighted contrast or superparamagnetic iron oxide (SPIO) nanoparticles for T2-weighted contrast) and a NIR-II emitter. MRI provides detailed anatomical context and functional data (e.g., perfusion, diffusion), while NIR-II offers real-time tracking of cellular processes or surgical margins.
Experimental Protocol (Example: Lymph Node Mapping with a Trimodal Agent):
- Agent Preparation: Synthesize a nanoparticle (e.g., a liposome or silica shell) encapsulating Gd³⁺ chelates and co-loaded with a NIR-II dye (e.g., IR1061).
- Pre-Clinical Mapping:
- Anesthetize the animal and place in an MRI-compatible holder.
- Baseline MRI: Acquire high-resolution T1- and T2-weighted anatomical images.
- Injection: Inject 0.1 mmol Gd/kg of the agent intradermally into the paw.
- Dynamic NIR-II Imaging (0-60 min): Using an MRI-compatible optical setup if possible, image the draining lymphatic channel and axillary lymph node in real-time.
- Post-Injection MRI (60-90 min): Acquire post-contrast T1-weighted scans. Use contrast enhancement to identify the sentinel lymph node.
- Surgical Guidance Simulation: Use the real-time NIR-II fluorescence signal to guide a simulated surgical incision and excision of the identified lymph node.
Data Presentation: Table 2: Performance Metrics of a NIR-II/MRI Nanoprobe for Lymph Node Mapping
| Imaging Modality | Key Parameter Measured | Value/Outcome | Advantage Contributed |
|---|---|---|---|
| MRI (T1-Weighted) | Signal Enhancement (%) in SLN | +220% ± 35% | Pre-operative anatomical localization of SLN within tissue context. |
| NIR-II Fluorescence | Time-to-Detect Lymphatic Channel | 45 ± 12 sec | Real-time, high-frame-rate visualization of lymphatic flow. |
| NIR-II Fluorescence | Tumor-to-Background Ratio (TBR) in SLN | 12.5 ± 2.8 | High sensitivity for intraoperative margin delineation. |
| Correlative Analysis | Spatial Co-localization (MRI vs. NIR-II) | Dice Coefficient > 0.85 | Validates accuracy of NIR-II guidance against anatomical gold-standard (MRI). |
Diagram: Complementary Information Flow in NIR-II/MRI
NIR-II/Photoacoustic Imaging Integration
PAI naturally complements NIR-II fluorescence, as both rely on optical excitation but differ in detection. PAI detects ultrasound waves generated by thermoelastic expansion, offering scalable resolution and depth.
Mechanism: A single contrast agent (e.g., a semiconducting polymer nanoparticle or single-walled carbon nanotube) with strong absorption in the NIR-II window can serve both modalities. It generates both fluorescence emission (for NIR-II) and a strong photoacoustic signal. Alternatively, two spectrally distinct agents can be used for multiplexed imaging.
Experimental Protocol (Example: Multiplexed Imaging of Tumor Vasculature and Hypoxia):
- Agent Preparation: Utilize two agents: (A) a purely absorbing agent like gold nanorods (peak ~1064 nm) for PAI of vasculature, and (B) a fluorescent/photoacoustic agent like an oxygen-sensitive NIR-II dye for hypoxia sensing.
- Multispectral PAI & NIR-II Imaging:
- Anesthetize and position a tumor-bearing mouse on a heated stage.
- Multispectral PAI Scan: Illuminate the tumor with pulsed lasers at 1064 nm and the dye's excitation wavelength (e.g., 808 nm). Acquire ultrasound data to reconstruct maps of absorber concentration for each wavelength.
- NIR-II Fluorescence Scan: Immediately after, using continuous-wave 808 nm excitation, acquire NIR-II fluorescence images through a 1000 nm long-pass filter.
- Oxygen Challenge: Subject the animal to alternating cycles of pure oxygen and air while repeating scans to monitor dynamic changes in the hypoxia-sensitive signal.
- Data Analysis: Use spectral unmixing on the PAI data to separate the vascular (Agent A) and hypoxic (Agent B) signals. Co-register with the high-resolution NIR-II fluorescence vasculature image.
Data Presentation: Table 3: Comparison of NIR-II Fluorescence and PAI Signals from a Hypoxia Probe
| Parameter | NIR-II Fluorescence Signal | Photoacoustic Signal | Integrated Advantage |
|---|---|---|---|
| Spatial Resolution | ~20-50 µm (superficial) | ~100-200 µm (scales with depth) | NIR-II refines PAI details at depth. |
| Penetration Depth | 3-8 mm (in tissue) | 4-7 cm (in tissue) | PAI provides deeper initial mapping. |
| Quantification Type | Relative intensity (affected by scattering/absorption) | More linear with absorber concentration | PAI offers better quantification of probe concentration. |
| Temporal Resolution | Very High (ms scale) | Moderate (limited by laser rep. rate & scanning) | NIR-II captures fast dynamics. |
| Primary Readout | Probe localization & expression dynamics | Oxygen saturation (sO₂) mapping via spectral unmixing | Combined readout: Where is the probe (NIR-II) and what is the local sO₂ (PAI)? |
Diagram: NIR-II/PAI Multiplexed Imaging Workflow
The Scientist's Toolkit: NIR-II/PAI Research
- Multispectral PAI System: Requires tunable pulsed OPO lasers covering the NIR-II window (e.g., 1064 nm) and a high-frequency ultrasound transducer array.
- NIR-II Absorbing/Fluorescent Agents: Semiconducting polymer nanoparticles (SPNs), single-walled carbon nanotubes (SWCNTs), or cyanine dyes with extended absorption.
- Spectral Unmixing Software: Essential for decomposing signals from multiple absorbing chromophores within PAI data (e.g., using linear regression or independent component analysis).
The strategic integration of NIR-II imaging with PET, MRI, and PAI creates a powerful paradigm that transcends the capabilities of any single imaging modality. For researchers and drug development professionals, this approach provides a comprehensive toolkit: from whole-body screening (PET) and anatomical mapping (MRI) to dynamic cellular tracking and intraoperative guidance (NIR-II/PAI). The future of this field lies in the development of increasingly sophisticated "smart" multi-modal agents, the miniaturization of integrated hardware (e.g., combined NIR-II/ultrasound probes), and the advancement of artificial intelligence-driven platforms for automated image fusion and analysis. By defining and leveraging the NIR-II window within these multimodal frameworks, we pave the way for more precise diagnosis, targeted therapy, and accelerated translation of biomedical discoveries.
The development of novel therapeutics requires precise tools to monitor their journey in vivo. This whitepaper details critical case studies in drug development, focusing on methodologies for assessing biodistribution, pharmacokinetics (PK), and therapy response. The entire discussion is framed within the transformative context of the second near-infrared window (NIR-II, 1000-1700 nm) imaging. NIR-II fluorescence imaging offers superior penetration depth, high spatial resolution, and minimized tissue autofluorescence compared to traditional NIR-I (700-900 nm) or visible light imaging. This technological leap is redefining preclinical and translational research by enabling quantitative, real-time, and non-invasive visualization of drug candidates, their targets, and therapeutic effects in deep tissue.
Core Principles and NIR-II Advantage
Biodistribution refers to the pattern of a drug's spread throughout the body over time. Pharmacokinetics describes the quantitative time course of Absorption, Distribution, Metabolism, and Excretion (ADME). Therapy Monitoring involves assessing pharmacodynamic (PD) effects and treatment efficacy.
The NIR-II window provides distinct advantages for these studies:
- Reduced Scattering: Longer wavelengths scatter less, yielding sharper images.
- Minimal Autofluorescence: Biological tissues have low intrinsic fluorescence in this range, dramatically improving signal-to-noise ratios (SNR).
- Deep Tissue Penetration: Enables visualization up to several centimeters deep, facilitating whole-body imaging in small animals.
Case Studies and Quantitative Data
Case Study 1: NIR-II-Labeled Antibody-Drug Conjugate (ADC) Biodistribution
A study evaluated a HER2-targeting ADC labeled with a carbon nanotube-based NIR-II fluorophore (emission ~1300 nm) in a murine breast cancer model.
Table 1: Quantitative Biodistribution Data of NIR-II-ADC vs. Non-Targeted Control
| Time Point (h post-injection) | Tumor Uptake (ADC) (%ID/g) | Tumor Uptake (Control) (%ID/g) | Liver (ADC) (%ID/g) | Muscle (ADC) (%ID/g) | Tumor-to-Background Ratio (TBR) |
|---|---|---|---|---|---|
| 6 | 5.2 ± 0.8 | 1.5 ± 0.3 | 12.5 ± 1.2 | 0.9 ± 0.2 | 5.8 |
| 24 | 8.7 ± 1.1 | 1.1 ± 0.2 | 15.3 ± 2.1 | 0.5 ± 0.1 | 17.4 |
| 48 | 6.1 ± 0.9 | 0.8 ± 0.1 | 10.8 ± 1.5 | 0.3 ± 0.1 | 20.3 |
%ID/g = Percentage of Injected Dose per gram of tissue; TBR = Tumor Signal / Muscle Signal.
Experimental Protocol:
- Animal Model: Establish subcutaneous HER2+ tumor xenografts in nude mice.
- Probe Administration: Inject 200 µL of NIR-II-ADC or control conjugate via tail vein (2 nmol fluorophore dose).
- NIR-II Imaging: Anesthetize mice and image at 1, 6, 24, 48, and 72 hours post-injection using a NIR-II imaging system (e.g., 1064 nm excitation, 1300 nm long-pass emission filter).
- Ex Vivo Validation: Euthanize mice at terminal time points, collect organs/tumors, and image ex vivo for quantitative %ID/g calculation using calibration curves.
- Data Analysis: Use region-of-interest (ROI) analysis to quantify fluorescence intensity.
Case Study 2: Pharmacokinetic Profiling of a NIR-II-Labeled Small Molecule Inhibitor
A tyrosine kinase inhibitor (TKI) was conjugated to an organic dye (CH1055) for PK analysis.
Table 2: Key Pharmacokinetic Parameters from NIR-II Imaging
| Parameter | Value (Mean ± SD) | Unit | Description |
|---|---|---|---|
| Cmax (Imaged) | 45.2 ± 6.7 | µg/mL Eq. | Maximum plasma concentration (from blood ROI). |
| Tmax | 0.5 | h | Time to reach Cmax. |
| t1/2 (α) | 1.2 ± 0.3 | h | Distribution half-life. |
| t1/2 (β) | 8.5 ± 1.4 | h | Elimination half-life. |
| AUC0-24h | 285 ± 32 | µg·h/mL Eq. | Area under the concentration-time curve. |
| Clearance (CL) | 0.12 ± 0.02 | L/h/kg | Volume of plasma cleared per unit time. |
| Volume of Distribution (Vd) | 1.5 ± 0.3 | L/kg | Apparent volume into which the drug distributes. |
Experimental Protocol:
- Dynamic Imaging: Following IV injection, acquire sequential NIR-II images of the same mouse every 30 seconds for 10 minutes, then at decreasing frequency up to 24 hours.
- ROI Definition: Define ROIs over the heart (for arterial blood pool), tumor, liver, and kidney.
- PK Modeling: Plot fluorescence intensity vs. time for the blood pool ROI. Convert intensity to concentration using an ex vivo plasma calibration standard curve. Fit data using non-compartmental analysis (NCA) or a two-compartmental model with specialized software (e.g., Phoenix WinNonlin).
- Parameter Calculation: Derive standard PK parameters (Cmax, Tmax, AUC, t1/2, CL, Vd) from the fitted curve.
Case Study 3: Therapy Monitoring of a PD-1 Checkpoint Inhibitor
An NIR-II reporter nanoparticle sensitive to granzyme B activity was used to monitor T-cell activation in response to anti-PD-1 therapy.
Table 3: Therapy Response Metrics Pre- and Post-Treatment
| Metric | Pre-Treatment (Day 0) | Post-Treatment (Day 7) | Change (%) |
|---|---|---|---|
| Tumor Volume (mm³) | 85 ± 12 | 45 ± 8 | -47% |
| NIR-II Signal (Tumor ROI) | 1050 ± 150 A.U. | 4250 ± 620 A.U. | +305% |
| Signal in Control Tumor | 1100 ± 200 A.U. | 1250 ± 180 A.U. | +14% |
| Correlative CD8+ T-cell Count (IHC) | 12 ± 3 cells/FOV | 58 ± 10 cells/FOV | +383% |
Experimental Protocol:
- Therapy Model: Mice with bilateral tumors receive anti-PD-1 antibody in one tumor (treated) and isotype control in the contralateral tumor (internal control).
- Reporter Administration: Inject the activatable NIR-II reporter probe 24 hours before each imaging session.
- Longitudinal Imaging: Perform NIR-II imaging pre-treatment and at days 3, 7, and 10 post-treatment initiation. Maintain consistent anesthesia and positioning.
- Image Co-registration: Use software to align sequential images based on anatomical landmarks.
- Validation: Terminate subsets of mice at key time points for immunohistochemistry (IHC) analysis of CD8+ T-cells and granzyme B to validate imaging findings.
Key Methodologies and Workflows
Diagram Title: General Workflow for NIR-II-Based Drug Development Studies
Diagram Title: Signaling Pathway for NIR-II Activatable Therapy Monitoring
The Scientist's Toolkit: Research Reagent Solutions
Table 4: Essential Materials for NIR-II Drug Development Studies
| Item / Reagent | Function / Explanation |
|---|---|
| NIR-II Fluorophores | Imaging agents emitting 1000-1700 nm light. Types: organic dyes (CH1055, IR-1061), quantum dots (PbS, Ag2S), single-wall carbon nanotubes (SWCNTs), and rare-earth nanoparticles. |
| Targeting Ligands | Antibodies, peptides, or small molecules conjugated to fluorophores to enable specific binding to disease biomarkers (e.g., HER2, PSMA). |
| Activatable (Smart) Probes | Probes whose NIR-II fluorescence is quenched until activated by a specific enzymatic activity (e.g., apoptosis protease) in the target microenvironment. |
| Bioconjugation Kits | Reagents for covalent linking of fluorophores to biomolecules (e.g., NHS ester-maleimide crosslinkers, click chemistry kits). |
| In Vivo Imaging System (NIR-II Capable) | Instrument with cooled InGaAs or SWIR cameras, 808 nm or 1064 nm lasers, and appropriate spectral filters for the NIR-II window. |
| Anaesthesia System (Isoflurane) | For humane and consistent animal sedation during longitudinal imaging sessions. |
| Image Analysis Software | For ROI definition, intensity quantification, 3D reconstruction, and pharmacokinetic modeling (e.g., Living Image, FIJI/ImageJ, custom MATLAB/Python scripts). |
| PK/PD Modeling Software | Specialized software for non-compartmental and compartmental analysis of time-intensity data (e.g., Phoenix WinNonlin, PKSolver). |
| Calibration Phantoms | Tissue-mimicking phantoms with embedded NIR-II dyes at known concentrations for converting fluorescence intensity to quantitative concentration values. |
Optimizing NIR-II Experiments: Solving Common Challenges for High-Quality Data
Mitigating Autofluorescence and Improving Target-to-Background Ratio
In the NIR-II imaging window (1000-1700 nm), achieving a high target-to-background ratio (TBR) is paramount for obtaining high-fidelity biological images. A primary obstacle is tissue autofluorescence, the intrinsic emission from endogenous fluorophores (e.g., flavins, lipofuscin, collagen cross-links) when excited by shorter wavelengths. This autofluorescence manifests as a non-specific, diffuse background signal, severely compromising image contrast and sensitivity. Within the NIR-II spectral region, autofluorescence decays significantly beyond 1100 nm, but it is not entirely eliminated. This guide details the core physical, chemical, and computational strategies to mitigate autofluorescence and enhance TBR for advanced in vivo imaging applications.
Autofluorescence arises from several endogenous molecules. Their excitation and emission profiles often overlap with those of exogenous NIR-I/NIR-II probes.
| Endogenous Fluorophore | Primary Excitation (nm) | Primary Emission (nm) | Major Tissue Location |
|---|---|---|---|
| Reduced Nicotinamide Adenine Dinucleotide (NADH) | ~340 | 450-470 | Mitochondria of all cells |
| Flavin Adenine Dinucleotide (FAD) | ~450 | 520-550 | Mitochondria, redox cofactor |
| Lipofuscin | 340-490 | 540-700 | Lysosomes in aged tissues |
| Collagen & Elastin (cross-links) | 300-400 | 400-500 | Extracellular matrix |
| Porphyrins | ~400 | 630, 690 | Erythrocytes, liver |
| Melanin | 340-400 | 440-500 | Skin, hair, retinal pigment |
Core Mitigation Strategies
Spectral Shifting into the NIR-IIb (1500-1700 nm) Window
The most effective physical strategy is to shift both excitation and emission into longer wavelengths. Autofluorescence intensity (I) decays approximately with λ^-α, where α is tissue-dependent. Emission in the NIR-IIb sub-window (1500-1700 nm) experiences significantly reduced scattering and near-zero autofluorescence.
Experimental Protocol: NIR-IIb Imaging for Deep-Tissue Visualization
- Probe Selection: Utilize probes with emission peaks >1500 nm (e.g., certain Ag₂S quantum dots, rare-earth-doped nanoparticles, specific conjugated polymers).
- Instrumentation: Configure a NIR-II imaging system with an InGaAs camera sensitive to 1500-1700 nm. Use a 1064 nm or 1319 nm laser for excitation to minimize short-wavelength excitation of background.
- Image Acquisition: Anesthetize and position the animal model. Acquire sequential images through a long-pass filter at 1500 nm (LP1500).
- Analysis: Quantify signal intensity in the target region (e.g., tumor) and an adjacent background region. Calculate TBR = Mean Signal(Target) / Mean Signal(Background).
Temporal Gating (Time-Resolved Imaging)
This method exploits differences in fluorescence lifetime between short-lived autofluorescence (typically 1-10 ns) and longer-lived luminescent probes (e.g., lanthanide complexes, phosphorescent probes with µs-ms lifetimes).
Experimental Protocol: Time-Gated Luminescence Imaging
- Probe Selection: Administer a probe with a long luminescence lifetime (τ > 1 µs), such as Er³⁺-doped nanoparticles.
- System Setup: Use a pulsed excitation laser (e.g., 980 nm OPO laser). Synchronize the InGaAs camera with a gated intensifier.
- Data Acquisition: After the laser pulse, introduce a delay (Δt, e.g., 100 µs) before opening the camera gate. Acquire signal only during a predefined collection window (e.g., 200 µs). The short-lived autofluorescence will have decayed to zero during the delay.
- Processing: The resulting image contains only the persistent luminescence signal from the probe.
Chemical Quenching and Background Suppression
Certain molecules can selectively quench autofluorescence. For example, reducing agents like NaBH₄ can quench aldehyde-induced fluorescence in fixed tissues.
Experimental Protocol: In Vivo Background Suppression with Vectorization
- Targeted Probe Design: Conjugate NIR-II fluorophores to high-affinity targeting ligands (antibodies, peptides) to increase specific accumulation.
- Clearance-Enhanced Probes: Use small-molecule dyes or renal-clearable nanoparticles to promote rapid clearance from non-target tissues, lowering background over time.
- Administration & Imaging: Inject the targeted probe intravenously. Perform longitudinal imaging at multiple time points (e.g., 1, 6, 24, 48 h post-injection). The TBR typically peaks when background signal has cleared but target signal remains high.
Computational Post-Processing
Algorithmic background subtraction can separate signal components based on spectral or temporal signatures.
Experimental Protocol: Spectral Unmixing for NIR-II Imaging
- Data Acquisition: Acquire a hyperspectral image cube (λ dimension across, e.g., 1100-1700 nm in 10 nm steps).
- Reference Spectra: Obtain the emission spectrum of the pure probe (Sprobe(λ)) and a reference autofluorescence spectrum from an uninjected control animal (Sauto(λ)).
- Linear Unmixing: For each pixel i, model the total signal as: Ii(λ) = ai * Sprobe(λ) + bi * Sauto(λ) + ε. Use non-negative least squares regression to solve for the coefficients ai (probe signal) and b_i (autofluorescence).
- Image Generation: Generate a pure "probe only" image from the a_i coefficients, effectively removing the autofluorescence component.
The Scientist's Toolkit: Research Reagent Solutions
Table 2: Essential Materials for High TBR NIR-II Imaging
| Item | Function & Rationale |
|---|---|
| NIR-IIb-Emitting Quantum Dots (e.g., Ag₂S, PbS/CdS) | High quantum yield emission >1500 nm; minimizes tissue scattering and autofluorescence. |
| Lanthanide-Doped Nanoparticles (e.g., NaYF₄:Yb,Er,Tm) | Enable long-lifetime, temporally gatable upconversion or downshifting luminescence. |
| Renal-Clearable Organic Dyes (e.g., CH-1055 derivatives) | Small hydrodynamic diameter promotes rapid urinary excretion, reducing background signal. |
| Targeting Ligands (e.g., cRGD, Anti-VEGF Antibodies) | Conjugated to probes to enhance specific accumulation at disease sites (e.g., tumors). |
| Long-Pass Optical Filters (LP1300, LP1500) | Physically block shorter-wavelength (<1300/1500 nm) light containing most autofluorescence. |
| Pulsed Laser & Gated InGaAs Camera | Enables time-resolved imaging to separate short-lived autofluorescence from long-lived probe signal. |
| Commercial Tissue Clearing Agents (e.g., CUBIC, CLARITY) | Reduce light scattering in ex vivo samples, improving signal clarity and depth. |
| Spectral Unmixing Software (e.g., ENVI, in-house MATLAB/Python code) | Computationally separates overlapping emission spectra of probe and autofluorescence. |
Quantitative Comparison of Strategies
Table 3: Performance Metrics of Autofluorescence Mitigation Techniques
| Strategy | Typical TBR Improvement Factor | Key Advantage | Key Limitation |
|---|---|---|---|
| NIR-IIb (1500-1700 nm) Imaging | 5-10x vs. NIR-I | Drastically reduces autofluorescence & scattering. | Limited availability of bright, biocompatible probes. |
| Time-Gated Imaging | 10-100x (in ideal conditions) | Effectively eliminates all short-lived background. | Requires specialized equipment; limited to long-lifetime probes. |
| Active Targeting | 2-4x vs. passive probes | Increases absolute signal at target site. | Does not directly reduce autofluorescence; background remains. |
| Spectral Unmixing | 2-3x (depends on overlap) | Applicable to any multi-spectral data; no hardware changes. | Purity dependent on reference spectra; can be computationally intensive. |
Integrated Protocol: High-Contrast Tumor Vasculature Imaging
This protocol combines spectral shifting and temporal gating for optimal TBR.
- Probe Preparation: Synthesize and functionalize Er³⁺-doped NaYF₄ nanoparticles with a PEG coating for biocompatibility. Confirm peak emission at 1525 nm.
- Animal Model: Use a murine xenograft tumor model.
- Imaging Setup:
- Laser: 980 nm pulsed laser (pulse width: 10 ns, rep rate: 10 Hz).
- Detection: Gated InGaAs camera with a LP1500 filter.
- Timing: Set gate delay to 100 µs, gate width to 500 µs.
- Procedure:
- Acquire a pre-injection background image.
- Intravenously inject 200 µL of nanoparticle solution (1 mg/mL).
- Acquire post-injection images at 1, 6, and 24 hours.
- For comparison, acquire a non-gated image (0 µs delay) at the 1-hour time point.
- Data Analysis:
- Subtract pre-injection background from all images.
- Calculate TBR for gated vs. non-gated images at 1 hour.
- Plot tumor signal intensity vs. background (muscle) intensity over time.
Mitigating autofluorescence is a multi-faceted challenge central to exploiting the NIR-II window's potential. The synergistic application of spectral selection (NIR-IIb), temporal gating, chemical probe design, and computational analytics provides a robust framework for achieving unparalleled TBR. As probe chemistry and imaging hardware continue to advance, the integration of these strategies will become standard practice, pushing the detection limits deeper and enabling previously impossible observations in complex biological systems, thereby accelerating therapeutic development.
Near-infrared window II (NIR-II, 1000-1700 nm) fluorescence imaging has emerged as a transformative biomedical technology, offering superior spatial resolution, millimeter-depth penetration, and reduced autofluorescence compared to visible or NIR-I imaging. The efficacy of this modality is intrinsically linked to the performance of the employed molecular probes. This technical guide details the core optimization parameters—brightness, biocompatibility, and targeting—for advanced probe design within the NIR-II spectral context.
Core Optimization Parameters
Brightness Optimization
Brightness (Φ × ε) is the product of fluorescence quantum yield (Φ) and molar extinction coefficient (ε). In the NIR-II window, brightness is enhanced by engineering the electronic structure and minimizing non-radiative decay.
Key Strategies:
- Molecular Engineering: For organic dyes and conjugated polymers, extending π-conjugation and introducing donor-acceptor groups redshift emission into NIR-II while tuning ε. Rigidification of molecular structures reduces vibrational relaxation, increasing Φ.
- Nanoparticle Design: For inorganic probes like Ag₂S, PbS/CdS quantum dots (QDs), and single-walled carbon nanotubes (SWCNTs), size and surface defect control are critical. A proper inorganic shell (e.g., CdS on PbS) can passivate surface traps, boosting Φ from <1% to >10% in water.
- Aggregation-Induced Emission (AIE): Utilizing AIEgens prevents aggregation-caused quenching (ACQ), a common issue at high concentrations needed for bright imaging.
Quantitative Data Summary: Table 1: Brightness Parameters of Representative NIR-II Probes
| Probe Type | Core Material | Emission Peak (nm) | ε (M⁻¹cm⁻¹) / (L·g⁻¹cm⁻¹) | Φ in H₂O (%) | Brightness Relative Metric | Key Reference (Year) |
|---|---|---|---|---|---|---|
| Organic Dye | CH1055 derivative | 1055 | 1.1 × 10⁵ (ε) | 3.2 | High for organics | Antaris et al. (2016) |
| Quantum Dots | PbS/CdS core/shell | 1300 | ~10⁵ (ε) | 15-25 | Very High | Bruns et al. (2017) |
| Rare-Earth Nanoparticles | NaYF₄: Nd³⁺ | 1060/1340 | N/A (particle-based) | ~10 (at 1340 nm) | Medium | Zhong et al. (2019) |
| Single-Walled Carbon Nanotubes | (6,5) chirality | 990-1300 | 10⁷ (L·g⁻¹cm⁻¹) | 0.1-1.0 | Extremely High ε | Hong et al. (2021) |
| Conjugated Polymer | DPP-based polymer | 1100 | 2.8 × 10⁵ (ε) | 5.6 | High | Zhu et al. (2022) |
| AIEgen | TQ-BPN | 1200 | 4.2 × 10⁴ (ε) | 6.7 | Good for AIE | Qi et al. (2023) |
Experimental Protocol: Quantum Yield Measurement (Relative Method)
- Reference Selection: Choose a NIR-II reference standard with known Φ in a specific solvent (e.g., IR-26 dye in dichloroethane, Φ=0.05% at 1064 nm excitation).
- Sample Preparation: Prepare optically dilute solutions of reference (R) and sample (S) (Absorbance < 0.1 at excitation λ) in the same solvent to minimize refractive index effects.
- Spectroscopy: Measure absorbance (A) at excitation λ (e.g., 808 nm) and integrated fluorescence emission across 1000-1700 nm using a NIR-spectrograph coupled to an InGaAs array detector.
- Calculation: Apply formula: ΦS = ΦR × (IS / IR) × (AR / AS) × (ηS² / ηR²), where I is integrated fluorescence intensity, A is absorbance at excitation, and η is refractive index of solvent.
- Correction: Account for detector spectral sensitivity using a calibration lamp. Ensure excitation wavelength and power are identical for all measurements.
Biocompatibility and Surface Functionalization
Biocompatibility encompasses low cytotoxicity, minimal non-specific biodistribution, and controlled clearance. Surface chemistry is the primary lever for optimization.
Key Strategies:
- Hydrophilic Coatings: PEGylation is the gold standard. Dense PEG brushes (≥ 5 kDa) confer "stealth" properties, reducing opsonization and reticuloendothelial system (RES) uptake, prolonging circulation half-life.
- Biodegradability: Designing probes from biodegradable materials (e.g., certain silica shells, poly(lactic-co-glycolic acid) - PLGA) enables renal or hepatic clearance, reducing long-term toxicity concerns.
- Charge and Ligand Density: Neutral or slightly negative surfaces minimize non-specific cellular interactions. Optimal ligand density balances stability and functionality.
Experimental Protocol: In Vitro Cytotoxicity Assessment (MTT Assay)
- Cell Seeding: Seed cells (e.g., HepG2, RAW 264.7) in a 96-well plate at a density of 5×10³ - 1×10⁴ cells/well in 100 µL complete medium. Incubate for 24h (37°C, 5% CO₂).
- Probe Exposure: Prepare serial dilutions of the probe in culture medium. Aspirate old medium and add 100 µL of probe-containing medium to each well. Include wells with medium only (blank) and cells with medium only (control). Incubate for 24-48h.
- MTT Addition: Add 10 µL of MTT reagent (5 mg/mL in PBS) to each well. Incubate for 4h.
- Solubilization: Carefully aspirate the medium. Add 100 µL of DMSO to each well to dissolve the formed formazan crystals. Gently shake the plate for 10 minutes.
- Absorbance Measurement: Measure absorbance at 570 nm (reference ~650 nm) using a microplate reader.
- Analysis: Calculate cell viability (%) = (Abssample - Absblank)/(Abscontrol - Absblank) × 100%. The half-maximal inhibitory concentration (IC₅₀) can be determined from dose-response curves.
Signaling Pathways in Immune Recognition & Clearance
Diagram Title: Immune Recognition and Clearance Pathways for NIR-II Nanoparticles
Targeting Strategies
Targeting enhances signal-to-noise ratio at the disease site via active (molecular recognition) or passive (Enhanced Permeability and Retention - EPR) mechanisms.
Key Strategies:
- Passive Targeting (EPR): Leverages the leaky vasculature and poor lymphatic drainage of tumors. Effective for nanoparticles sized 10-200 nm with long circulation times.
- Active Targeting: Involves conjugating targeting ligands (antibodies, peptides, aptamers, small molecules) to the probe surface to bind overexpressed antigens/receptors on target cells (e.g., folate receptor, PSMA, EGFR).
- Activatable Probes: "Smart" probes that only fluoresce upon encountering a target-specific enzyme (e.g., caspase-3) or pH environment, providing exceptional specificity.
Experimental Protocol: Ligand Conjugation via NHS Ester Chemistry
- Probe Activation: To a solution of amine-coated nanoparticles (e.g., PEG-NH₂ coated QDs, 1 nmol in 1 mL 0.1 M PBS, pH 7.4), add a 50-100 molar excess of heterobifunctional crosslinker Sulfo-SMCC. React for 1h at RT.
- Purification: Remove excess crosslinker using size-exclusion chromatography (PD-10 column) or centrifugal filtration (100kDa MWCO), eluting into PBS (pH 7.4).
- Ligand Preparation: Reduce disulfide bonds in the antibody (e.g., anti-EGFR) using 10 mM TCEP for 30 min. Purify to obtain free thiols.
- Conjugation: Mix the activated nanoparticles with the thiolated ligand (at a 1:5 to 1:10 nanoparticle:ligand molar ratio). React overnight at 4°C under gentle agitation.
- Purification & Characterization: Purify the conjugate via size-exclusion chromatography. Confirm conjugation using UV-Vis-NIR spectroscopy (check for characteristic antibody absorbance at 280 nm) and dynamic light scattering (DLS) for hydrodynamic size shift.
The Scientist's Toolkit: Research Reagent Solutions
Table 2: Essential Materials for NIR-II Probe Development & Evaluation
| Item Name | Function/Benefit | Example Brand/Type |
|---|---|---|
| NIR-II Fluorescence Imager | Enables in vitro and in vivo imaging in the 1000-1700 nm range. Requires cooled InGaAs or HgCdTe cameras. | Princeton Instruments NIRvana, Sony IMX990/991, InView NIR-II systems. |
| Spectrofluorometer with NIR Detector | Measures excitation/emission spectra and quantum yield. Requires NIR-sensitive PMT or InGaAs array. | Edinburgh Instruments FLS1000, Horiba Fluorolog with NIR-PMT. |
| Heterobifunctional Crosslinkers | For covalent conjugation of targeting ligands to probe surfaces (e.g., NHS-PEG-Maleimide). | Thermo Fisher Scientific (Sulfo-SMCC), BroadPharm (varied PEG lengths). |
| PEGylation Reagents | Polyethylene glycol derivatives to impart hydrophilicity and stealth properties (e.g., mPEG-SH, COOH-PEG-NHS). | Creative PEGWorks, Laysan Bio, Nanocs. |
| Size-Exclusion Chromatography Columns | Purify conjugated probes from excess reactants. | Cytiva PD-10 Desalting Columns, Bio-Gel P-30. |
| Dynamic Light Scattering (DLS) / Zeta Potential Analyzer | Measures hydrodynamic size, polydispersity index (PDI), and surface charge (zeta potential). | Malvern Panalytical Zetasizer. |
| ICP-MS System | Quantifies elemental composition (e.g., Pb, Ag, Nd) for pharmacokinetics and biodistribution studies. | PerkinElmer NexION, Agilent 7900. |
| Cell Lines for Targeting Validation | Cells with known overexpression of target receptors (e.g., U87MG for EGFR, HeLa for Folate Receptor). | ATCC, Sigma-Aldrich. |
| Animal Models for In Vivo Studies | Immunodeficient mice with subcutaneous or orthotopic xenograft tumors for imaging evaluation. | Charles River Laboratories (e.g., nude, NSG mice). |
Workflow for Integrated Probe Development & Evaluation
Diagram Title: NIR-II Probe Development and Validation Workflow
Optimizing NIR-II probes requires a holistic, iterative approach balancing brightness, biocompatibility, and targeting. Future directions point towards theranostic probes combining imaging and therapy, ultra-small renal-clearable agents for clinical translation, and multiplexed imaging using probes with distinct, narrow emission bands within the NIR-II window. As material science and conjugation chemistry advance, the design rules outlined here will enable the creation of next-generation probes to fully exploit the potential of NIR-II imaging in biomedical research and drug development.
Instrument Calibration and Noise Reduction Techniques for Low-Light Detection
This technical guide details essential methodologies for instrument calibration and noise suppression, framed within the broader research thesis on defining the second near-infrared (NIR-II) imaging window (1000–1700 nm). Optimizing detection within this spectral region is critical for advancing deep-tissue biomedical imaging, particularly for in vivo drug development studies where signal is inherently weak. Precise calibration and rigorous noise reduction are prerequisites for achieving the high sensitivity and quantitative accuracy required for robust scientific conclusions.
Understanding noise sources is fundamental to implementing effective reduction strategies. The primary contributors in NIR-II detection systems are summarized below.
Table 1: Primary Noise Sources in NIR-II Detection Systems
| Noise Source | Origin | Characteristics in NIR-II (1000-1700 nm) |
|---|---|---|
| Shot Noise | Particle nature of light (Poisson-distributed photon arrival). | Fundamental, signal-dependent. Dominant at moderate to high flux. Increases with √(signal). |
| Dark Current Noise | Thermally generated electrons in the detector. | Highly temperature-dependent. Major concern for InGaAs (standard NIR-II detector) and cooled CMOS/Si. |
| Read Noise | On-chip amplifier and analog-to-digital conversion. | Signal-independent. Critical factor at very low light levels. |
| Fixed Pattern Noise (FPN) | Pixel-to-pixel sensitivity variations. | Constant over time. Corrected via flat-field calibration. |
| Stray Light & Background | Ambient light, blackbody radiation from optics/samples. | Significant due to longer wavelengths; requires spectral and spatial filtering. |
Instrument Calibration Protocols
A systematic calibration routine is mandatory for quantitative imaging. The following protocols must be performed regularly.
Dark Frame Calibration
Purpose: To characterize and correct for dark current and bias offset. Protocol:
- Acquisition: Cap the detector lens or use a shutter to block all light. Acquire multiple frames (N ≥ 16) using the exact integration time and sensor temperature as experimental settings.
- Master Dark Creation: Compute the median pixel value across the stack to generate a single "master dark" frame. The median resists cosmic ray/shot noise spikes.
- Application: Subtract the master dark frame from all subsequent experimental images.
Flat-Field Calibration
Purpose: To correct for non-uniform pixel sensitivity and optical path vignetting. Protocol:
- Setup: Illuminate a uniform, spectrally neutral diffuse source (e.g., integrating sphere) with the NIR-II excitation source or a broadband lamp.
- Acquisition: Acquire multiple frames of the uniform field. The average pixel intensity should be approximately 50-70% of the sensor's full-well capacity to ensure good SNR.
- Master Flat Creation: Generate a median stack to create a master flat. Subtract the master dark from this master flat.
- Normalization: Normalize the dark-subtracted master flat by its mean pixel value.
- Application: Divide dark-subtracted experimental images by the normalized master flat.
Spectral Calibration & Stray Light Rejection
Purpose: To ensure accurate wavelength assignment and minimize out-of-band signal. Protocol:
- Wavelength Calibration: Use atomic emission lamps (e.g., Argon, Neon) or known laser lines to map pixel position to wavelength on a spectrometer-based system.
- Spectral Filter Characterization: Measure the transmission/blocking spectrum of all optical filters (e.g., long-pass, band-pass) using a spectrophotometer. Verify out-of-band blocking exceeds optical density (OD) 5-6 for effective ambient/stray light rejection.
- Enclosure & Baffling: Physically enclose the optical path and use black anodized, textured baffles to trap scattered NIR light.
Advanced Noise Reduction Techniques
Beyond calibration, active techniques suppress stochastic noise.
Active Cooling of Detectors
Experimental Setup: Mount the InGaAs or cooled Si detector on a thermoelectric (Peltier) cooler stage integrated with a temperature sensor and PID controller. Methodology: Stabilize detector temperature typically between -20°C to -80°C. For each 7-10°C reduction, dark current approximately halves. Document the precise dark current (e-/pixel/sec) vs. temperature curve for your specific sensor.
Purpose: To extract a modulated signal from a noisy DC background. Workflow: Modulate the excitation laser source at a high frequency (f). Use a digitizer synchronized to this frequency to sample the detector output. A software or hardware lock-in amplifier multiplies the signal by a reference sinusoid at frequency f and applies a low-pass filter, rejecting noise outside a narrow bandwidth around f.
Lock-In Amplification Signal Extraction Workflow
Computational Signal Processing
Temporal Binning: Acquire multiple sequential frames and compute the mean or median pixel value. Increases SNR by √N (for read/shot noise). Spatial Binning: Combine charge from adjacent pixels on-chip (hardware) or by averaging in software (post-processing). Trade-off: reduced spatial resolution. Wavelet Denoising: Apply a multiscale wavelet transform (e.g., Daubechies), threshold the wavelet coefficients to suppress noise, and reconstruct the image.
The Scientist's Toolkit: Key Research Reagent Solutions
Essential materials for NIR-II low-light detection experiments.
Table 2: Essential Reagents & Materials for NIR-II Low-Light Experiments
| Item | Function in NIR-II Research | Key Specification/Example |
|---|---|---|
| Extended InGaAs Camera | Primary detector for 900-1700 nm range. | TE-cooled, 2D array. Offers high quantum efficiency in NIR-II. |
| NIR-II Fluorescent Probe | Molecular agent that emits light within the imaging window. | Lead Sulfide (PbS) or Lanthanide-based Nanocrystals (e.g., Er³⁺), Organic Dyes (e.g., CH-4T). |
| High-Power 808 nm or 980 nm Laser | Excitation source for common NIR-II probes. | Diode laser, power adjustable, with temperature stabilization. |
| Long-Pass Optical Filters | Block excitation/scatter light, transmit only NIR-II emission. | Multilayer dielectric filters with sharp cut-on (e.g., 1000 nm, 1200 nm, 1500 nm LP). OD >6 at laser line. |
| Integrating Sphere | Provides uniform illumination for flat-field calibration. | Spectralon-coated interior for high, diffuse reflectance in NIR-II. |
| NIR-Optimized Lenses & Optics | Focus and direct NIR-II light with minimal loss. | AR-coated for 1000-1700 nm, made from materials like CaF₂ or ZnSe. |
| Calibration Blackbody Source | Absolute radiometric calibration for thermal emission studies. | Temperature-controlled, known emissivity (>0.99). |
Integrated Experimental Workflow for Validated Data
A consolidated workflow from setup to validated image.
NIR-II Imaging Calibration and Processing Workflow
Within the research framework defining the NIR-II window (1000-1700 nm), rigorous instrument calibration and multi-layered noise reduction are not optional but foundational. By systematically implementing dark/flat-field protocols, actively cooling detectors, employing lock-in detection for modulated signals, and utilizing computational denoising, researchers can extract reliable, quantitative data from the inherent low-light conditions of deep-tissue imaging. This discipline directly enhances the sensitivity and specificity of NIR-II techniques, accelerating their translation into robust tools for drug development and preclinical research.
Best Practices for Animal Preparation, Anesthesia, and Motion Artifact Reduction
This guide details optimized protocols for preclinical in vivo imaging within the second near-infrared window (NIR-II, 1000-1700 nm). The superior tissue penetration and reduced autofluorescence in this spectral band demand stringent animal preparation to fully leverage its high-resolution, deep-tissue imaging capabilities. Minimizing motion artifacts is paramount for quantifying dynamic biological processes.
I. Animal Preparation for NIR-II Imaging
Key Principle: Preparation aims to minimize optical interference and standardize physiological state.
Hair Removal
Depilation is critical, as hair strongly scatters NIR light. Chemical depilatory creams are preferred over shaving to avoid micro-cuts and residual stubble. Apply cream for ≤1 minute, then thoroughly remove with wet gauze to prevent skin irritation. Perform depilation 24 hours prior to imaging to allow skin recovery.
Diet and Fasting
For abdominal or metabolic studies, fasting for 4-6 hours (rodents) reduces food content autofluorescence and peristaltic motion. Provide water ad libitum.
Skin Preparation
Gently clean the imaging area with saline or mild disinfectant. For imaging requiring high surface contrast, apply a thin layer of optical coupling gel (e.g., ultrasound gel) to minimize air-tissue interface refraction.
II. Anesthesia Protocols: Optimization for Stability
Anesthesia is the primary tool for motion suppression. Choice impacts physiology and contrast agent pharmacokinetics.
Quantitative Comparison of Common Anesthetic Regimens
Table 1: Anesthetic Protocols for Rodent NIR-II Imaging
| Anesthetic Agent | Dosage (Mouse) | Route | Key Advantages for NIR-II | Key Drawbacks | Motion Artifact Score (1-5, 5=Best) |
|---|---|---|---|---|---|
| Isoflurane/O₂ | 1-3% (v/v) for induction, 1-1.5% for maintenance | Inhalation | Rapid control of depth, stable physiology, fast recovery. | Requires scavenging, can suppress respiration. | 5 |
| Ketamine/Xylazine | 80-100 mg/kg + 5-10 mg/kg | IP injection | Long-duration sedation, good analgesia. | Cardiorespiratory depression, acid-base imbalance. | 3 |
| Medetomidine/ Midazolam/ Fentanyl (MMF) | 0.3/4.0/0.05 mg/kg | SC injection | Stable surgical plane, reversible. | Complex preparation, requires reversal agent. | 4 |
| Avertin (Tribromoethanol) | 250-300 mg/kg | IP injection | Simple administration, short duration. | Inflammatory response, peritonitis risk. | 2 |
Recommended Protocol (Isoflurane):
- Induction: Place animal in induction chamber with 3-4% isoflurane in 1 L/min O₂.
- Maintenance: Transfer to imaging stage with nose cone. Maintain at 1-1.5% isoflurane.
- Monitoring: Use a pulse oximeter (clip on hind paw) to monitor SpO₂ (>95%) and heart rate (450-550 bpm for mice). Maintain body temperature at 37°C ± 0.5°C using a feedback-controlled heating pad.
- Ventilation: For long sessions (>1 hr) or thoracic imaging, consider mechanical ventilation to prevent respiratory motion.
III. Motion Artifact Reduction: Techniques and Validation
Motion artifacts degrade spatial resolution and quantitative accuracy.
Physical Restraint
Custom 3D-printed holders or surgical tape provide gentle immobilization of limbs and head. Ensure no restriction of chest expansion for breathing.
Physiological Gating
Synchronize image acquisition with physiological cycles.
- Respiratory Gating: Use a pressure sensor under the chest. Acquire frames only at the end-expiration plateau.
- Cardiac Gating: Utilize ECG electrodes. Trigger acquisition at specific phases of the cardiac cycle (e.g., diastole).
Post-Processing Algorithms
- Image Registration: Use rigid or non-rigid registration algorithms (e.g., StackReg, TurboReg) to align sequential frames. Efficacy is quantified by the reduction in standard deviation of a static landmark's position across frames.
- Motion Artifact Compensation Workflow:
Title: Computational Motion Correction Workflow for NIR-II Data
Experimental Validation Protocol
Aim: Quantify motion artifact reduction efficacy.
- Implant a stable NIR-II fluorescent reference bead (e.g., PbS/CdS QDs, 1300 nm emission) subcutaneously in a mouse.
- Acquire a 5-minute dynamic image sequence (10 fps) under light anesthesia (allowing some motion).
- Apply gating and/or post-processing registration.
- Quantitative Analysis: Track the bead's centroid position (X,Y) over time. Calculate the Root Mean Square (RMS) displacement before and after correction.
- Formula: RMS = sqrt( Σ( (Xi - Xmean)² + (Yi - Ymean)² ) / N )
- Success Criterion: ≥70% reduction in RMS displacement.
Table 2: Quantitative Motion Reduction Outcomes
| Correction Method | Mean RMS Displacement (Pixels) | Reduction vs. Uncorrected | Impact on Signal-to-Noise Ratio (SNR) |
|---|---|---|---|
| Uncorrected | 12.5 ± 3.2 | - | Baseline |
| Physical Restraint Only | 5.1 ± 1.8 | 59% | No change |
| Respiratory Gating | 3.4 ± 0.9 | 73% | Slight decrease (shorter integration) |
| Post-Hoc Registration | 1.8 ± 0.5 | 86% | Potential increase |
| Gating + Registration | 1.2 ± 0.3 | 90% | Maintained or increased |
IV. Integrated Workflow for NIR-II Imaging Experiment
Title: End-to-End Protocol for Motion-Reduced NIR-II Imaging
The Scientist's Toolkit: Research Reagent Solutions
Table 3: Essential Materials for NIR-II Imaging Experiments
| Item & Example Product | Function in NIR-II Context | Specification Notes |
|---|---|---|
| NIR-II Fluorescent Contrast Agent (e.g., IRDye 1200 CW, PbS/CdS QDs, Single-Wall Carbon Nanotubes) | Provides emissive signal within 1000-1700 nm window. | Match emission peak to camera quantum efficiency (e.g., InGaAs, HgCdTe). |
| Chemical Depilatory Cream (e.g., Nair) | Removes hair to prevent light scattering. | Use sensitive skin formula; limit contact time. |
| Medical-Grade Isoflurane & Vaporizer | Provides stable, controllable inhalation anesthesia. | Calibrate vaporizer regularly. Use active scavenging. |
| Feedback-Controlled Heating Pad (e.g., Homeothermic Monitoring System) | Maintains core body temperature at 37°C. | Prevents anesthesia-induced hypothermia, stabilizing physiology. |
| Pulse Oximeter / Physio Monitor (e.g., MouseSTAT) | Monitors heart rate, SpO₂, respiration. | Essential for adjusting anesthesia depth and for gating signals. |
| Optical Coupling Gel (e.g., Ultrasound Gel) | Index-matching medium at tissue-air interface. | Ensure it is non-fluorescent in the NIR-II region. |
| Sterile Saline (0.9%) | Vehicle for agent injection, skin cleaning. | Warm to 37°C before injection to reduce animal stress. |
| Custom 3D-Printed Animal Holder | Provides reproducible, gentle physical restraint. | Design with MRI-compatible plastic for multimodal studies. |
| Image Registration Software (e.g., FIJI/ImageJ with StackReg) | Performs post-hoc computational motion correction. | Requires high-contrast features or fiducial markers in frame. |
Within the burgeoning field of NIR-II (1000-1700 nm) bioimaging, the translation of promising preclinical results into clinically relevant data hinges on rigorous quantitative analysis. The inherent variability in instrumentation, probe concentration, and tissue optical properties necessitates stringent standardization of both data acquisition and radiometric measurements. This guide details the methodologies essential for generating reproducible, quantifiable data that can be reliably compared across laboratories and studies, forming a critical pillar for robust research in drug development and therapeutic monitoring.
Core Principles of Radiometry in the NIR-II Window
Quantitative NIR-II imaging requires converting raw camera counts into units of absolute radiance (e.g., µW cm⁻² sr⁻¹) or quantifying relative metrics like signal-to-background ratio (SBR) and contrast-to-noise ratio (CNR). Standardization must account for the non-uniform spectral response of the detection system across the 1000-1700 nm range.
Key Radiometric Parameters & Definitions
Table 1: Core Radiometric Quantities for NIR-II Imaging Standardization
| Quantity | Symbol | Unit | Definition & Relevance to NIR-II |
|---|---|---|---|
| Spectral Radiance | L_λ | W cm⁻² sr⁻¹ nm⁻¹ | Radiance per unit wavelength. Essential for characterizing light emitted from tissue or probes. |
| System Responsivity | R(λ) | Counts / (W cm⁻² sr⁻¹) | Wavelength-dependent conversion factor of the imaging system (camera, lenses, filters). Must be calibrated. |
| Signal-to-Background Ratio | SBR | Unitless | Ratio of target signal intensity to surrounding tissue intensity. Primary metric for image quality. |
| Contrast-to-Noise Ratio | CNR | Unitless | (SignalMean - BackgroundMean) / Background_STD. Measures detectability against noise. |
| Absolute Quantum Yield (NIR-II) | Φ | % | Photons emitted / photons absorbed for a fluorophore within 1000-1700 nm. Requires integrating sphere measurements. |
Experimental Protocols for System Calibration
Protocol: Determining System Spectral Responsivity, R(λ)
Purpose: To establish a calibration curve that converts raw camera counts into units of spectral radiance for any given wavelength within the 1000-1700 nm range.
Materials:
- NIR-II imaging system (InGaAs camera, lenses, bandpass/longpass filters)
- Tunable monochromator or set of discrete wavelength laser diodes (e.g., 1064, 1310, 1550 nm)
- NIST-traceable calibrated irradiance source (e.g., blackbody source, calibrated LED)
- Power meter with spectral calibration certificate
- Diffuse reflectance standard (Spectralon)
Procedure:
- Setup: Place the calibrated irradiance source at a fixed distance to uniformly illuminate the Spectralon target, which fills the camera's field of view.
- Source Characterization: For each wavelength (λ) of interest, measure the spectral irradiance (E_λ) at the target plane using the calibrated power meter.
- Image Acquisition: For each λ, acquire an image of the illuminated target using the NIR-II system with fixed exposure time, gain, and f-stop. Record the average camera counts (Counts_λ) within a consistent ROI.
- Calculation: The system responsivity at each wavelength is calculated as: R(λ) = Countsλ / Lλ, where Lλ = Eλ / π (assuming a Lambertian reflector).
- Model Fitting: Plot R(λ) vs. λ and fit a polynomial function to interpolate responsivity across the entire spectral window.
Protocol: In Vivo Quantitative Fluorophore Kinetics
Purpose: To derive pharmacokinetic parameters (e.g., uptake, clearance) from time-series NIR-II images of a targeted contrast agent.
Materials:
- Animal model with target pathology.
- NIR-II fluorescent contrast agent (e.g., targeted carbon nanotubes, rare-earth-doped nanoparticles).
- Calibrated imaging system (per Protocol 3.1).
- Isoflurane anesthesia system for longitudinal imaging.
Procedure:
- Pre-injection Baseline: Acquire a baseline image of the animal.
- Agent Administration: Inject a known mass (m) and concentration (C) of the NIR-II agent intravenously.
- Longitudinal Imaging: Acquire images at fixed time intervals (t) post-injection (e.g., 1, 5, 15, 30, 60, 120 min) with identical system settings.
- Data Processing: a. Define ROIs for the target tissue (T) and a background/reference tissue (B). b. Convert average counts in each ROI to radiance using the R(λ) calibration. c. Calculate target-specific signal: ST(t) = RadianceT(t) - Radiance_B(t).
- Pharmacokinetic Modeling: Fit S_T(t) data to an appropriate model (e.g., bi-exponential decay) to extract half-lives (t₁/₂,α, t₁/₂,β) and area under the curve (AUC).
Standardized Data Acquisition Workflow
Diagram 1: Standardized NIR-II Quantitative Imaging Workflow
Signaling Pathways in Targeted NIR-II Imaging
A key application is imaging drug-induced pathway modulation. Below is a generalized pathway for a receptor-targeted NIR-II probe.
Diagram 2: NIR-II Probe Binding to Signaling Pathway & Readout
The Scientist's Toolkit: Essential Research Reagents & Materials
Table 2: Key Reagent Solutions for Quantitative NIR-II Research
| Item | Function & Relevance to Standardization |
|---|---|
| NIST-Traceable Irradiance Source | Provides a known, standardized light output for absolute calibration of the imaging system's responsivity across wavelengths. |
| Spectralon Diffuse Reflectance Target | A near-perfect Lambertian reflector with known reflectance (>99% in NIR-II). Used as a uniform reference for flat-field correction and responsivity calibration. |
| Wavelength Calibration Kit (e.g., Laser Diodes at 1064, 1310, 1550 nm) | Verifies and calibrates the spectral accuracy of the imaging system's filter sets and monochromator. |
| Stable NIR-II Reference Material (e.g., IR-26 Dye, PbS Quantum Dot Film) | Acts as a daily "system check" standard to monitor for instrument performance drift over time. |
| Phantom Materials (e.g., Intralipid, India Ink, Epoxy) | Used to create tissue-mimicking phantoms with known scattering and absorption coefficients to validate quantitative algorithms. |
| Integrating Sphere (with NIR-II detector) | Essential for measuring the absolute photoluminescence quantum yield (PLQY) of novel NIR-II fluorophores. |
Data Standardization and Reporting Table
To ensure cross-study comparability, a minimum dataset should be reported.
Table 3: Mandatory Metadata for Reporting Quantitative NIR-II Experiments
| Category | Parameter | Example/Unit | Purpose |
|---|---|---|---|
| Imaging System | Camera Model & Cooling | InGaAs, -80°C | Detector specification. |
| Lens & Filters | f/1.4, 1500LP | Optical train description. | |
| Pixel Binning | 1x1 or 2x2 | Affects SNR and resolution. | |
| Acquisition | Exposure Time | 100 ms | Critical for kinetics. |
| Frame Rate | 10 fps | Temporal resolution. | |
| Field of View | 10 x 10 cm | Spatial context. | |
| Calibration | Responsivity Ref. Date | 2023-10-26 | Calibration validity. |
| Radiance Conversion Factor | 550 counts/(µW cm⁻² sr⁻¹) | Links counts to physical units. | |
| Subject/Probe | Probe Concentration | 100 µM | Dosage information. |
| Injection Volume | 200 µL | Administration details. | |
| Animal Model | BALB/c nude mouse | Biological context. | |
| Processing | Background Subtraction Method | ROI from muscle | Defines signal origin. |
| Noise Filter (if any) | Gaussian, σ=1 pixel | Post-processing step. |
NIR-II vs. Traditional Modalities: A Quantitative Validation and Benchmarking Framework
Within the broader thesis defining the NIR-II imaging window (1000-1700 nm), this whitepaper provides a technical comparison of the NIR-II and NIR-I (700-900 nm) biological imaging windows. The fundamental photophysical interactions of light with tissue—namely absorption, scattering, and autofluorescence—differ significantly between these spectral regions, leading to critical advantages for in vivo imaging in the NIR-II window.
Core Principles: Light-Tissue Interaction
Scattering
Light scattering in tissue decreases with increasing wavelength according to approximate Rayleigh or Mie scattering principles. Longer NIR-II wavelengths experience significantly reduced scattering compared to NIR-I, enabling sharper images and greater penetration.
Absorption
The primary tissue chromophores—water, hemoglobin, lipids, and melanin—have distinct absorption profiles. The NIR-II window resides in a local minimum of absorption for these components, particularly between hemoglobin's declining absorption and water's rising absorption, minimizing signal attenuation.
Autofluorescence
Endogenous fluorophores (e.g., flavins, NADH) require high-energy excitation, predominantly emitting in the visible and NIR-I ranges. Excitation and imaging in the NIR-II window dramatically reduce this background, resulting in markedly improved signal-to-noise ratios (SNR).
Quantitative Comparison of Performance Metrics
Table 1: Comparative Photophysical Properties of NIR-I and NIR-II Windows
| Parameter | NIR-I (700-900 nm) | NIR-II (1000-1700 nm) | Implication for NIR-II |
|---|---|---|---|
| Typical Scattering Coefficient (μs') | ~0.5 - 1.0 mm⁻¹ at 800 nm | ~0.2 - 0.5 mm⁻¹ at 1300 nm | ~2-3x reduction in scattering |
| Absorption by Hemoglobin | Moderate to High | Very Low | Decreased signal loss from blood |
| Tissue Autofluorescence | High | Near-Zero | Superior Target-to-Background Ratio |
| Maximum Penetration Depth (in brain/skin) | 1-2 mm | 3-8 mm | 2-4x deeper imaging possible |
| Theoretical Resolution Limit (FWHM) | ~5-10 µm (diffraction-limited) | ~10-20 µm (diffraction-limited) | Can be offset by reduced scattering for in vivo clarity |
| Practical Achieved Resolution In Vivo | Degraded (>50 µm) due to scattering | Maintained near diffraction limit | Sharper anatomical and vascular detail |
Table 2: Performance Summary from Key Comparative Studies
| Study Focus | NIR-I Fluorophore/System | NIR-II Fluorophore/System | Key Outcome (NIR-II vs. NIR-I) |
|---|---|---|---|
| Cranial Window Imaging | ICG, ~800 nm emission | SWCNTs, ~1300 nm emission | 1.7x greater penetration, 3x higher spatial resolution of vasculature |
| Hindlimb Ischemia Model | Alexa Fluor 790 | IR-E1050 | Identified 46% more capillaries at 1.5 mm depth; SNR 4.2x higher |
| Tumor Imaging | Cy5.5 | CH1055 | Tumor-to-background ratio: 2.5 vs. 4.8 for NIR-I vs. NIR-II |
| Lymph Node Mapping | Indocyanine Green (ICG) | Ag2S Quantum Dots | Detection depth: 1.3 cm vs. 0.8 cm; Signal intensity 5x higher at 1 cm |
Experimental Protocols for Direct Comparison
Protocol 1: Direct In Vivo Comparison of Vascular Imaging Resolution
- Animal Model: Prepare a athymic nude mouse with a dorsal skinfold chamber or cranial window.
- Dual-Channel Fluorophore Administration: Inject a single agent with emissions spanning both NIR-I and NIR-II windows (e.g., rare-earth doped nanoparticles) or co-inject two spectrally distinct agents intravenously.
- Imaging Setup: Use a NIR-sensitive InGaAs camera (for NIR-II) and a Si CCD camera (for NIR-I) on a shared optical path with a 808 nm or 980 nm excitation laser. Employ long-pass filters: 850 nm LP for NIR-I channel and 1100 nm LP for NIR-II channel.
- Image Acquisition: Capture simultaneous or sequential images of the same vascular region.
- Analysis: Calculate the Full Width at Half Maximum (FWHM) of intensity profiles across identical capillaries in both channels. Compare SNR and contrast-to-noise ratio (CNR).
Protocol 2: Quantitative Measurement of Penetration Depth
- Tissue Phantom Preparation: Create a scattering phantom using Intralipid (μs' ~1 mm⁻¹) with an embedded capillary tube filled with fluorophore.
- Depth Variation: Gradually increase the overlay of phantom material or excised tissue (e.g., chicken breast) above the capillary.
- Signal Acquisition: Image the capillary through the overlay at both NIR-I and NIR-II emission wavelengths using respective cameras and filters.
- Penetration Metric: Record the maximum depth at which the capillary can be clearly resolved (SNR > 3). Plot signal intensity vs. depth for both windows and fit to an exponential decay model to extract effective attenuation coefficients.
Visualization of Key Concepts
Light-Tissue Interactions in NIR-I vs. NIR-II Windows
Workflow for Direct NIR-I/NIR-II Imaging Comparison
The Scientist's Toolkit: Essential Research Reagents & Materials
Table 3: Key Reagents and Materials for NIR-I/NIR-II Comparative Studies
| Item | Category | Function & Relevance | Example Product/Type |
|---|---|---|---|
| NIR-I Fluorophore | Imaging Agent | Baseline control for comparison; often organic dyes. | Indocyanine Green (ICG), Cy7, Alexa Fluor 790 |
| NIR-II Fluorophore | Imaging Agent | Primary agent for NIR-II imaging; inorganic or organic. | Ag2S Quantum Dots, SWCNTs, CH1055 dye, IR-1061 |
| Dual-Emissive Probe | Imaging Agent | Enables direct, same-target comparison in a single experiment. | Lanthanide-Doped Nanoparticles (e.g., NaYF₄:Yb,Er,Tm) |
| 980 nm Laser Diode | Excitation Source | Common wavelength for exciting both NIR-I and NIR-II agents. | Continuous wave or modulated laser module |
| Si CCD Camera | Detection | Standard detector for NIR-I fluorescence (≤ 1000 nm). | e.g., PCO.edge, Hamamatsu Orca-Fusion |
| InGaAs Camera | Detection | Essential detector for NIR-II light (> 1000 nm). | e.g., Princeton Instruments NIRvana, Teledyne Xenics |
| Long-Pass Filters | Optical Filter | Isolate emission signal; critical for separating NIR-I/NIR-II channels. | 850 nm LP (for NIR-I), 1100/1200/1300 nm LP (for NIR-II) |
| Tissue Phantom | Calibration Standard | Simulates tissue scattering/absorption for controlled depth studies. | Intralipid suspension, India Ink, custom PDMS phantoms |
| Athymic Nude Mouse | Animal Model | Reduces interfering hair and pigment; standard for optical imaging. | NU/J or similar strain |
The NIR-II imaging window (1000-1700 nm) represents a paradigm shift for in vivo biological imaging, offering superior optical penetration and reduced scattering and autofluorescence compared to traditional NIR-I (700-900 nm) and visible light techniques. However, the systematic quantification of its advantages—enhanced contrast, sensitivity, and temporal resolution—requires a rigorous, metrics-driven framework. This technical guide details the standardized methodologies and quantifiable metrics essential for evaluating NIR-II imaging systems and agents within preclinical research, providing a foundation for reproducible and comparable data in drug development pipelines.
The definition of the second near-infrared (NIR-II, 1000-1700 nm) window is predicated on the distinct absorption and scattering minima of biological tissues within this spectral range. Photons at these wavelengths experience significantly less scattering and minimal absorption by water and hemoglobin, leading to deeper tissue penetration, superior spatial resolution at depth, and a dramatically reduced autofluorescence background. The ultimate research thesis posits that the consistent application of standardized metrics for contrast, sensitivity, and temporal resolution is critical to objectively validate these advantages and drive the clinical translation of NIR-II imaging technologies in areas such as oncology, neurobiology, and cardiovascular disease.
Core Metrics and Quantification Frameworks
Contrast-to-Noise Ratio (CNR)
Contrast is fundamentally determined by the signal differential between a region of interest (ROI) and its surrounding background, relative to noise. In NIR-II, the primary noise source is often shot noise from the detector, as autofluorescence noise is minimal.
Definition:
CNR = |μ_ROI - μ_Background| / σ_Background
where μ is the mean signal intensity and σ is the standard deviation of the background signal.
Experimental Protocol for Vessel Imaging CNR:
- Administer an NIR-II fluorescent agent (e.g., IRDye 800CW for NIR-I control, IR-1061 or functionalized single-walled carbon nanotubes (SWCNTs) for NIR-II) intravenously to an anesthetized animal model (e.g., mouse).
- Acquire dynamic images using a calibrated NIR-II imaging system (e.g., InGaAs camera with appropriate long-pass filters) at specified time points (e.g., 1, 5, 10 min post-injection).
- Select an ROI over a major blood vessel (e.g., femoral artery) and an adjacent, vessel-free tissue region of equal area for background.
- Extract mean and standard deviation values from both ROIs using image analysis software (e.g., ImageJ, MATLAB).
- Calculate CNR for each time point and wavelength channel (e.g., 800nm vs. 1300nm).
Sensitivity: Limit of Detection (LOD)
Sensitivity defines the lowest detectable concentration of a fluorophore within a biological context. The LOD is typically defined as the concentration yielding a signal three standard deviations above the background.
Definition:
LOD = (3 * σ_Blank) / S
where σ_Blank is the standard deviation of the blank (no fluorophore) measurement, and S is the slope of the calibration curve (signal vs. concentration).
Experimental Protocol for In Vitro LOD Determination:
- Prepare a dilution series of the NIR-II fluorophore in a scattering medium (e.g., 1% Intralipid in PBS) to mimic tissue optical properties.
- Fill capillary tubes or a multi-well plate with the dilution series and a blank (scattering medium only).
- Image the samples using identical acquisition parameters (exposure time, laser power, filter set).
- Measure the mean signal intensity within a defined ROI for each concentration and the blank.
- Plot signal intensity versus concentration, perform linear regression, and calculate LOD using the formula above.
Temporal Resolution & Dynamic Imaging
Temporal resolution refers to the minimum time interval required to distinguish between sequential events. In dynamic NIR-II imaging (e.g., pharmacokinetics, brain activity), it is governed by frame rate, integration time, and the signal-to-noise ratio (SNR).
Key Metric: Minimum Resolvable Time (Δtmin) Practically, Δtmin is the inverse of the frame rate at which a defined percent change in signal intensity (ΔS/S) can be reliably detected above noise (e.g., CNR > 3). For a first-pass angiography experiment, the time-to-peak (TTP) in an arterial ROI is a critical derived parameter.
Experimental Protocol for Cerebral Hemodynamics:
- Utilize a transgenic mouse model expressing a fluorescent vascular label or administer a non-targeted NIR-II blood-pool agent.
- Secure the animal under a wide-field or confocal NIR-II microscope with a high-speed camera.
- Induce a controlled physiological challenge (e.g., temporary carotid occlusion, hypercapnia).
- Record image sequences at the maximum sustainable frame rate (e.g., 50-100 fps) with millisecond exposure times.
- Analyze time-intensity curves for specific vascular segments to extract hemodynamic parameters like TTP, mean transit time, and flow velocity.
Comparative Data: NIR-I vs. NIR-II
The following tables consolidate quantitative findings from recent literature, demonstrating the measurable advantages of the NIR-II window.
Table 1: In Vivo Contrast-to-Noise Ratio in Vascular Imaging
| Fluorophore | Imaging Window (nm) | Vessel Diameter (mm) | CNR (Mean ± SD) | Reference Model |
|---|---|---|---|---|
| IRDye 800CW | NIR-I (800) | ~0.5 | 2.1 ± 0.4 | Mouse Hindlimb |
| CH-4T | NIR-IIa (1300) | ~0.5 | 8.7 ± 1.2 | Mouse Hindlimb |
| SWCNTs | NIR-II (1500-1700) | ~0.3 | 12.5 ± 2.1 | Mouse Brain |
| Ag2S QDs | NIR-II (1200) | ~0.4 | 6.9 ± 0.8 | Mouse Ear |
Table 2: Sensitivity (Limit of Detection) of Representative Fluorophores
| Fluorophore | Type | Peak Emission (nm) | LOD in Phantom (pM) | LOD in Tissue (nM)* |
|---|---|---|---|---|
| ICG | Small Molecule | 820 | 500 | 1000 |
| IR-1061 | Small Molecule | 1060 | 80 | 150 |
| PbS Quantum Dots | Nanocrystal | 1300 | 2 | 25 |
| Er-doped Nanoparticles | Nanomaterial | 1550 | 0.5 | 10 |
*Estimated in a 2-3 mm tissue-simulating scattering medium.
Table 3: Temporal Resolution in Functional Imaging
| Imaging Modality | Wavelength (nm) | Max Frame Rate (fps) | Minimum Resolvable Δt (ms) | Measurable Dynamic Process |
|---|---|---|---|---|
| Fast Ultrasound | N/A | 500 | 2 | Blood Flow Pulse |
| Laser Speckle (NIR-I) | 850 | 100 | 10 | Cortical Blood Flow |
| Wide-field NIR-II | 1300 | 50 | 20 | First-Pass Angiography |
| Confocal NIR-II | 1550 | 5 | 200 | Tumor Accumulation Kinetics |
The Scientist's Toolkit: Research Reagent Solutions
Table 4: Essential Materials for NIR-II Imaging Experiments
| Item Name & Example | Function/Explanation |
|---|---|
| NIR-II Fluorophores: IR-1061 dye, PbS/CdSe QDs, SWCNTs, rare-earth doped nanoparticles | Emit light within the 1000-1700 nm window; the core agent for generating signal. Choice depends on brightness, stability, and functionalization needs. |
| Biological Targeting Ligands: Antibodies (anti-VEGF, anti-EGFR), Peptides (RGD, LyP-1), Aptamers | Conjugated to fluorophores to enable molecular-specific imaging of biomarkers on cells or in the extracellular matrix. |
| Scattering Phantom: Intralipid 20%, Liposyn III, microsphere suspensions | Tissue-simulating medium used for system calibration, resolution testing, and quantitative sensitivity measurements in vitro. |
| Anesthesia System: Isoflurane vaporizer with induction chamber & nose cone | Essential for humane and stable immobilization of rodent models during prolonged in vivo imaging sessions. |
| Spectral Filters: Long-pass (>1000nm, >1200nm, >1500nm) and band-pass filters | Placed before the detector to block excitation laser light and select the desired emission band, critical for reducing background. |
| Calibrated Light Source: NIR-compatible integrating sphere or standard reflectance tile | Used to perform flat-field correction and radiometric calibration of the imaging system, ensuring quantitative accuracy. |
| Image Analysis Software: ImageJ with NIR-II plugins, MATLAB, Python (OpenCV, SciPy) | For quantitative ROI analysis, signal intensity profiling, background subtraction, and kinetic modeling. |
Visualizing NIR-II Workflows and Mechanisms
NIR-II Imaging Experimental Workflow
Diagram Title: Standard Workflow for In Vivo NIR-II Imaging Experiments
Diagram Title: Key Signal and Noise Pathways in NIR-II Detection
Objective quantification through standardized metrics is non-negotiable for advancing NIR-II imaging from a promising technology to a validated tool for biomedical research and drug development. As outlined, rigorous protocols for determining CNR, LOD, and temporal resolution parameters enable direct, reproducible comparison between imaging agents, system configurations, and biological models. By adopting this metrics-focused framework, researchers can robustly substantiate the advantages of the 1000-1700 nm window, thereby accelerating its integration into studies of disease pathophysiology, therapeutic efficacy, and pharmacokinetics. The future of the field hinges on the consistent application of such quantitative benchmarks to guide the engineering of next-generation probes and imaging systems.
In the rapidly advancing field of NIR-II (1000-1700 nm) bioimaging, the translation of in vivo findings to biologically relevant conclusions necessitates rigorous validation. This guide details the critical strategies of histological correlation and ex vivo validation, framed within a thesis on defining the NIR-II imaging window. These methodologies bridge the gap between non-invasive, real-time imaging data and the ground-truth provided by cellular and molecular analysis, ensuring accuracy in preclinical research for drug development.
Core Principles of Validation in NIR-II Imaging
NIR-II imaging offers superior depth penetration and spatial resolution compared to traditional NIR-I fluorescence. However, the interpretation of signals—whether from targeted probes, perfusion agents, or metabolic markers—requires confirmation of specificity, biodistribution, and mechanistic action. Validation anchors in vivo signal intensity and localization to tangible biological structures and processes.
Strategy 1: Histological Correlation
This strategy involves the direct spatial comparison of in vivo NIR-II images with post-mortem histological sections from the same specimen.
Experimental Protocol for Correlation
- Terminal In Vivo Imaging: Perform high-resolution NIR-II imaging (e.g., 1500 nm long-pass filter) on the anesthetized animal immediately prior to sacrifice. Record exact imaging parameters (laser power, exposure, coordinates).
- Tissue Harvest and Fixation: Euthanize the subject and dissect the region of interest (ROI). Fix tissue in 4% paraformaldehyde (PFA) for 24-48 hours. For fluorescence preservation, use optimized fixatives and avoid harsh decalcification if imaging bone.
- Tissue Sectioning: Embed tissue in optimal cutting temperature (OCT) compound or paraffin. Section at 5-10 µm thickness using a cryostat or microtome.
- Histological Staining & Immunofluorescence:
- H&E Staining: Provides fundamental morphological context.
- Immunofluorescence (IF): Use antibodies specific to the expected target of the NIR-II probe (e.g., CD31 for vasculature, CD11b for immune cells). Critical: If the NIR-II probe itself is fluorescent in visible channels, this signal can be directly imaged on the section.
- Counterstaining: Use DAPI for nuclei.
- Multi-Modal Image Registration:
- Acquire high-resolution microscopy images (confocal, epifluorescence) of the histological sections.
- Use anatomical landmarks (vessel branching patterns, tissue boundaries) or fiduciary markers to digitally co-register the in vivo NIR-II image with the histological image stack using software (e.g., ImageJ with plugins, AMIRA, MATLAB).
- Quantitative Analysis: Correlate signal intensity profiles across matched regions. Calculate metrics like Pearson's correlation coefficient between NIR-II signal and immunofluorescence signal.
Table 1: Common Histological Targets for NIR-II Probe Validation
| NIR-II Probe Function | Primary Histological Target | Typical Marker | Correlation Metric |
|---|---|---|---|
| Angiography / Perfusion | Vasculature Endothelium | CD31, α-SMA | Spatial Overlap Coefficient |
| Tumor Targeting | Tumor Cell Membrane/Receptor | EGFR, HER2 | Target-to-Background Ratio |
| Immune Cell Tracking | Specific Immune Cell Population | CD11b, F4/80 (macrophages), CD3 (T-cells) | Cell-specific Signal Co-localization |
| Lymphatic Imaging | Lymphatic Endothelium | LYVE-1, Podoplanin | Vessel Tracing Accuracy |
Workflow for Histological Correlation of NIR-II Data
Strategy 2: Ex Vivo Validation
Ex vivo assays quantify probe biodistribution, specificity, and biochemical effect independently of in vivo imaging constraints.
Experimental Protocols
Protocol A: Quantitative Biodistribution
- After terminal in vivo NIR-II imaging, perfuse the animal with PBS to clear blood-pooling agents.
- Dissect and weigh all organs of interest (tumor, liver, spleen, kidney, heart, lung, muscle).
- Homogenize tissues in appropriate buffers.
- Quantify Probe Content: For fluorescent probes, measure NIR-II (or visible if applicable) fluorescence intensity in homogenates using a calibrated fluorometer or NIR-II imaging system against a standard curve. Express as percentage of injected dose per gram of tissue (%ID/g).
Protocol B: Flow Cytometry Analysis
- Generate a single-cell suspension from the harvested ROI (e.g., dissociated tumor).
- Stain cells with fluorescent antibodies for cellular markers (e.g., immune lineage, tumor antigens).
- Analyze on a Flow Cytometer: Detect the NIR-II probe signal (if it emits in a compatible channel) or a conjugated tag (e.g., Alexa Fluor 488) on the probe. Gating allows precise quantification of probe uptake by specific cell populations.
Protocol C: Western Blot / PCR for Mechanistic Validation If the NIR-II probe reports on a specific pathway (e.g., apoptosis, enzyme activity), validate the molecular outcome ex vivo.
- Lyse tissue from imaged ROIs and control tissues.
- Perform Western blot for relevant proteins (e.g., cleaved caspase-3 for apoptosis) or qPCR for gene expression changes.
- Correlate protein/gene expression levels with the in vivo NIR-II signal intensity.
Table 2: Ex Vivo Validation Methods and Outputs
| Method | Primary Readout | Key Metric | Role in Validation |
|---|---|---|---|
| Biodistribution | Absolute probe quantity in tissues | %ID/g, Target-to-Off-Target Ratio | Confirms pharmacokinetics & targeting efficiency |
| Flow Cytometry | Probe uptake by specific cell subtypes | % Positive Cells, Mean Fluorescence Intensity (MFI) | Establishes cellular specificity of signal |
| Western Blot / qPCR | Expression level of target protein or related genes | Fold-change vs. Control | Validates molecular mechanism of activity-based probes |
| Autoradiography* | Spatial distribution of radiolabeled probes | Signal intensity distribution | Gold-standard spatial correlation for radiolabeled analogs |
*If the NIR-II probe has a radiolabeled analog.
Integrated Ex Vivo Validation Strategy
The Scientist's Toolkit: Research Reagent Solutions
Table 3: Essential Materials for NIR-II Validation Studies
| Item / Reagent | Function in Validation |
|---|---|
| NIR-II Imaging System | Equipped with 1000-1700 nm detection; provides the primary in vivo data to be validated. |
| Tissue-Specific Antibodies (e.g., anti-CD31, anti-F4/80) | For immunofluorescence staining to identify biological structures for correlation. |
| Fluorophore-Conjugated Secondary Antibodies (visible range) | To visualize primary antibody binding on histological sections. |
| Optimal Cutting Temperature (OCT) Compound | For embedding tissues for cryosectioning, preserving fluorescence. |
| Cell Dissociation Kits (e.g., tumor dissociation) | To generate single-cell suspensions for flow cytometric analysis. |
| Fluorescent Cell Barcoding Kits | To enable multiplexed flow cytometry analysis from multiple samples. |
| RIPA Lysis Buffer & Protease Inhibitors | For protein extraction from tissues for Western blot analysis. |
| Calibrated NIR-II Fluorescence Standards | (e.g., IR-26 dye in capillary tubes) to standardize imaging and ex vivo fluorescence measurements across experiments. |
| Image Co-Registration Software (e.g., ImageJ, AMIRA) | Essential digital tool for aligning in vivo and histological images. |
Data Integration and Interpretation
Successful validation is achieved when a coherent narrative emerges from multiple lines of evidence. For instance, an in vivo NIR-II signal increase in a tumor should correlate spatially with hypoxic regions (pimonidazole stain on histology), show high probe concentration via biodistribution (%ID/g), and be localized to tumor-associated macrophages via flow cytometry, while corresponding molecular markers (HIF-1α via Western blot) are upregulated.
Within NIR-II imaging research, histological correlation and ex vivo validation are not ancillary techniques but foundational components of rigorous experimental design. They transform compelling in vivo images into quantifiable, biologically verified data, thereby building the credibility required for translational drug development. A multi-modal validation strategy, integrating spatial, quantitative, and molecular techniques, is paramount for defining the specific utility and limitations of novel NIR-II imaging windows and probes.
Within the broader thesis defining the NIR-II imaging window (1000-1700 nm), this technical guide examines the fundamental constraints that currently limit the translation of this powerful modality from benchtop research to widespread clinical and drug development application. While NIR-II imaging offers superior resolution, deeper penetration, and reduced autofluorescence compared to traditional NIR-I, its adoption is governed by significant technical trade-offs.
Core Technical Constraints and Quantitative Analysis
The following tables summarize the primary limitations across key system components.
Table 1: Detector Constraints and Performance Trade-offs
| Detector Type | Quantum Efficiency (QE) at 1550 nm (%) | Typical Dark Current (e-/pixel/s) | Cooling Requirement | Cost Grade | Primary Limitation |
|---|---|---|---|---|---|
| InGaAs (Standard) | 70-85 | 1000-5000 | Thermoelectric (TE) | High | High dark current, limited array size (e.g., 640x512) |
| InGaAs (Low-noise) | 60-75 | 50-200 | Cryogenic (77K) | Very High | Cost, system complexity, cooling overhead |
| Extended InGaAs | 40-60 (up to 2.6 µm) | 5000+ | TE or Cryo | Very High | Lower QE, higher cost, specialized only |
| Ge-on-CMOS | 20-35 (up to 1.6 µm) | 100-500 | TE | Medium | Low QE, small/developing arrays |
| SWIR Si-based (Emerging) | <10 (at 1300 nm) | Variable | None | Low-Medium | Very low QE, performance drop >1000 nm |
Table 2: Fluorophore & Contrast Agent Trade-offs
| Agent Class | Peak Emission (nm) | Quantum Yield (QY) in H₂O (%) | Extinction Coefficient (M⁻¹cm⁻¹) | Typical Hydrodynamic Size (nm) | Key Limitation(s) |
|---|---|---|---|---|---|
| Single-Wall Carbon Nanotubes (SWCNTs) | 1000-1600 | 0.1-5 | ~10⁵ (per mg/L) | 200-1000 (length) | Polydispersity, complex functionalization, potential toxicity concerns |
| Rare-Earth Doped Nanoparticles | 980, 1064, 1530 | 1-20 | ~10³-10⁴ | 10-100 | Low absorption cross-section, potential metal ion leaching |
| Organic Dyes (e.g., CH-4T, IR-1061) | 900-1200 | 0.1-2 | ~10⁴-10⁵ | <2 | Rapid photobleaching, aggregation-caused quenching (ACQ), poor aqueous solubility |
| Lead Sulfide Quantum Dots (PbS QDs) | 1200-1600 | 10-30 (in organic solvent) | ~10⁵-10⁶ | 5-10 | Heavy metal toxicity, instability in biological media, blue-shift in water |
| Ag₂S Quantum Dots | 1050-1300 | 5-15 | ~10⁴ | 3-8 | Lower brightness vs. PbS, complex synthesis reproducibility |
| Genetically Encoded Proteins (e.g., iRFP) | ~713 (NIR-I) | <10 | ~10⁵ | N/A | Peak emission in NIR-I, limiting NIR-II utility; low photon flux |
Detailed Experimental Protocols for Key Constraint Analysis
Protocol 1: Standardized Measurement of Fluorophore Signal-to-Background Ratio (SBR) in Tissue Phantoms Objective: Quantify the core performance trade-off between brightness and tissue penetration for candidate NIR-II fluorophores.
Materials:
- NIR-II fluorophore stock solutions (e.g., PbS QDs, organic dye, SWCNT dispersion).
- Liquid tissue phantom: 1% Intralipid in PBS (scattering coefficient µs' ≈ 1.0 mm⁻¹).
- Capillary tubes (inner diameter: 1 mm).
- NIR-II imaging system with consistent laser excitation (e.g., 808 nm or 980 nm) and InGaAs camera.
- Calibrated optical power meter.
Procedure: a. Prepare serial dilutions of each fluorophore in phantom solution to achieve a range of concentrations (e.g., 10 nM to 1 µM for dyes/QDs). b. Load each dilution into a capillary tube, sealing both ends. c. Immerse capillaries at defined depths (0.5, 1, 2, 3, 5 mm) in a cuvette filled with the plain phantom solution. d. Acquire images using fixed system parameters: laser power (100 mW/cm²), exposure time (100 ms), focus on capillary plane. e. Measure mean signal intensity (Isignal) within a region-of-interest (ROI) on the capillary. f. Measure mean background intensity (Ibg) from an adjacent phantom-only ROI. g. Calculate SBR = (Isignal - Ibg) / I_bg for each depth and concentration. h. Plot SBR vs. depth and fit exponential decay to extract the "effective penetration depth" (depth where SBR = 1).
Protocol 2: In Vivo Quantification of Detector Noise Contribution Objective: Isolate and measure the impact of detector dark current and read noise on in vivo imaging sensitivity.
Materials:
- Mouse model (e.g., tumor xenograft).
- NIR-II fluorophore (e.g., IRDye 1061 conjugated to a targeting antibody).
- NIR-II imaging system with temperature-controlled InGaAs camera.
- Blackbody radiation source for calibration.
Procedure: a. Administer the contrast agent intravenously and allow for biodistribution (e.g., 24-48 hrs). b. Anesthetize the mouse and position it on the imaging stage. c. Dark Frame Acquisition: Cap the camera lens and acquire 100 consecutive frames (same exposure as used for imaging, e.g., 50 ms). Calculate the mean dark frame (D) and its standard deviation (σdark), which represents read + dark current noise. d. In Vivo Image Acquisition: Acquire 100 consecutive frames of the mouse under 808 nm excitation. e. Image Processing: i. Subtract the mean dark frame (D) from each in vivo frame. ii. For each pixel, calculate the temporal standard deviation over the 100-frame stack (σtotal). iii. The shot noise (σshot) is estimated as the square root of the dark-subtracted signal. iv. The empirical read/dark noise is σdark. The "Noise Contribution Ratio" (NCR) can be calculated for an ROI over the target as: NCR = σ_dark / mean(signal in ROI). An NCR > 0.1 indicates detector noise significantly degrades the detectable signal.
Visualizing Technical Pathways and Workflows
Diagram Title: NIR-II Imaging Design Trade-off Pathways
Diagram Title: NIR-II Imaging Chain with Key Constraints
The Scientist's Toolkit: Essential Research Reagent Solutions
Table 3: Key Research Reagents and Materials for NIR-II Constraint Studies
| Item | Primary Function & Relevance to Constraints | Example Product/Type |
|---|---|---|
| Intralipid 20% | Forms standardized tissue-mimicking phantoms for quantifying scattering and attenuation, essential for penetration depth studies. | Fresenius Kabi Intralipid |
| IRDye 1061/1405 | Benchmark small organic dye for NIR-II; used to study limitations of organic fluorophores (photobleaching, solubility). | LI-COR Biosciences |
| PEGylated PbS/CdS Core/Shell QDs | High-brightness, water-soluble nanoparticle; model system for studying toxicity vs. performance trade-off. | Prepared in-house or from Nanotech vendors (e.g., NN-Labs) |
| DSPE-PEG(2000)-COOH | Standard phospholipid-PEG for nanoparticle encapsulation and functionalization; critical for studying biocompatibility and pharmacokinetics. | Avanti Polar Lipids 880125 |
| Indocyanine Green (ICG) | Clinically approved NIR-I dye with a tail into NIR-II; used as a control for comparing NIR-I vs. NIR-II performance. | Diagnostic Green, Inc. |
| SWCNT (HiPco, (6,5) chirality) | Single-chirality nanotubes for studying narrowband NIR-II emission; model for complex nanomaterial behavior and functionalization challenges. | NanoIntegris (RayTubes) or Sigma-Aldrich |
| Matrigel (Growth Factor Reduced) | For creating subcutaneous tumor xenografts in mice, providing a realistic in vivo environment to test agent extravasation and targeting. | Corning 356231 |
| NIR-II Calibration Target | A physical standard with known reflectivity/emission across NIR-II; essential for system performance validation and cross-study comparison. | Lab-made (e.g., rare-earth ceramic) or commercial reflectance standards. |
The advancement of NIR-II imaging within the 1000-1700 nm window is a continuous process of balancing interdependent technical constraints. The trade-offs between fluorophore brightness and biocompatibility, detector performance and cost, and system complexity versus robustness define the current frontier. A clear understanding of these limitations, as quantified by standardized protocols, is essential for researchers and drug developers to design effective studies and accurately interpret data, paving the way for targeted innovations that will overcome these barriers.
Near-infrared window II (NIR-II, 1000-1700 nm) fluorescence imaging has revolutionized in vivo biological visualization by offering deeper tissue penetration and higher spatial resolution compared to traditional NIR-I (700-900 nm) imaging. This whitepaper frames the NIR-IIb sub-window (1500-1700 nm) as the pinnacle of this technological evolution. Within the broader thesis of NIR-II (1000-1700 nm) research, the NIR-IIb region stands out due to dramatically reduced photon scattering and near-zero autofluorescence, enabling unprecedented clarity for deep-tissue imaging and high-fidelity biological sensing.
Quantitative Superiority of NIR-IIb: A Data-Driven Analysis
The performance advantages of NIR-IIb imaging are quantifiable across multiple metrics. The following tables consolidate key comparative data.
Table 1: Optical Property Comparison Across Imaging Windows
| Property | NIR-I (700-900 nm) | NIR-IIa (1300-1400 nm) | NIR-IIb (1500-1700 nm) |
|---|---|---|---|
| Typical Scattering Coefficient (μs') | High (~0.7 mm⁻¹) | Moderate (~0.3 mm⁻¹) | Very Low (~0.1 mm⁻¹) |
| Autofluorescence Level | Very High | Low | Negligible |
| Tissue Penetration Depth | 1-3 mm | 3-6 mm | 5-10+ mm |
| Spatial Resolution (FFD) | ~40 μm | ~25 μm | ~10-15 μm |
| Signal-to-Background Ratio (SBR) | Low (< 10) | Good (10-100) | Excellent (100-1000+) |
Table 2: Performance Metrics of Representative NIR-IIb Emitters
| Emitter Type | Peak Emission (nm) | Quantum Yield (%) | Brightness (ε × QY) | Key Application Demonstrated |
|---|---|---|---|---|
| PbS/CdS Core/Shell QDs | 1550 | ~12 | ~2.4 x 10⁴ M⁻¹cm⁻¹ | Cerebral vasculature imaging |
| Er³⁺-doped Nanoparticles | 1530 | ~0.1 | N/A (power-dependent) | Lymph node mapping |
| Organic Dye (CH-4T) | 1650 | 0.17 | ~336 M⁻¹cm⁻¹ | Bone fracture detection |
| Single-Walled Carbon Nanotubes | 1500-1700 | 0.1-1 | Varies | Tumor angiography |
Detailed Experimental Protocols
Protocol 1: High-Resolution Cerebral Vasculature Imaging in NIR-IIb
- Objective: To visualize the mouse cerebral vasculature with capillary-level resolution.
- Materials: See "The Scientist's Toolkit" below.
- Method:
- Nanoparticle Administration: Intravenously inject 200 µL of PEG-coated PbS/CdS QDs (1 µM in PBS) into an anesthetized mouse.
- Instrument Setup: Use a 2D InGaAs camera with cooled sensitivity to 1700 nm. Equip with a 1500 nm long-pass filter to block excitation and shorter NIR wavelengths. Use a 1064 nm continuous-wave laser for excitation.
- Image Acquisition: Position the mouse under the imaging system. Set laser power density to 100 mW/cm². Acquire dynamic image sequences at 5-10 frames per second for 5-10 minutes post-injection.
- Data Processing: Use time-gated or intensity-thresholding software to generate maximum intensity projections (MIPs) and 3D reconstructions of the vascular network.
Protocol 2: Quantifying Signal-to-Background Ratio (SBR) in Different Windows
- Objective: To empirically compare SBR for the same probe across NIR-IIa and NIR-IIb channels.
- Method:
- Dual-Channel Imaging: Image the same animal model (e.g., tumor-bearing mouse with targeted probe) using two distinct emission filters: a 1300/100 nm bandpass (NIR-IIa) and a 1550/100 nm bandpass (NIR-IIb).
- Region-of-Interest (ROI) Analysis: Define ROIs for the target signal (e.g., tumor) and an adjacent background tissue region.
- Calculation: Calculate mean fluorescence intensity for target (Isignal) and background (Ibackground). SBR = Isignal / Ibackground. Consistently higher SBR is observed in the NIR-IIb channel.
Visualizing Workflows and Principles
Title: NIR-IIb Photon Path Advantage vs. Shorter Wavelengths
Title: Standard In Vivo NIR-IIb Imaging Workflow
The Scientist's Toolkit: Essential Research Reagents & Materials
| Item | Function/Benefit | Example/Note |
|---|---|---|
| NIR-IIb Fluorophores | Core imaging agent emitting in 1500-1700 nm range. | Lead Chalcogenide QDs (PbS, PbSe), Erbium-doped nanoparticles, specific organic dyes (e.g., CH-series). |
| Bioconjugation Reagents | For functionalizing probes with targeting ligands (antibodies, peptides). | NHS-PEG-Maleimide linkers, click chemistry kits (DBCO, Azide). |
| 1064 nm CW Laser | Standard excitation source for NIR-II probes; minimal tissue heating. | Power-adjustable, fiber-coupled for precise illumination. |
| Cooled InGaAs Camera | Detector sensitive from 900-1700 nm; cooling reduces dark noise. | Requires 2D array with >70% QE at 1550 nm. |
| 1500 nm Long-Pass Filter | Critically blocks excitation light and all emission below 1500 nm. | Essential for pure NIR-IIb imaging. High optical density (OD >5). |
| Dedicated Imaging Software | For acquisition control, spectral unmixing, 3D rendering, and quantitative analysis. | Often provided by camera vendor; options include ImageJ with NIR plugins. |
| Phantom Materials | For system calibration and resolution testing (e.g., USAF target embedded in tissue phantom). | Intralipid solutions, agarose, or epoxy resins with specific scattering properties. |
| Anesthesia System | For prolonged, stable in vivo imaging sessions in rodent models. | Isoflurane vaporizer with nose cone, heating pad for physiological maintenance. |
Conclusion
The NIR-II imaging window (1000-1700 nm) represents a significant leap forward for in vivo optical bioimaging, offering unparalleled depth, clarity, and quantitative potential for biomedical research. By understanding its foundational principles, implementing robust methodological protocols, proactively troubleshooting experimental hurdles, and rigorously validating performance against established modalities, researchers can fully harness its power. The future of NIR-II imaging is poised for clinical translation, driven by advances in biocompatible probe development, compact laser/detector technology, and sophisticated data analysis algorithms. This will accelerate drug discovery, enable precise image-guided surgery, and open new windows into real-time physiological and pathological processes, fundamentally enhancing our capacity for diagnosis and therapeutic intervention.