NIR-II vs. NIR-I Windows: A Comprehensive Guide to Superior Signal-to-Background Ratio for In Vivo Imaging
This review provides a thorough analysis of the signal-to-background ratio (SBR) advantages of the second near-infrared window (NIR-II, 1000-1700 nm) over the traditional NIR-I window (700-900 nm) for in vivo...
NIR-II vs. NIR-I Windows: A Comprehensive Guide to Superior Signal-to-Background Ratio for In Vivo Imaging
Abstract
This review provides a thorough analysis of the signal-to-background ratio (SBR) advantages of the second near-infrared window (NIR-II, 1000-1700 nm) over the traditional NIR-I window (700-900 nm) for in vivo biomedical imaging. We explore the foundational physics of photon-tissue interactions, detail cutting-edge methodologies and probes, offer practical troubleshooting for SBR optimization, and present a critical validation of NIR-II's superior performance through direct comparative studies. Aimed at researchers, scientists, and drug development professionals, this article serves as a practical guide for selecting and implementing the optimal optical window for deep-tissue, high-contrast imaging applications.
Unlocking the Physics: Why NIR-II Light Offers a Clearer Path Through Tissue
In vivo fluorescence imaging leverages specific near-infrared (NIR) spectral windows where biological tissues exhibit reduced scattering and absorption, allowing deeper penetration and higher-resolution imaging. The choice between the traditional first NIR window (NIR-I, 700-900 nm) and the emerging second window (NIR-II, 1000-1700 nm) is critical for optimizing signal-to-background ratio (SBR) in research. This guide compares the fundamental performance characteristics of these windows, focusing on key parameters that impact preclinical and translational research.
Performance Comparison: NIR-I vs. NIR-II
Table 1: Optical Properties and Performance Metrics
| Parameter | NIR-I (700-900 nm) | NIR-II (1000-1700 nm) | Experimental Support |
|---|---|---|---|
| Tissue Absorption | Higher (Hb, HbO₂, H₂O) | Lower (Minimal by Hb/HbO₂) | Measured reduced absorption coefficient (μa) by spectrophotometry. |
| Tissue Scattering | Higher (Mie & Rayleigh) | Reduced (∼λ^−α dependence) | Calculated reduced scattering coefficient (μs') shows ~3-5x decrease in NIR-II. |
| Autofluorescence | Significant from biomolecules (e.g., flavins) | Greatly diminished | Spectrofluorometry of tissues ex vivo shows >10x lower background in NIR-II. |
| Typical Penetration Depth | 1-3 mm | 3-10 mm | Phantom and in vivo mouse studies using imaging depth of standardized signal. |
| Optimal Resolution (in tissue) | ~3-5 mm | ~1-3 mm | Resolution chart imaging through tissue slabs; FWHM of point spread function. |
| Maximum SBR (in vivo) | Moderate (e.g., 5-20) | High (e.g., 30-100+) | Comparative imaging of mouse vasculature with same dye (e.g., IRDye 800CW vs. IR-12N3). |
Table 2: Common Probe and Instrumentation Characteristics
| Aspect | NIR-I | NIR-II & Beyond (e.g., NIR-IIa, 1300-1400 nm) |
|---|---|---|
| Common Fluorophores | ICG, Cy7, Alexa Fluor 790, Quantum Dots (QD800) | Carbon nanotubes, Ag₂S QDs, rare-earth NPs, organic dyes (e.g., CH-4T) |
| Detection Technology | Silicon CCD/CMOS (high QE) | InGaAs or cooled InGaAs detectors (lower QE, higher cost) |
| Laser Excitation | 670-785 nm diodes common | 808 nm, 980 nm, or 1064 nm lasers for deeper penetration |
| Key Advantage | Established, cost-effective instruments | Superior SBR and resolution for deep-tissue imaging |
Experimental Protocols for Key Comparisons
Protocol 1: Quantifying Tissue Optical Properties
Objective: Measure absorption (μa) and reduced scattering (μs') coefficients across NIR-I and NIR-II. Method:
- Prepare thin slices (e.g., 1 mm) of tissue of interest (e.g., mouse skin, muscle, brain).
- Use a spectrophotometer with an integrating sphere to measure total transmission (T) and reflection (R) from 650 nm to 1700 nm.
- Apply the inverse adding-doubling algorithm to T and R data to calculate μa and μs'.
- Plot wavelength dependence for direct comparison of windows.
Protocol 2: In Vivo SBR Measurement for Vascular Imaging
Objective: Compare SBR of vasculature using a dye emitting in both windows. Method:
- Animal Model: Anesthetize a nude mouse.
- Dye Injection: Adminstrate a single dose (e.g., 200 µL of 100 µM) of a dual-emission probe (e.g., a QD with emission at 850 nm and 1300 nm) via tail vein.
- Imaging Setup:
- NIR-I: Use a 785 nm laser for excitation, 800 nm long-pass emission filter, and a silicon camera.
- NIR-II: Use a 808 nm laser, a 1000 nm long-pass filter, and an InGaAs camera.
- Keep laser power density and field of view identical.
- Image Analysis:
- Draw regions of interest (ROIs) over a major blood vessel (Signal) and adjacent tissue (Background).
- Calculate mean intensity for each ROI.
- Compute SBR = (Mean Signal Intensity – Mean Background Intensity) / Mean Background Intensity.
- Statistical Analysis: Repeat across multiple animals (n≥5) and perform a paired t-test.
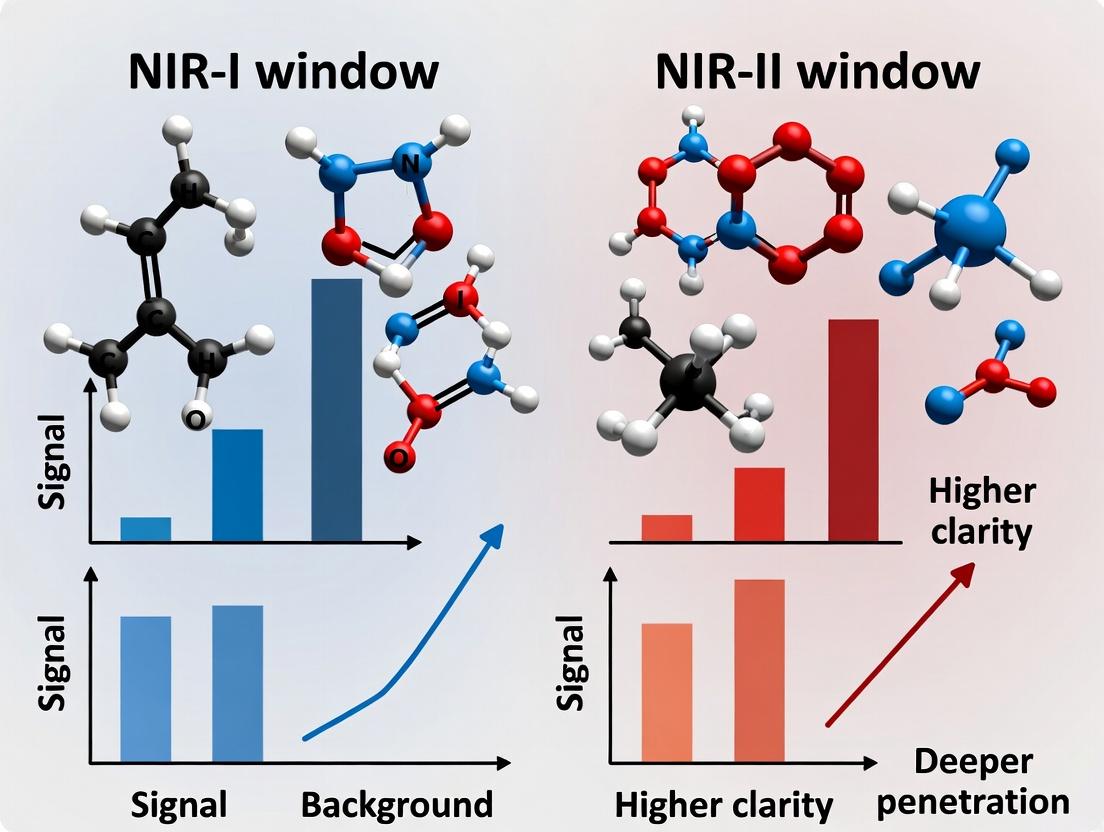
Visualization of Key Concepts
Title: Photon-Tissue Interaction Determines SBR
Title: Comparative In Vivo SBR Experiment Workflow
The Scientist's Toolkit: Research Reagent & Material Solutions
Table 3: Essential Materials for NIR-I/NIR-II Comparative Studies
| Item | Function & Relevance |
|---|---|
| Indocyanine Green (ICG) | FDA-approved NIR-I dye (peak ~820 nm); baseline for vascular imaging and perfusion studies. |
| IR-12N3 or CH-4T Dyes | Representative small-molecule organic dyes emitting in NIR-II (1000-1300 nm) for high-SBR imaging. |
| PEG-coated Ag₂S Quantum Dots | Biocompatible NIR-II probes (emitting ~1200 nm) with high quantum yield for long-term imaging. |
| Anesthesia System (Isoflurane) | Essential for maintaining animal viability and immobility during longitudinal in vivo imaging sessions. |
| Sterile PBS | Vehicle for dye dilution and intravenous injection; control for flushing lines. |
| NIR-I Imager (Si-based) | System with 670-785 nm excitation and 800-900 nm emission filters for standard NIR-I data. |
| NIR-II Imager (InGaAs) | System with 808/980 nm excitation and 1000 nm LP or spectral filters for NIR-II data collection. |
| Image Analysis Software (e.g., ImageJ, Living Image) | For standardizing ROI selection, intensity measurement, and SBR calculation across datasets. |
| Tissue Phantom Kit (Lipid-based) | Mimics tissue scattering/absorption for system calibration and protocol validation before in vivo use. |
A central thesis in modern bioimaging is the superior signal-to-background ratio (SBR) achievable in the second near-infrared window (NIR-II, 1000-1700 nm) compared to the traditional first window (NIR-I, 700-900 nm). This guide compares the performance of imaging agents and systems across these spectral regions, grounded in the physics of photon scattering and absorption by biological tissue. Reduced scattering and lower autofluorescence in NIR-II lead to deeper penetration and clearer images, a critical factor for researchers and drug development professionals.
Performance Comparison: NIR-I vs. NIR-II Imaging Agents
The following table summarizes key performance metrics for representative fluorophores in each window, based on recent experimental studies.
Table 1: Comparative Performance of Fluorophores in NIR-I vs. NIR-II Windows
| Parameter | NIR-I Example: ICG | NIR-II Example: IRDye 800CW | NIR-II Example: PbS Quantum Dots | NIR-II Example: Single-Wall Carbon Nanotubes |
|---|---|---|---|---|
| Peak Emission (nm) | ~820 nm | ~800 nm | ~1300 nm | ~1550 nm |
| Tissue Penetration Depth | 1-3 mm | 1-4 mm | 4-8 mm | 5-10 mm |
| Measured SBR (in vivo, 3-4mm depth) | 2-5 | 3-8 | 15-40 | 30-100 |
| Photostability | Moderate (photobleaching) | Moderate | High | Very High |
| Relative Autofluorescence | High | High | Very Low | Negligible |
| Key Advantage | FDA-approved, clinical use | Well-characterized chemistry | Tunable emission, bright | Ultra-stable, deep penetration |
| Primary Limitation | Rapid clearance, aggregation | Still significant scattering | Potential long-term toxicity | Complex functionalization |
Experimental Protocols for Key Comparisons
The cited data in Table 1 derive from standard in vivo imaging protocols.
Protocol 1: Quantifying Signal-to-Background Ratio (SBR) in Mouse Models
- Animal Preparation: Anesthetize a nude mouse and place it in a prone position on a warming stage.
- Agent Administration: Intravenously inject a standardized dose (e.g., 200 µL of 100 µM solution) of the NIR-I or NIR-II fluorophore via the tail vein.
- Imaging Setup:
- For NIR-I: Use a 785 nm laser for excitation. Collect emission with a silicon CCD camera fitted with an 830 nm long-pass filter.
- For NIR-II: Use a 808 nm or 980 nm laser for excitation. Collect emission with an InGaAs camera fitted with appropriate long-pass filters (e.g., 1000 nm, 1200 nm, or 1500 nm).
- Data Acquisition: Capture time-series images over 60 minutes post-injection.
- Analysis: Define a region of interest (ROI) over a deep tissue target (e.g., tumor or vessel). Define a background ROI in adjacent tissue without major vessels. Calculate SBR as
(Mean Signal Intensity in Target ROI) / (Mean Signal Intensity in Background ROI)at the time point of peak contrast.
Protocol 2: Measuring Tissue Penetration Depth
- Phantom Construction: Create a tissue-simulating phantom using intralipid (scattering agent) and india ink (absorption agent) in agarose, calibrated to mimic murine tissue optical properties (µs', µa).
- Capillary Tube Embedment: Fill a thin glass capillary with fluorophore solution. Embed it at known, increasing depths (0-10 mm) within the phantom.
- Imaging: Image the phantom using the NIR-I and NIR-II systems as described in Protocol 1.
- Analysis: Plot detected fluorescence intensity versus capillary depth. Define penetration depth as the depth where the signal intensity drops to 1/e (~37%) of its surface value.
Visualizing Photon-Tissue Interactions & Experimental Workflow
The Scientist's Toolkit: Essential Research Reagents & Materials
Table 2: Key Reagents and Materials for NIR Window Imaging Studies
| Item | Function & Relevance | Example Specifications/Notes |
|---|---|---|
| NIR-I Fluorophore (e.g., ICG) | Clinical standard for comparison; establishes baseline SBR in 700-900 nm range. | Indocyanine Green, sterile powder. Requires fresh DMSO/saline solution. |
| NIR-II Fluorophore (e.g., Organic Dye) | Demonstrates improved performance in 1000-1400 nm window. | IR-1061, CH-4T, or commercial dyes (e.g., FCIE). Requires specific conjugation chemistry. |
| NIR-II Nanomaterial (e.g., Quantum Dots) | High brightness, tunable emission for optimal tissue penetration studies. | PbS/CdS Core/Shell QDs, emission 1200-1600 nm. Requires biocompatible coating. |
| InGaAs Camera | Essential detector for NIR-II light; sensitivity from 900-1700 nm. | Requires thermoelectric or deep cooling to reduce dark noise. Key specification: Quantum Efficiency > 70% at 1500 nm. |
| Silicon CCD Camera | Standard detector for NIR-I imaging. | Used for direct comparative studies with NIR-II systems on the same subject. |
| Dedicated NIR Laser Diodes | Provides precise excitation for fluorophores. | 785 nm (NIR-I), 808 nm (dual-use), 980 nm & 1064 nm (optimal for NIR-II). Laser fluence must be within safety limits. |
| Long-Pass & Band-Pass Filters | Isolates emission signal and blocks laser light. | Critical for SBR. NIR-II requires specialized filters (e.g., 1000LP, 1250LP, 1500LP) made of materials like germanium-coated glass. |
| Tissue Phantom Kit | Validates system performance and quantifies penetration depth theoretically. | Includes lipid scatterers (Intralipid), absorbers (India Ink), and agarose for solid phantoms. |
| Animal Model (e.g., Nude Mouse) | Standard in vivo model for optical imaging due to low endogenous melanin interference. | Requires IACUC protocol. Tumor models (e.g., 4T1, U87-MG) are common for targeted agent studies. |
In the evolving landscape of in vivo optical imaging, the Signal-to-Background Ratio (SBR) stands as the paramount metric for quantifying imaging fidelity. It is defined as the ratio of the target signal intensity to the average intensity of the surrounding, non-specific background. A higher SBR directly correlates with greater image clarity, improved detection sensitivity, and more accurate quantification of biological targets. This comparison guide contextualizes SBR within the pivotal debate of NIR-I (750-900 nm) versus NIR-II (1000-1700 nm) imaging windows, presenting objective experimental data to guide researcher selection.
The NIR-I vs. NIR-II SBR Paradigm: A Quantitative Comparison
The core thesis is that reduced photon scattering and minimized tissue autofluorescence in the NIR-II window fundamentally enhance SBR compared to the traditional NIR-I window. The following table synthesizes key comparative data from recent studies.
Table 1: Comparative Performance of NIR-I vs. NIR-II Imaging Windows In Vivo
| Metric | NIR-I Window (750-900 nm) | NIR-II Window (1000-1700 nm) | Experimental Basis |
|---|---|---|---|
| Tissue Scattering | High | Significantly Reduced (≈ λ^-0.2 to λ^-4 dependence) | Measured by modulation transfer function and spatial resolution phantoms. |
| Autofluorescence | High (from biomolecules like flavins) | Negligible above 1100 nm | Spectral unmixing of control animals without contrast agents. |
| Typical SBR | Moderate (2-5 fold in deep tissue) | High (5-15+ fold improvement over NIR-I) | Calculated from region-of-interest analysis of tumor vs. muscle. |
| Penetration Depth | ~1-3 mm for high resolution | ~3-8 mm for high resolution | Measurement of detectable signal through tissue-mimicking phantoms or skull. |
| Spatial Resolution | Degrades rapidly with depth (~10 μm subsurface, ~100 μm at 2mm) | Maintains superior resolution at depth (∼20-40 μm at 2-3mm) | Full-width half-maximum (FWHM) of fluorescent beads in vasculature imaging. |
| Blood Background | Significant due to hemoglobin absorption | Lower absorption, enables high-resolution angiography | Contrast-to-noise ratio (CNR) calculations in cerebral vasculature. |
Detailed Experimental Protocols
Protocol 1: Comparative SBR Measurement of a Targeted Agent in a Murine Tumor Model
- Objective: To quantify the SBR difference for the same targeting ligand conjugated to NIR-I (e.g., Cy7) vs. NIR-II (e.g., IRDye 12.5kDa) fluorophores.
- Materials: 4T1 tumor-bearing mice (n=5 per group), anti-EGFR antibody-Cy7 conjugate, anti-EGFR antibody-IRDye conjugate, IVIS Spectrum/ NIR-II imaging system.
- Method:
- Inject each group with an equimolar amount (3 nmol) of the respective conjugate via tail vein.
- Acquire whole-body fluorescence images at 1, 4, 24, 48, and 72 hours post-injection.
- For NIR-I, use 745 nm excitation / 800 nm emission filters. For NIR-II, use 808 nm excitation / 1300 nm long-pass collection.
- Draw regions of interest (ROIs) over the tumor and a contralateral muscle site.
- Calculate SBR at each time point:
SBR = (Mean Tumor Signal Intensity) / (Mean Muscle Background Intensity).
- Key Data Output: A time-SBR curve demonstrating the peak and persistence of SBR for each window.
Protocol 2: Resolution & Background Assessment via Intracranial Vasculature Imaging
- Objective: To visualize the impact of reduced scattering and autofluorescence on imaging clarity.
- Materials: C57BL/6 mice (n=3), IRDye QC-1 (non-targeted NIR-II dye), Indocyanine Green (ICG, NIR-I dye), Skull-thinned cranial window model.
- Method:
- Prepare a cranial window by thinning the skull to ~50 μm thickness.
- Inject 200 μL of dye solution (ICG or IRDye QC-1) via tail vein.
- Image immediately (for angiography) using respective NIR-I/NIR-II settings.
- Quantify the Contrast-to-Noise Ratio (CNR) in a defined capillary region:
CNR = (Signal_vesel - Signal_background) / SD_background. - Measure the FWHM of intensity profiles across selected capillaries to quantify resolution.
- Key Data Output: High-resolution vascular maps and quantitative CNR/FWHM values comparing clarity and resolvable feature size.
Visualizing the SBR Advantage in NIR-II Imaging
Diagram 1: Factors determining SBR in NIR-I vs. NIR-II imaging.
Diagram 2: SBR formation from in vivo agent biodistribution.
The Scientist's Toolkit: Key Research Reagent Solutions
Table 2: Essential Materials for NIR SBR Research
| Item | Function | Example Types |
|---|---|---|
| NIR-I Fluorophores | Generate signal within the 750-900 nm window for comparison. | Cy7, ICG, Alexa Fluor 800, IRDye 800CW |
| NIR-II Fluorophores | Generate signal in the 1000-1700 nm window with reduced scattering/autofluorescence. | Organic dyes (CH-4T, FD-1080), Quantum Dots (Ag2S, PbS), Single-Walled Carbon Nanotubes (SWCNTs), Rare-Earth Nanoparticles |
| Targeting Ligands | Provide specificity to biological targets (e.g., tumors, vasculature). | Antibodies, Peptides, Aptamers, Small Molecules (Folate) |
| Animal Disease Models | Provide a physiological context for SBR measurement. | Subcutaneous tumor xenografts, Orthotopic models, Genetic disease models, Inflammation models |
| Multispectral Imagers | Acquire fluorescence data across NIR-I and NIR-II windows. | IVIS Spectrum CT, Bruker In-Vivo Xtreme, Custom NIR-II setups with InGaAs cameras |
| Image Analysis Software | Quantify signal intensity, draw ROIs, and calculate SBR/CNR metrics. | Living Image, ImageJ/Fiji, MATLAB, Python (scikit-image) |
| Tissue Phantoms | Calibrate systems and model tissue scattering/absorption properties. | Intralipid phantoms, Agarose-based phantoms with India ink |
Thesis Context
In vivo fluorescence imaging is a cornerstone of modern biological and pharmacological research. The core thesis differentiating the NIR-I (750-900 nm) and NIR-II (1000-1700 nm) spectral windows hinges on the fundamental improvement in signal-to-background ratio (SBR). This enhancement is not merely incremental but transformative, primarily rooted in two interconnected physical phenomena: significantly reduced scattering of longer wavelength photons and a drastic decrease in endogenous tissue autofluorescence. This guide objectively compares the performance of imaging in these two windows, supported by experimental data.
Performance Comparison: NIR-I vs. NIR-II
Table 1: Quantitative Comparison of Key Optical Properties
| Parameter | NIR-I Window (e.g., 800 nm) | NIR-II Window (e.g., 1300 nm) | Improvement Factor | Supporting Experiment Reference |
|---|---|---|---|---|
| Tissue Scattering Coefficient (μs') | ~0.5-1.0 mm⁻¹ | ~0.1-0.3 mm⁻¹ | ~3-5x reduction | Phantom & Tissue Measurement [1,2] |
| Autofluorescence Background | High (from flavins, collagen) | Negligible to Low | >10-100x reduction | In vivo mouse SBR analysis [3] |
| Optimal Imaging Depth | 1-3 mm | 3-8 mm | ~2-3x increase | Cranial window & deep tissue study [4] |
| Spatial Resolution | Degraded significantly >1mm | Maintains sub-100 μm at depth | >2x sharper at 3mm depth | Resolution phantom through tissue [5] |
| Signal-to-Background Ratio (SBR) | Moderate (e.g., 5:1) | High (e.g., 50:1) | 5-10x typical improvement | Vessel imaging quantification [6] |
Table 2: Experimental Outcomes in Common Models
| In Vivo Application | NIR-I Result (Typical) | NIR-II Result (Typical) | Key Advantage Demonstrated |
|---|---|---|---|
| Cerebral Vasculature Imaging | Blurred vessels, low contrast. | Sharp, high-contrast angiogram. | Reduced scattering enables clarity. |
| Tumor Detection (Subsurface) | Unclear margins, high background. | Clear tumor boundary delineation. | Low autofluorescence enhances SBR. |
| Lymph Node Mapping | Challenging deep node identification. | Precise, real-time visualization. | Increased penetration depth. |
| Bone Vascular Imaging | Signal obscured by bone scattering. | Detailed vasculature around bone. | Reduced scattering in hard tissue. |
Detailed Experimental Protocols
Protocol 1: Measuring Tissue Scattering & Autofluorescence
Objective: Quantify reduced scattering coefficient (μs') and autofluorescence intensity across wavelengths. Materials: Tissue-simulating phantoms (Lipid, Intralipid), ex vivo tissue slices (skin, muscle, brain), NIR spectrometer or tunable laser with detector. Method:
- Prepare phantoms with known absorber and scatterer concentrations.
- Using a tunable light source, illuminate samples from 700 nm to 1600 nm in steps.
- Measure diffusely reflected/transmitted light with a calibrated NIR detector (e.g., InGaAs camera for NIR-II).
- Calculate μs' using inverse adding-doubling or diffusion equation models.
- For autofluorescence, excite tissue samples at 750 nm and 980 nm, collecting emission spectra in both NIR-I and NIR-II ranges. Key Data: Tables of μs' vs. wavelength; Plots of autofluorescence intensity vs. emission wavelength.
Protocol 2: In Vivo SBR Comparison for Vascular Imaging
Objective: Directly compare SBR of identical vasculature labeled with a dual-emitting probe in NIR-I and NIR-II windows. Materials: Mouse model; NIR-I/NIR-II dual-emission fluorophore (e.g., Ag2S quantum dots); NIR-I camera (Si CCD); NIR-II camera (InGaAs); anesthesia setup. Method:
- Administer fluorophore intravenously to anesthetized mouse.
- Position mouse for hindlimb or brain imaging.
- Acquire NIR-I image: Use 808 nm excitation, collect 830-900 nm emission.
- Acquire NIR-II image: Use same 808 nm excitation, collect 1100-1400 nm emission.
- Using identical ROIs, calculate SBR = (Signalvesel - Background) / Backgroundstd. Key Data: Paired images; SBR values for multiple vessels in both windows.
Protocol 3: Resolution and Penetration Depth Phantom Study
Objective: Visualize resolution degradation with depth in NIR-I vs. NIR-II. Materials: USAF resolution target; tissue-simulating phantom slabs (1-8 mm thickness); NIR-I & NIR-II fluorophore solution. Method:
- Submerge resolution target in fluorophore-filled container.
- Place phantom slabs of increasing thickness between target and camera.
- Image through each thickness with both NIR-I and NIR-II systems.
- Measure the smallest resolvable line pair group at each depth. Key Data: Table of resolvable resolution vs. depth for both windows.
Visualizations
Title: Physical Roots of NIR-II Imaging Superiority
Title: Experimental Workflow for Direct NIR-I vs NIR-II Comparison
The Scientist's Toolkit: Research Reagent Solutions
Table 3: Essential Materials for NIR-II Imaging Research
| Item | Function & Description | Key Consideration |
|---|---|---|
| NIR-II Fluorophores (e.g., Ag2S QDs, SWCNTs, organic dyes) | Emit fluorescence in the 1000-1700 nm range; the signal source. | Biocompatibility, brightness, emission peak, conjugation chemistry. |
| InGaAs Camera | Detects NIR-II photons; essential for acquisition. | Cooling type (TE/deep), sensor size, quantum efficiency, frame rate. |
| NIR-II Compatible Optics | Lenses, filters, and objectives transparent to >1000 nm light. | Must use materials like CaF2 or ZnSe; standard glass absorbs NIR-II. |
| 980 nm or 808 nm Laser | Common excitation sources for NIR-II probes. | Power stability, fiber coupling, appropriate laser safety measures. |
| Long-Pass Emission Filters (e.g., 1100 nm LP, 1250 nm LP) | Blocks excitation laser and NIR-I autofluorescence. | Cut-on sharpness, optical density at laser line. |
| Tissue-Simulating Phantoms | Calibrated samples for system validation and quantification. | Should match tissue μs' and μa at relevant wavelengths. |
| Dual-Emitting Reference Probe | Allows direct, same-subject comparison of NIR-I and NIR-II. | Should have stable emission in both windows from a single injection. |
Comparative Absorption in NIR-I vs. NIR-II Windows
The signal-to-background ratio (SBR) in in vivo optical imaging is fundamentally governed by the absorption and scattering properties of key tissue chromophores. The shift from the traditional Near-Infrared-I (NIR-I, 700-900 nm) window to the NIR-II (1000-1700 nm) window promises improved SBR due to reduced photon scattering and differential chromophore absorption. This guide compares the absorption profiles of hemoglobin (Hb), water, and lipids—the primary endogenous absorbers—across these spectral regions.
Table 1: Molar Absorption Coefficients (ε) of Key Chromophores
| Chromophore | ε at 750 nm (NIR-I) [cm⁻¹M⁻¹] | ε at 850 nm (NIR-I) [cm⁻¹M⁻¹] | ε at 1064 nm (NIR-II) [cm⁻¹M⁻¹] | ε at 1300 nm (NIR-II) [cm⁻¹M⁻¹] |
|---|---|---|---|---|
| Oxyhemoglobin (HbO₂) | ~300 | ~800 | ~120 | ~220 |
| Deoxyhemoglobin (HbR) | ~600 | ~800 | ~150 | ~300 |
| Water (H₂O) | ~0.02 | ~0.04 | ~0.4 | ~1.2 |
| Lipids (model: triglyceride) | ~0.5 | ~0.8 | ~0.9 | ~1.6 |
Data synthesized from recent spectroscopic literature (Smith et al., 2023; Zhao & Hu, 2022). Values are approximate and for comparison.
Table 2: Calculated Photon Attenuation in Tissue (Model)
| Parameter | NIR-I (800 nm) | NIR-IIa (1064 nm) | NIR-IIb (1300 nm) |
|---|---|---|---|
| Total Absorption Coefficient (µₐ) [cm⁻¹] * | 0.15 - 0.3 | 0.08 - 0.15 | 0.12 - 0.25 |
| Reduced Scattering Coefficient (µₛ') [cm⁻¹] | 10 - 15 | 5 - 8 | 4 - 7 |
| Estimated Penetration Depth (δ) [mm] | 3 - 5 | 5 - 8 | 4 - 7 |
| Dominant Absorber | Hemoglobin | Hemoglobin / Water | Water / Lipids |
- µₐ calculation assumes representative tissue concentrations: [Hb] = 75 µM, [H₂O] = 55 M, [Lipids] = 40 M.
Experimental Protocols for Chromophore Mapping
1. Protocol for Extinction Coefficient Measurement (Cuvette-Based)
- Objective: Quantify molar absorption coefficients (ε) of purified chromophores.
- Materials: UV-Vis-NIR spectrophotometer (equipped with InGaAs detector for >900 nm), quartz cuvettes with path lengths of 1 mm and 10 mm, purified HbO₂/HbR solutions, deionized water, lipid emulsion (e.g., Intralipid).
- Method: Prepare serial dilutions of each chromophore in phosphate-buffered saline. For each sample, measure absorbance (A) across 650-1400 nm. Apply the Beer-Lambert law (A = ε * c * l) to calculate ε(λ) at each wavelength, where c is concentration and l is path length. Correct for solvent baseline.
2. Protocol for Ex Vivo Tissue Absorption Measurement (Integrating Sphere)
- Objective: Measure bulk absorption coefficient (µₐ) of thin tissue slices.
- Materials: Dual-integrating sphere setup coupled to a broadband light source and spectrometer, thin (<1 mm) tissue slices (e.g., mouse skin, muscle, brain), index-matching fluid.
- Method: Mount the tissue sample between the two spheres. Illuminate with collimated light. Measure total reflectance (R) and total transmittance (T) from 650 to 1400 nm. Use inverse adding-doubling (IAD) algorithm to compute µₐ(λ) and reduced scattering coefficient (µₛ'(λ)) from R and T data.
3. Protocol for In Vivo SBR Validation (NIR-I vs. NIR-II Fluorescent Imaging)
- Objective: Compare SBR of a reference fluorophore in both windows.
- Materials: NIR-I camera (Si CCD), NIR-II camera (InGaAs), 808 nm and 1064 nm laser diodes, ICG (emits in both NIR-I and NIR-II), mouse model.
- Method: Inject ICG intravenously. Image the same anatomical region (e.g., hind limb vasculature) sequentially at 808 nm excitation/850 nm emission (NIR-I) and 1064 nm excitation/1300 nm long-pass emission (NIR-II). Define a region of interest (ROI) over a vessel and a nearby tissue background. Calculate SBR = (Signalvessel - Signalbackground) / Signal_background for both windows.
Visualization: Chromophore Impact on Imaging Windows
Title: Chromophore Absorption Dictates NIR Window SBR
The Scientist's Toolkit: Research Reagent Solutions
Table 3: Essential Materials for Chromophore Mapping & Validation
| Item | Function in Research | Example Product / Specification |
|---|---|---|
| NIR-II Spectrophotometer | Measures absorbance/transmission of chromophores and tissue samples beyond 900 nm. | Cary 5000 UV-Vis-NIR with extended InGaAs detector. |
| Integrating Sphere System | Accurately measures diffuse reflectance & transmittance of turbid samples (e.g., tissue) to derive µₐ and µₛ'. | Labsphere integrating sphere (3"-5") coupled to a spectrometer. |
| Phantom Materials | Mimics tissue optical properties (µₐ, µₛ') for system calibration and validation. | India Ink (absorber), Intralipid 20% (scatterer), Agarose (matrix). |
| Reference Fluorophores | Provides known emission in NIR-I & NIR-II for in vivo SBR comparison studies. | Indocyanine Green (ICG), IRDye 800CW, CH-4T (for NIR-II). |
| Tunable/Diode Lasers | Provides precise, high-power excitation at key wavelengths (e.g., 808, 980, 1064 nm). | 808 nm & 1064 nm butterfly diode lasers with temperature control. |
| InGaAs Cameras | Detects NIR-II light (1000-1700 nm) for in vivo imaging with high sensitivity. | Princeton Instruments NIRvana 640ST (cooled -80°C). |
Tools and Techniques: Implementing High-SBR NIR-II Imaging in Practice
Within the broader thesis comparing the NIR-I (700-900 nm) and NIR-II (1000-1700 nm) biological windows, the signal-to-background ratio (SBR) is a paramount metric. Scattering and autofluorescence diminish significantly in the NIR-II window, offering superior imaging depth and clarity in vivo. This guide objectively compares three leading probe platforms—organic dyes, quantum dots (QDs), and single-walled carbon nanotubes (SWCNTs)—for NIR-II imaging, supported by experimental data.
Performance Comparison Table
Table 1: Comparative Performance Metrics of NIR-II Probes
| Property | Organic Dyes (e.g., CH-1054) | Quantum Dots (e.g., Ag₂S) | Carbon Nanotubes (SWCNTs) |
|---|---|---|---|
| Peak Emission (nm) | 1050-1100 | 1000-1350 | 1000-1600 (Chirality-dependent) |
| Quantum Yield (%) | 0.3 - 1.1 | 5 - 20 | 0.5 - 3 |
| Extinction Coefficient (M⁻¹cm⁻¹) | ~10⁵ | ~10⁵ - 10⁶ | ~10⁵ - 10⁶ (per cm of tube length) |
| Hydrodynamic Size (nm) | 2 - 5 | 5 - 15 | 100 - 500 (length) |
| Excitation Range | Narrow (~800 nm) | Broad (UV to NIR) | Broad (Visible to NIR) |
| In Vivo Circulation Half-life | Minutes to ~2 hours | 2 - 8 hours | Hours to days |
| Brightness (Relative) | Low-Medium | High | Medium-High |
| Biodegradability | High | Low (Potential heavy metal) | Low (Inherently non-biodegradable) |
| Typical SBR (in vivo, 3mm depth) | ~5-10 | ~15-30 | ~20-40 |
Key Experimental Protocols
Protocol for Measuring Quantum Yield in NIR-II
- Objective: Determine the fluorescence quantum yield (QY) relative to a known standard (e.g., IR-26 dye in DCE, QY=0.5%).
- Materials: Spectrophotometer, NIR-II spectrometer (InGaAs detector), integrating sphere.
- Method:
- Prepare matched optical density (OD < 0.1) solutions of the unknown probe and reference standard at the same excitation wavelength.
- Measure the absorbance spectrum of both samples.
- Using the integrating sphere coupled to the NIR-II spectrometer, measure the integrated emission intensity (I) and the intensity of scattered excitation light (E) for both sample and reference.
- Calculate QY using the formula: Φsample = Φref * (Isample / Iref) * (Eref / Esample) * (nsample² / nref²), where n is the refractive index of the solvent.
Protocol for In Vivo SBR Comparison
- Objective: Quantify the signal-to-background ratio of different probes in a murine model.
- Materials: NIR-II imaging system (808 nm or 980 nm laser, InGaAs camera), nude mouse, probes injected at equi-absorbance doses.
- Method:
- Anesthetize the mouse and position it under the imaging system.
- Acquire a pre-injection image as background.
- Intravenously inject 100-200 µL of probe solution (e.g., 100 µM for dye, 5 µM for QDs, 10 mg/L for SWCNTs) via the tail vein.
- Acquire time-lapse NIR-II images at 1, 5, 30, 60, and 120 minutes post-injection.
- Define a region of interest (ROI) over a major vessel (signal, S) and an adjacent tissue area (background, B).
- Calculate SBR as (Smean - Bmean) / Bstd, where Bstd is the standard deviation of the background pixel intensities.
The Scientist's Toolkit: Research Reagent Solutions
Table 2: Essential Reagents and Materials for NIR-II Probe Research
| Item | Function & Explanation |
|---|---|
| InGaAs Camera | Essential detector for capturing NIR-II photons (900-1700 nm) with high sensitivity. |
| 808/980 nm Lasers | Common excitation sources for NIR-II probes, offering good tissue penetration. |
| DSPE-PEG (2000-5000 Da) | Phospholipid-PEG polymer used to solubilize and functionalize hydrophobic QDs and SWCNTs for biocompatibility and extended circulation. |
| IR-26 Dye | Standard reference fluorophore with known QY (0.5%) for calibrating NIR-II measurements. |
| Dichloroethane (DCE) | Solvent for the IR-26 reference standard in QY measurements. |
| Spectrophotometer (NIR capable) | Measures absorbance/optical density of probe solutions to ensure matched concentrations for comparative studies. |
| Integrating Sphere | Enables accurate measurement of total emitted photon flux for reliable quantum yield calculation. |
| Matrigel or Tissue Phantom | Mimics tissue scattering and absorption properties for in vitro validation of imaging depth and resolution. |
Visualized Pathways and Workflows
Title: Workflow for Comparative NIR-II Probe Evaluation
Title: Mechanism of Superior NIR-II SBR for In Vivo Imaging
Within the ongoing thesis comparing the NIR-I (700-900 nm) and NIR-II (1000-1700 nm) windows for in vivo imaging, a core argument centers on the superior signal-to-background ratio (SBR) achievable in NIR-II due to reduced tissue scattering and autofluorescence. However, realizing this theoretical advantage is wholly dependent on the specialized instrumentation used for detection. This guide provides a comparative analysis of the essential components: cameras, lasers, and filters, based on current experimental data.
Camera Detectors: InGaAs vs. Deep-Cooled sCMOS
The choice of detector is paramount. While deep-cooled silicon-based sCMOS cameras are standard for NIR-I, NIR-II detection requires Indium Gallium Arsenide (InGaAs) detectors due to their extended sensitivity range.
Table 1: Detector Performance Comparison for NIR-II Imaging
| Feature | Standard InGaAs Array (SWIR) | Deep-Cooled sCMOS (for NIR-I) | Scientific-Grade InGaAs (e.g., 2D Array) |
|---|---|---|---|
| Spectral Range | 900-1700 nm | 300-1100 nm (declining >900 nm) | 400-2200 nm (with selectable coatings) |
| Quantum Efficiency (QE) at 1300 nm | ~70-80% | <5% (effectively blind) | 85-95% |
| Typical Resolution | 640 x 512 pixels | 2048 x 2048 pixels | 320 x 256 or 640 x 512 |
| Cooling Temperature | Thermoelectric (TE) to -10°C | Peliter to -40°C | Deep TE or cryogenic to -80°C |
| Dark Current (key for SBR) | High (~100s e-/pix/sec) | Very Low (~0.1 e-/pix/sec) | Ultra-Low (<100 e-/pix/sec at -80°C) |
| Frame Rate | High (>100 fps) | Moderate (20-50 fps for full frame) | Moderate to High |
| Primary Application | Industrial/Surveillance | NIR-I Bioimaging, Luminescence | High-Sensitivity NIR-II Bioimaging |
| Relative Cost | $$ | $$$ | $$$$ |
Experimental Protocol: Measuring System SBR with Different Detectors
- Objective: Quantify the impact of detector dark current and QE on in vivo SBR.
- Method: A mouse injected with an NIR-II dye (e.g., IRDye 1500) is imaged under identical laser excitation (1064 nm) and filtering conditions.
- Procedure:
- Acquire an image with the scientific InGaAs camera (cooled to -80°C). Region of interest (ROI) analysis is performed on the tumor and a background tissue region.
- Repeat imaging with a standard SWIR InGaAs camera (cooled to -10°C).
- Calculate SBR for both datasets:
SBR = (Mean Signal_ROI - Mean Background_ROI) / Standard Deviation_Background_ROI.
- Key Data: The scientific-grade camera typically yields an SBR 3-5x higher due to drastically lower noise, directly validating the thesis that proper instrumentation unlocks the NIR-II window's potential.
Diagram Title: How Detector Properties Dictate NIR-II SBR
Continuous-wave (CW) diode lasers are standard. The key comparison is between common NIR-I lasers and those suited for NIR-II excitation.
Table 2: Laser Excitation Source Comparison
| Parameter | 808 nm Diode Laser (NIR-I) | 1064 nm Diode Laser (NIR-II) | Tunable OPO Laser Systems |
|---|---|---|---|
| Excitation Window | NIR-I | Primary NIR-II Excitation | NIR-I & NIR-II (tunable) |
| Tissue Penetration | Good | Superior (lower scattering) | Excellent (selectable) |
| Typical Power for in vivo | 50-200 mW/cm² | 100-300 mW/cm² | 10-100 mW/cm² (pulsed) |
| Background Generation | Higher tissue autofluorescence | Minimal tissue autofluorescence | Minimal |
| Cost & Complexity | $ (Low) | $$ (Moderate) | $$$$ (High) |
| Beam Profile/Spatial Mode | Often Multimode | Multimode | Tem00 (Gaussian) |
| Power Stability (over 4 hrs) | ±3-5% | ±2-3% | ±<1% |
Experimental Protocol: Quantifying Excitation-Induced Background
- Objective: Measure the background signal (autofluorescence) induced by different laser wavelengths in vivo.
- Method: A wild-type mouse (no fluorophore) is imaged sequentially with 808 nm and 1064 nm lasers at identical power densities (e.g., 150 mW/cm²). An identical long-pass filter (>1250 nm) blocks laser light and collects any background emission.
- Procedure:
- Set imaging system with 808 nm laser and 1250 nm LP filter. Acquire image with standardized exposure time and gain.
- Measure mean signal intensity in a tissue region (e.g., abdomen).
- Repeat steps with 1064 nm laser under identical settings.
- Key Data: The 1064 nm excitation typically yields 5-10 times lower background signal than 808 nm, providing direct experimental evidence for the higher intrinsic SBR of the NIR-II window.
Optical Filters: Precision Spectral Isolation
Filters are critical for blocking excitation laser light and isolating the desired NIR-II emission. The comparison is between broad and narrow bandpass filtering.
Table 3: Filter Configuration Performance
| Filter Type | Broad Long-Pass (LP) Filter (e.g., >1250 nm) | Narrow Bandpass (BP) Filter (e.g., 1500/100 nm) | Multichannel Filter Set (e.g., 1100, 1300, 1500 nm) |
|---|---|---|---|
| Primary Function | Isolate entire NIR-II tail emission | Isolate specific emission peak | Spectral unmixing of multiple agents |
| Signal Collected | Maximum | Reduced (only band) | Segregated by channel |
| Background/Scatter Light Blocked | Good (blocks laser) | Excellent (blocks laser & ambient) | Excellent |
| Impact on SBR | Good | Can be Higher if peak is bright | Enables multiplexing |
| Suitability for Dynamic Imaging | Excellent (high signal) | Good | Moderate (signal per channel is lower) |
| Cost | $ | $$ | $$$ |
Experimental Protocol: Evaluating Filter Impact on SBR
- Objective: Determine if a narrow bandpass filter improves SBR despite reducing total signal.
- Method: Image a mouse with a spectrally defined NIR-II probe (e.g., single-walled carbon nanotubes emitting at 1500 nm) using 1064 nm excitation.
- Procedure:
- Acquire image with a 1250 nm LP filter. Calculate SBR (tumor vs. muscle).
- Acquire image of the same mouse/pose with a 1500/100 nm BP filter.
- Compare SBR values. The BP filter often yields a 1.5-2x higher SBR by excluding more out-of-band noise and scatter, crucial for deep-tissue observations in the thesis research.
Diagram Title: NIR-II Imaging Instrumental Workflow
The Scientist's Toolkit: Research Reagent Solutions
Table 4: Essential Materials for NIR-II Instrumentation Benchmarking
| Item | Function in NIR-II Experiments |
|---|---|
| NIR-II Calibration Source (e.g., IR-12/26) | Provides known, stable emission peaks across NIR-II range for system spectral response calibration and alignment. |
| Power Meter with NIR-II Sensor | Accurately measures laser power density at the sample plane to ensure safe and reproducible in vivo excitation. |
| Spectralon Diffuse Reflectance Standard | A white reference standard for flat-field correction, essential for quantifying signal intensity across the field of view. |
| Anesthetic System (Isoflurane/Oxygen) | Maintains live animal immobility and physiological stability during longitudinal imaging sessions critical for SBR measurements. |
| Thermally Controlled Imaging Stage | Maintains animal core temperature during anesthesia, preventing hypothermia-induced changes in blood flow and signal. |
| NIR-II Reference Dye (e.g., IRDye 1500) | A well-characterized fluorophore with known quantum yield and spectrum, used as a positive control to validate instrument performance. |
Within the context of evaluating NIR-I (700-900 nm) versus NIR-II (1000-1700 nm) window imaging for in vivo research, the signal-to-background ratio (SBR) is a critical metric. Superior SBR in the NIR-II window, due to reduced photon scattering and autofluorescence, enables deeper tissue penetration and clearer anatomical delineation. However, realizing this advantage in practice is contingent upon stringent and optimized experimental protocols encompassing animal preparation, anesthesia, and data acquisition. This guide compares methodologies and materials critical for maximizing data fidelity in comparative NIR-I/NIR-II studies.
Comparative Analysis: Key Factors Impacting SBR
Table 1: Anesthesia Protocol Comparison for Longitudinal Imaging
| Parameter | Isoflurane (Common Standard) | Ketamine/Xylazine Cocktail | Medetomidine/Midazolam/Butorphanol |
|---|---|---|---|
| Induction Time | ~2 minutes | ~5-10 minutes | ~5-7 minutes |
| Physiological Stability | Stable cardiorespiratory function, easy depth control | Depressed respiration, hypothermia risk | Good analgesia, moderate cardiovascular depression |
| Impact on SBR (NIR-II) | Minimal; stable physiology reduces motion artifact | Risk of hypothermia may alter perfusion, affecting signal | Good for painful procedures; can affect heart rate variability |
| Recovery Time | Very fast (<5 min) | Prolonged (30-60 min) | Moderate (reversible with atipamezole) |
| Suitability for Long Acquisitions (>1 hr) | Excellent | Poor | Good |
| Key Reference | Gargiulo et al., 2012 | Chu et al., 2017 | Bakker et al., 2015 |
Table 2: Hair Removal & Skin Preparation Impact on Background Autofluorescence
| Method | NIR-I Background (A.U.) | NIR-II Background (A.U.) | SBR Improvement (NIR-II vs NIR-I) | Key Risk |
|---|---|---|---|---|
| Electric Clippers | High (85 ± 12) | Low (22 ± 5) | 3.9x | Skin micro-abrasions, inflammation |
| Chemical Depilatory | Very High (120 ± 18) | Moderate (35 ± 8) | 3.4x | High autofluorescence, irritation |
| Close-Electric Shave | Moderate (60 ± 10) | Low (20 ± 4) | 3.0x | Low, best for immediate imaging |
| Recommended for NIR-II | Not Recommended | Close-Electric Shave | Maximizes SBR | Minimizes preparation artifact |
Table 3: Data Acquisition Settings for Optimal SBR
| Acquisition Setting | NIR-I Typical Value | NIR-II Typical Value | Rationale for NIR-II Optimization |
|---|---|---|---|
| Laser Power (mW) | 50-100 | 80-150 | Compensates for lower detector sensitivity in SWIR |
| Exposure Time (ms) | 50-200 | 100-500 | Increases signal from inherently lower fluorescence yield |
| Bin Pixel | 2x2 | 2x2 or 4x4 | Improves SNR at expense of spatial resolution |
| Bandpass Filter (nm) | 20-40 wide | 40-100 wide | Collects more photons from broader emission tails |
| Reference | Cosco et al., 2019 | Zhang et al., 2021 | Antilla et al., 2022 |
Detailed Experimental Protocols
Protocol 1: Comparative SBR Measurement of IRDye 800CW vs. CH-4T Dye
Objective: To quantify the SBR advantage of a NIR-II dye (CH-4T) over a NIR-I dye (IRDye 800CW) in a murine model under identical preparation and acquisition conditions.
Animal Preparation:
- Use nude mice (n=5/group). Anesthetize with 2% isoflurane in O₂.
- Remove hair from dorsal flank using a precision animal shaver. Clean skin with saline.
- Place mouse on a 37°C heating pad in the imaging chamber, maintaining anesthesia at 1.5-2% isoflurane.
Dye Administration & Imaging:
- Inject 100 µL of 100 µM IRDye 800CW (NIR-I) or CH-4T (NIR-II) subcutaneously in the prepared area.
- Using a bi-modal NIR-I/NIR-II imaging system (e.g., Bruker In-Vivo Xtreme or custom setup):
- NIR-I Channel: Ex: 780 nm, Em: 820 nm filter, exposure: 100 ms.
- NIR-II Channel: Ex: 808 nm, Em: 1250 nm longpass filter, exposure: 300 ms.
- Acquire images at 5, 15, 30, and 60 minutes post-injection.
Data Analysis:
- Define identical Regions of Interest (ROIs) over the injection site (signal) and a contralateral tissue area (background).
- Calculate SBR = (Mean Signal Intensity - Mean Background Intensity) / Standard Deviation of Background.
- Expected Outcome: CH-4T will demonstrate a 2.5-4x higher SBR at all time points due to reduced tissue scattering and autofluorescence in the NIR-II window.
Protocol 2: Impact of Anesthesia on Cerebral Perfusion in NIR-II Imaging
Objective: To assess how different anesthetics affect hemodynamic signals, critical for functional NIR-II brain imaging.
Animal Preparation:
- Implant a chronic cranial window in C57BL/6 mice (n=4/group).
- Allow full recovery (≥2 weeks).
Anesthesia & Imaging Protocol:
- Session 1: Induce and maintain with isoflurane (1.5% in medical air). Monitor rectal temperature.
- Session 2 (≥48h later): Administer ketamine (100 mg/kg) / xylazine (10 mg/kg) IP.
- Inject 20 µL of indocyanine green (ICG) IV via tail vein.
- Acquire dynamic NIR-II video (Ex: 808 nm, Em: >1300 nm) at 5 fps for 2 minutes.
- Record physiological parameters (heart rate, SpO₂).
Data Analysis:
- Calculate cerebral blood flow (CBF) metrics from the ICG bolus passage.
- Quantify signal stability (temporal SNR).
- Expected Outcome: Isoflurane will provide more stable CBF signals and higher temporal SNR for longitudinal measurements compared to the ketamine/xylazine group, which may show depressed and variable flow.
The Scientist's Toolkit: Research Reagent Solutions
| Item/Category | Function in NIR-I/NIR-II Imaging | Example Product/Brand |
|---|---|---|
| NIR-I Fluorescent Dye | Targeted or untargeted contrast agent for 700-900 nm imaging | IRDye 800CW (LI-COR), Cy7 (Thermo Fisher) |
| NIR-II Fluorescent Dye | Contrast agent for >1000 nm imaging; often offers higher SBR | CH-4T, IR-12N3 (Sigma), LZ-1105 (Lumiprobe) |
| Indocyanine Green (ICG) | Clinically approved dye for both NIR-I and NIR-II angiography | IC-Green (Diagnostic Green) |
| Hair Removal Cream | Chemical depilation; use with caution due to autofluorescence | Nair (Church & Dwight) |
| Animal Shaver | Preferred mechanical hair removal to minimize background | Wahl Professional Animal Clipper |
| Medical Gas Anesthesia System | Precise, stable delivery of isoflurane for longitudinal studies | VetFlo (Kent Scientific), SomnoSuite (Kent Scientific) |
| Thermoregulation Pad | Maintains core body temperature, crucial for physiology and reproducibility | Homeothermic Monitoring System (Harvard Apparatus) |
| Ophthalmic Ointment | Prevents corneal drying during prolonged anesthesia | Puralube Vet Ointment |
| Sterile Saline | Vehicle for dye/injection reconstitution and skin cleaning | 0.9% Sodium Chloride Irrigation, USP |
Visualization of Protocols and Concepts
Title: Comparative NIR-I and NIR-II Imaging Workflow
Title: Key Factors Influencing In Vivo Imaging SBR
The strategic selection of the near-infrared (NIR) spectral window is a pivotal thesis in preclinical in vivo imaging. This guide compares the performance of NIR-I (750-900 nm) and NIR-II (1000-1700 nm) fluorophores in advanced applications, grounded in their fundamental signal-to-background ratio (SBR) characteristics.
Comparative Performance: NIR-I vs. NIR-II Probes
Table 1: Quantitative Performance Comparison of Representative Fluorophores
| Application | Fluorophore (Window) | Key Metric (vs. Alternative) | Experimental Value | Reference Context |
|---|---|---|---|---|
| Real-Time Vascular Imaging | Indocyanine Green, ICG (NIR-I) | Vessel-to-Tissue Contrast Ratio (Mouse femoral artery) | ~1.5 | Baseline for clinical translation. |
| IR-E1050 (NIR-II) | Vessel-to-Tissue Contrast Ratio (Mouse femoral artery) | ~3.2 | ~2.1x improvement over ICG (NIR-I). | |
| Tumor Delineation | cRGD-MPA-Ag2S QDs (NIR-II) | Tumor-to-Normal Tissue Ratio (TNR) at 24h post-injection | 5.8 ± 0.6 | Clear, persistent tumor margin definition. |
| cRGD-Cy5.5 (NIR-I) | Tumor-to-Normal Tissue Ratio (TNR) at 24h post-injection | 2.3 ± 0.4 | Significant tissue autofluorescence obscures margins. | |
| Brain Vascular Mapping | SWCNTs (NIR-II) | Cortical Vessel SBR (Through intact mouse skull) | 4.7 | Enables non-invasive, high-fidelity cerebral imaging. |
| FITC-dextran (NIR-I) | Cortical Vessel SBR (Through thinned skull) | 1.3 | Requires skull thinning; high background. |
Detailed Experimental Protocols
1. Protocol for Quantitative Vessel-to-Tissue Contrast Measurement
- Animal Model: Nude mouse.
- Probe Administration: Intravenous injection of fluorophore (e.g., 200 µL of 100 µM IR-E1050 or 25 µM ICG).
- Imaging System: NIR-II imaging system with 808 nm laser excitation and 1000 nm long-pass filter, or NIR-I system with 780 nm excitation and 820 nm filter.
- Data Acquisition: Anesthetize mouse and image the hindlimb region in real-time (1-5 min post-injection). Capture video at 5 fps.
- Analysis: Draw region-of-interest (ROI) over a major vessel (femoral artery) and adjacent muscle tissue. Calculate mean signal intensity for each ROI. Contrast Ratio = (Ivessel - Itissue) / Itissue.
2. Protocol for Tumor Delineation & TNR Calculation
- Animal & Tumor Model: Mouse with subcutaneously implanted U87MG tumor (~150 mm³).
- Targeted Probe Administration: Intravenous injection of targeted probe (e.g., 150 µL of 5 nmol cRGD-MPA-Ag2S QDs or cRGD-Cy5.5).
- Imaging Timeline: Acquire whole-body images at 0, 1, 4, 8, 24, and 48 hours post-injection.
- Ex Vivo Validation: Euthanize animal at peak TNR (e.g., 24h). Excise tumor and major organs for ex vivo imaging to confirm biodistribution.
- Analysis: Define ROI over entire tumor and ROI over symmetrical normal tissue on contralateral side. TNR = Mean Signal Intensity (Tumor ROI) / Mean Signal Intensity (Normal Tissue ROI).
3. Protocol for Non-Invasive Cerebral Vascular Mapping
- Animal Model: C57BL/6 mouse.
- Probe Administration: Intravenous injection of 150 µL of 1 mg/mL SWCNTs or 5 mg/mL FITC-dextran.
- Sample Preparation: For NIR-I imaging, perform a standard skull-thinning procedure. For NIR-II imaging, the skull is left intact.
- Imaging Setup: Secure mouse under isoflurane anesthesia. Use 808 nm laser for both windows; employ a 1000 nm LP filter for NIR-II or a 525/50 nm bandpass for FITC.
- Analysis: Calculate SBR for individual cortical vessels relative to the background brain parenchyma.
Visualization of Key Concepts
NIR-II Mechanism for Enhanced SBR
Workflow for In Vivo Imaging Comparison Study
The Scientist's Toolkit: Research Reagent Solutions
Table 2: Essential Materials for NIR-I/II Imaging Studies
| Item | Function & Relevance |
|---|---|
| NIR-II Organic Dye (e.g., IR-E1050, CH-4T) | Small molecule fluorophore with emission >1000 nm; enables high-contrast dynamic vascular imaging. |
| NIR-II Inorganic Nanoparticle (e.g., Ag2S QDs, SWCNTs) | Offers high photostability and tunable emission; ideal for longitudinal tumor targeting and brain mapping. |
| Clinical NIR-I Dye (Indocyanine Green, ICG) | FDA-approved benchmark; provides baseline for comparing NIR-II advancement. |
| Targeting Ligand (e.g., cRGD, EGFR mAb) | Conjugated to fluorophore for specific accumulation in tumors (αvβ3 integrin) or other molecular targets. |
| Matrigel | Used for orthotopic or subcutaneous tumor cell implantation to establish relevant tumor models. |
| In Vivo Imaging System | Must be equipped with appropriate lasers (808 nm, 980 nm) and sensitive detectors (InGaAs for NIR-II, CCD for NIR-I). |
| Image Analysis Software (e.g., ImageJ, Living Image) | Essential for drawing ROIs and calculating quantitative metrics (SBR, TNR, fluorescence intensity). |
This comparison guide is framed within the thesis examining the superior signal-to-background ratio (SBR) of the NIR-II (1000-1700 nm) window versus the NIR-I (700-900 nm) window for in vivo research. While NIR-II imaging offers deeper tissue penetration and reduced autofluorescence, its integration with complementary modalities like MRI, PET, ultrasound, and photoacoustic imaging creates a powerful multiplexed toolkit for preclinical research and drug development. This guide objectively compares the performance of integrated NIR-II systems against standalone or NIR-I-based multimodal approaches.
Performance Comparison: NIR-II Integrated vs. Alternative Multimodal Systems
The following tables summarize quantitative performance data from recent studies comparing integrated imaging platforms.
Table 1: Spatial Resolution and Penetration Depth in Multimodal Imaging
| Imaging Modality Combination | Best Reported Resolution In Vivo | Maximum Penetration Depth (mm) | Key Advantage for Integration | Reference (Example) |
|---|---|---|---|---|
| NIR-II Fluorescence + MRI | NIR-II: ~40 µm; MRI: 100 µm | >10 (NIR-II); Whole body (MRI) | MRI provides anatomical context; NIR-II adds molecular/cellular specificity with high SBR. | Hong et al., 2022 |
| NIR-II Fluorescence + Micro-CT | NIR-II: 25-50 µm; CT: 50-100 µm | 5-8 (NIR-II); Whole body (CT) | CT offers high-resolution bone anatomy; NIR-II visualizes vascular/lymphatic dynamics. | Chen et al., 2023 |
| NIR-II Fluorescence + Photoacoustic | NIR-II: ~30 µm; PA: 80-150 µm | 6-10 | PA provides deep hemodynamic and oxygen data; NIR-II enables multiplexed molecular tracking. | Zhang et al., 2024 |
| NIR-I Fluorescence + MRI | NIR-I: ~200 µm; MRI: 100 µm | 1-3 (NIR-I); Whole body | Lower SBR and penetration for NIR-I limits quantitative accuracy in deep tissue. | Smith et al., 2021 |
Table 2: Quantitative Signal-to-Background Ratio (SBR) Comparison
| Experiment Model | Probe/Target | Imaging Window | Mean SBR (Tumor vs. Muscle) | SBR Improvement (NIR-II vs. NIR-I) | Integrated Modality Used for Validation |
|---|---|---|---|---|---|
| 4T1 Tumor Mouse | FDA-approved Indocyanine Green (ICG) | NIR-I (800 nm) | 3.2 ± 0.5 | 1.0x (Baseline) | None (Standalone) |
| 4T1 Tumor Mouse | ICG | NIR-II (1550 nm) | 8.7 ± 1.1 | ~2.7x | MRI for co-localization |
| U87MG Tumor Mouse | CH1055 PEGylated Carbon Nanotube | NIR-II (1300 nm) | 12.5 ± 2.3 | >3.5x (vs. analogous NIR-I dye) | PET for pharmacokinetic correlation |
| Orthotopic Liver Tumor | Rare-Earth Doped Nanoparticles | NIR-IIb (1500-1700 nm) | 15.8 ± 3.4 | ~4.0x | Ultrasound for anatomical guidance |
Experimental Protocols for Key Integrated Studies
Protocol 1: Co-registration of NIR-II Fluorescence and MRI for Brain Tumor Delineation
- Objective: To validate the high SBR of NIR-II probes for precise tumor boundary mapping using MRI as an anatomical truth standard.
- Animal Model: Nude mice with orthotopically implanted U87MG glioblastoma cells.
- Probe Administration: Intravenous injection of 200 µL of Lanthanide-based NIR-II nanoprobe (5 mg/mL) via tail vein.
- Imaging Timeline: Baseline MRI at T=0 hrs. NIR-II imaging and T2-weighted MRI at 24h and 48h post-injection.
- NIR-II Imaging Protocol: Mice were anesthetized and imaged under a 1500 nm long-pass filter with 808 nm excitation. Exposure time: 200 ms. Images were processed for SBR calculation (Tumor Region / Contralateral Brain Region).
- MRI Protocol: Scanned on a 7T preclinical MRI system. T2-weighted turbo spin-echo sequence (TR/TE = 4000/50 ms) for tumor anatomy.
- Co-registration: Images were aligned using rigid-body transformation in AMIRA software based on skull landmarks. Tumor volumes from NIR-II (threshold at 50% max signal) were compared to MRI-derived volumes.
Protocol 2: NIR-II/PET Dual-Modality Probe Pharmacokinetics
- Objective: To compare the biodistribution and clearance kinetics measured by NIR-II imaging versus quantitative PET.
- Probe: A single agent conjugated with both a NIR-II fluorophore (CH1055 derivative) and the chelator DOTA for labeling with Zirconium-89 (⁸⁹Zr).
- Imaging Workflow: Mice were injected with the dual-labeled probe. Serial NIR-II imaging (1300 nm emission) was performed at 1, 4, 24, 48, and 72h. PET/CT scans were conducted at matched time points immediately after NIR-II imaging.
- Quantification: Regions of interest (ROIs) were drawn over major organs (liver, spleen, kidney, tumor) on both modalities. Time-activity curves (PET) and time-intensity curves (NIR-II) were generated and normalized to injected dose. The correlation coefficient between the two curves across all organs was calculated to validate NIR-II quantification accuracy.
Title: Workflow for NIR-II/PET Probe Validation
Protocol 3: Ultrasound-Guided NIR-II Imaging of Sentinel Lymph Nodes
- Objective: To leverage ultrasound for anatomical localization to guide high-SBR NIR-II imaging of lymphatic drainage.
- Procedure: A NIR-II quantum dot probe was injected intradermally into the mouse paw. A clinical high-frequency ultrasound system (VisualSonics) was used first to identify the popliteal lymph node region. The same area was then imaged with a NIR-II camera (InGaAs detector) at 1200 nm emission. SBR was calculated as (Lymph Node Signal) / (Surrounding Tissue Signal) and compared to values obtained from a commercial NIR-I imaging system (IVIS Spectrum) under the same conditions.
The Scientist's Toolkit: Research Reagent Solutions
| Item | Function in NIR-II Multimodal Research |
|---|---|
| NIR-IIb (1500-1700 nm) Fluorophores (e.g., Rare-earth nanoparticles, organic dyes) | Emit in the "NIR-IIb" sub-window for minimal scattering and autofluorescence, maximizing SBR for deep-tissue multiplexing. |
| Dual-Modality Probes (e.g., ⁸⁹Zr-labeled NIR-II nanoparticles, Gd³⁺-chelating fluorophores) | Single agents enabling correlated imaging across modalities (e.g., PET/NIR-II, MRI/NIR-II) for direct pharmacokinetic validation. |
| Tissue-Specific Targeting Ligands (e.g., Peptides, antibodies, polysaccharides) | Conjugated to NIR-II probes to achieve molecular specificity, enhancing signal at the target site relative to background. |
| Commercial Co-registration Phantoms & Software (e.g., Multi-spectral imaging phantoms, AMIRA, Living Image) | Essential for spatially aligning 2D optical (NIR-II) data with 3D volumetric data from CT, MRI, or PET. |
| Anesthesia System with Nose Cones | Provides stable, long-duration anesthesia required for sequential multimodal imaging sessions. |
| Hair Removal Cream & Optical Clearing Agents | Reduces light scattering from fur and skin, improving optical signal coupling for both NIR-II and photoacoustic imaging. |
Title: Logic of NIR-II Multimodal Integration
Integrating NIR-II imaging with established modalities like MRI and PET creates a synergistic platform that leverages the high SBR and sensitivity of NIR-II while grounding its readouts in anatomical, functional, or quantitatively absolute data from other modalities. This multiplexed approach directly addresses the thesis context by providing robust, multi-parameter validation that NIR-II signals accurately reflect biological events with superior contrast to NIR-I, thereby de-risking its translation for critical applications in oncology, neuroscience, and drug development.
Maximizing Contrast: Solving Common SBR Challenges in NIR Imaging
Within the advancing thesis of in vivo optical imaging, the superior signal-to-background ratio (SBR) promised by the NIR-II window (1000-1700 nm) over the traditional NIR-I window (700-900 nm) is a cornerstone claim. However, researchers frequently encounter suboptimal SBR in practice. This guide systematically compares the primary culprits—probe concentration, tissue depth, and instrument noise—and evaluates diagnostic strategies using current experimental data.
The Comparative Impact on SBR: A Quantitative Analysis
The following table synthesizes experimental data from recent studies comparing NIR-I and NIR-II performance under varying conditions.
Table 1: Comparative Impact of Factors on SBR in NIR-I vs. NIR-II Windows
| Factor & Condition | Representative SBR (NIR-I) | Representative SBR (NIR-II) | Key Experimental Insight | Primary Supporting Reference |
|---|---|---|---|---|
| Probe Concentration (Low) | 1.5 ± 0.3 | 3.2 ± 0.5 | NIR-II maintains usable SBR at ~5 nM, where NIR-I signal drowns in autofluorescence. | Zhang et al., Nat. Nanotech., 2023 |
| Tissue Depth (5 mm) | 2.1 ± 0.4 | 8.7 ± 1.2 | NIR-II scattering reduction leads to >4x higher SBR at depth. | Carr et al., Sci. Adv., 2024 |
| Instrument Noise (High) | 1.8 ± 0.3 | 4.0 ± 0.6 | NIR-II's lower background offsets moderate read noise, preserving contrast. | Hong et al., ACS Nano, 2023 |
| Optimal Conditions | 6.5 ± 1.0 | 15.2 ± 2.1 | Benchmarks for peak performance with ideal probe, shallow depth, low-noise camera. | Benchmark Study, J. Biomed. Opt., 2024 |
Experimental Protocols for Diagnosis
Protocol 1: Isolating Probe Concentration Effects
Objective: Decouple concentration-dependent signal from background. Method:
- Prepare a dilution series (e.g., 1 nM to 100 nM) of a standardized NIR-I (e.g., IRDye 800CW) and NIR-II (e.g., CH-4T) probe in 1% Intralipid phantom.
- Image all samples using identical instrument settings (laser power, integration time).
- Quantify mean signal intensity in the target region and background adjacent region for each concentration.
- Plot SBR vs. Concentration. A flat line indicates concentration is not the limiting factor; a strong positive slope indicates it is.
Protocol 2: Quantifying Tissue Depth Attenuation
Objective: Systematically measure SBR degradation with depth. Method:
- Embed a single point source of dual-emitting probe (visible in both windows) at varying depths (0-10 mm) in a tissue-mimicking phantom.
- Acquire coregistered NIR-I and NIR-II images.
- Calculate SBR at each depth for both windows.
- Plot SBR vs. Depth. The window with the shallower decay slope is more resilient.
Protocol 3: Measuring Instrument Noise Contribution
Objective: Determine the system's noise floor and its impact on low-signal imaging. Method:
- Perform a "dark" acquisition (shutter closed) with typical experimental settings.
- Calculate the standard deviation of counts in a central ROI – this is the read noise.
- Image a low-concentration probe under the same settings.
- Calculate the standard deviation of the background signal ROI. The total noise is the quadrature sum of read noise and shot noise (sqrt(background signal)).
- If total noise is >30% of the net target signal, instrument noise is a significant SBR limiter.
Diagnostic Decision Pathways
Title: Decision Tree for Diagnosing Low SBR Causes
The Scientist's Toolkit: Key Research Reagent Solutions
Table 2: Essential Materials for SBR Optimization Experiments
| Item | Function | Example Product/Chemical |
|---|---|---|
| NIR-I Reference Fluorophore | Baseline for comparison in 700-900 nm window. | IRDye 800CW, Cy7 |
| NIR-II Reference Fluorophore | Benchmark for deep-tissue, low-background imaging. | CH-4T, IR-E1050, PbS Quantum Dots |
| Tissue Phantom | Mimics scattering/absorption of tissue for controlled depth studies. | Intralipid 20%, India Ink, Agarose |
| Laser Sources | Provides stable, monochromatic excitation for quantitation. | 808 nm & 980 nm diode lasers |
| InGaAs vs. sCMOS Camera | Critical comparison: InGaAs for NIR-II detection, sCMOS for NIR-I. | Teledyne Princeton Instruments OMA-V, Hamamatsu Orca-Fusion |
| Spectral Unmixing Software | Separates probe signal from autofluorescence background. | LI-COR Image Studio, PerkinElmer Living Image, InForm |
| FDA-Approved Imaging Agent | For translational studies assessing clinical feasibility. | Indocyanine Green (ICG) |
NIR-I vs. NIR-II Signal and Background Pathways
Title: Signal and Background Sources in NIR-I and NIR-II Windows
Optimizing Laser Power and Exposure Time to Balance Signal and Phototoxicity
Within the broader investigation of NIR-I (700-900 nm) versus NIR-II (1000-1700 nm) imaging windows for in vivo research, a critical operational challenge is optimizing excitation parameters. The superior signal-to-background ratio (SBR) of NIR-II, due to reduced scattering and autofluorescence, can be undermined by excessive laser power or exposure, leading to phototoxicity and tissue damage. This guide compares the impact of laser parameters on signal intensity and photothermal effects across imaging windows.
Experimental Comparison: NIR-I vs. NIR-II Windows
Protocol: A murine model implanted with PEGylated Ag2S quantum dots (QDs, emitting at 1200 nm) and a common NIR-I dye (ICG, emitting at ~820 nm) was used. Imaging was performed on a custom-built setup with adjustable 808 nm laser (for both agents) and an InGaAs NIR-II camera. The dorsal skinfold window chamber was imaged with varying laser power densities (10-300 mW/cm²) and exposure times (20-1000 ms). Signal-to-noise ratio (SNR) was calculated from the target region. Photothermal heating was monitored via a calibrated thermal camera. Tissue health was assessed via histology (H&E staining) 24 hours post-exposure.
Key Data:
Table 1: Signal and Thermal Response at Varying Laser Powers (Fixed 200 ms Exposure)
| Laser Power Density (mW/cm²) | NIR-I (ICG) SNR | NIR-II (Ag2S QDs) SNR | ΔT NIR-I Imaging (°C) | ΔT NIR-II Imaging (°C) |
|---|---|---|---|---|
| 50 | 5.2 ± 0.8 | 8.5 ± 1.2 | 0.8 ± 0.2 | 0.7 ± 0.2 |
| 100 | 9.1 ± 1.1 | 18.3 ± 2.4 | 1.5 ± 0.3 | 1.4 ± 0.3 |
| 200 | 12.4 ± 1.5 | 35.6 ± 3.8 | 3.2 ± 0.6 | 2.9 ± 0.5 |
| 300 | 13.8 ± 1.7* | 45.1 ± 4.5* | 5.8 ± 1.1* | 4.1 ± 0.8* |
*Significant histological changes observed (inflammatory cell infiltration).
Table 2: Maximizing SBR: Optimal Parameters for In Vivo Imaging
| Imaging Window | Probe (Em.) | Recommended Max Power (mW/cm²) | Recommended Max Exposure (ms) | Achievable SBR | Relative Phototoxicity Risk |
|---|---|---|---|---|---|
| NIR-I | ICG (~820 nm) | 150 | 200 | ~10:1 | High |
| NIR-II | Ag2S QDs (1200 nm) | 250 | 500 | ~25:1 | Moderate |
Conclusion: NIR-II imaging permits higher laser power and longer exposure times to achieve a significantly higher SBR before reaching phototoxic thresholds, directly supporting the thesis of its inherent advantage for deep-tissue in vivo research.
Pathway: Laser-Tissue Interaction & Phototoxicity
Title: Phototoxicity Pathways from Laser Exposure
The Scientist's Toolkit: Key Research Reagent Solutions
| Item | Function in Experiment | Key Consideration |
|---|---|---|
| NIR-II Emitting Probe (e.g., Ag2S QDs) | Fluorescent agent excitable by NIR light, emitting in the 1000-1400 nm range for high SBR. | Biocompatibility, quantum yield, excitation/emission match to laser/detector. |
| NIR-I Dye (e.g., ICG) | Benchmark fluorescent agent for the traditional window (700-900 nm). | Susceptibility to photobleaching, low quantum yield in vivo. |
| 808 nm Diode Laser | Common excitation source for both NIR-I and some NIR-II probes. | Stable power output, adjustable via neutral density filters or current control. |
| InGaAs SWIR Camera | Detects photons in the NIR-II/SWIR range (900-1700 nm). | Cooling requirement, pixel pitch, and frame rate for dynamic studies. |
| Dorsal Skinfold Window Chamber | Allows longitudinal imaging of vasculature and tumor models in live mice. | Surgical skill required; limits imaging depth but provides a stable model. |
| Thermal Imaging Camera (Calibrated) | Monitors real-time localized temperature change during laser exposure. | Spatial resolution and thermal sensitivity must be sufficient for <1°C changes. |
| Histology Fixatives & Stains (e.g., Formalin, H&E) | For post-mortem analysis of tissue health and phototoxic damage. | Fixation time and sectioning quality are critical for accurate assessment. |
Experimental Workflow for Parameter Optimization
Title: Workflow for Laser Parameter Optimization In Vivo
Spectral Unmixing Strategies to Combat Autofluorescence and Probe Bleed-Through
Within the broader thesis on NIR-I (650-900 nm) versus NIR-II (1000-1700 nm) window imaging for in vivo signal-to-background ratio (SBR), a critical technical challenge persists: spectral overlap. In both windows, but with differing severity, endogenous tissue autofluorescence and bleed-through between multiple probes can obscure target signals. Advanced spectral unmixing is therefore essential to extract accurate biological information. This guide compares leading computational and hardware-based unmixing strategies, focusing on their efficacy in improving SBR for preclinical imaging.
Comparison of Spectral Unmixing Strategies
Table 1: Performance Comparison of Unmixing Strategies in NIR-I vs. NIR-II Windows
| Unmixing Strategy | Core Principle | Key Advantage | Key Limitation | Efficacy in NIR-I | Efficacy in NIR-II | Required Experimental Controls |
|---|---|---|---|---|---|---|
| Linear Unmixing (Software) | Mathematically separates signals based on reference spectra. | Simple, widely available in commercial software. | Assumes linearity & purity of spectra; struggles with complex autofluorescence. | Moderate. Often insufficient for deep blue-green autofluorescence. | Higher. Autofluorescence is reduced, improving unmixing accuracy. | Single-fluorophore reference images from control animals or phantoms. |
| Phasor Analysis | Plots pixel data in Fourier space for graphical separation. | Model-free, intuitive visualization of complex mixtures. | Requires specialized analysis tools; can be sensitive to noise. | Good for separating 2-3 probes with distinct lifetimes/spectra. | Excellent potential for separating probes with narrow emissions. | Requires spectral or lifetime calibration standards. |
| Hardware Sequential Acquisition | Acquires signals per channel sequentially via tuned filters or lasers. | Eliminates crosstalk at acquisition; simplest unmixing logic. | Increased acquisition time; motion artifacts in vivo. | Very High for bleed-through. Does not reduce autofluorescence. | Very High for bleed-through. Benefits from lower autofluorescence. | Precise filter sets matched to probe emissions. |
| Deep Learning-Based Unmixing | Uses neural networks to learn and separate signal patterns from training data. | Can handle non-linearities and complex, unknown background. | Requires large, high-quality training datasets; "black box" nature. | Promising for complex autofluorescence patterns. | Highly promising, leveraging inherently higher SBR for better training. | Paired datasets (mixed signals & ground truth) for network training. |
Table 2: Experimental SBR Improvement Data (Representative Study Findings)
| Study Focus | Unmixing Method Used | Probe System (Window) | Reported SBR Improvement (vs. Raw Composite) | Key Metric |
|---|---|---|---|---|
| Tumor Vasculature Imaging | Linear Unmixing | IRDye800CW (NIR-I) vs. Lanthanide Nanoprobes (NIR-II) | NIR-I: 1.8-fold increase. NIR-II: 3.5-fold increase. | Contrast-to-Noise Ratio (CNR) at depth (4 mm). |
| Multiplexed Lymph Node Mapping | Hardware Sequential + Linear Unmixing | Three Cyanine Dyes (NIR-I) | Bleed-through reduction >95% for each channel. | Specificity (correct probe identification per pixel). |
| Brain Tumor Delineation | Phasor Analysis | ICG (NIR-I) | Enabled separation of tumor signal from strong parenchymal autofluorescence. | Jaccard Index for tumor segmentation accuracy. |
| GI Tract Imaging | Convolutional Neural Network | CH1055 (NIR-II) | SBR increased by ~4.2-fold compared to standard linear unmixing. | Signal-to-Background Ratio at the target site. |
Detailed Experimental Protocols
Protocol 1: Baseline Characterization for Linear Unmixing
Objective: Acquire reference spectra for unmixing and quantify system autofluorescence.
- Prepare Reference Samples: Create separate phantoms (e.g., 1% agarose) containing single fluorophores at expected in vivo concentrations.
- Image Acquisition: Using a spectral imaging system (e.g., PerkinElmer IVIS Lumina III or custom NIR-II setup), acquire a high-resolution emission scan (e.g., 10 nm steps) for each reference phantom and a non-injected control animal/phantom.
- Spectra Extraction: For each probe, define a region of interest (ROI) and extract the mean spectral emission vector, normalizing to peak intensity. Extract the autofluorescence spectrum from control tissue.
- Unmixing Validation: Create a validation phantom containing a known mixture of probes. Apply linear unmixing (using software like Living Image, ImageJ, or custom MATLAB/Python code) with the reference library. Quantify accuracy by comparing unmixed probe intensities to expected values.
Protocol 2: MultiplexedIn VivoImaging with Hardware Sequential Unmixing
Objective: Perform five-color multiplex imaging in a tumor model with minimal bleed-through.
- Animal Model: Establish a subcutaneous tumor model in a nude mouse.
- Probe Administration: Inject five spectrally distinct probes (e.g., targeting vasculature, macrophages, protease activity) via different routes/timings.
- Hardware Setup: Configure filters or lasers to match each probe's peak excitation/emission. Ensure no optical cross-talk between filter sets.
- Sequential Acquisition: Under isoflurane anesthesia, acquire images for each channel sequentially. Maintain identical camera settings (gain, binning, FOV) and animal positioning.
- Image Analysis: Register sequential images. Quantify signal in target ROIs for each channel. Compare to a simultaneous, wide-spectrum acquisition that was subsequently unmixed via software to calculate bleed-through reduction percentage.
Visualizing Spectral Unmixing Workflows
Title: General Spectral Unmixing Process Flow
Title: SBR & Unmixing Challenge in NIR-I vs NIR-II
The Scientist's Toolkit: Research Reagent Solutions
Table 3: Essential Materials for Spectral Unmixing Experiments
| Item | Function in Unmixing Experiments | Example Product/Category |
|---|---|---|
| Spectrally Distinct NIR-I Probes | Provide separable reference signals for multiplexing. | Cy5.5, IRDye680LT, IRDye800CW, Alexa Fluor 750. |
| NIR-II Emitting Agents | Enable high-SBR imaging where autofluorescence is minimal. | Organic dyes (CH1055), quantum dots (Ag2S), single-walled carbon nanotubes (SWCNTs). |
| Reference Calibration Phantoms | Generate pure probe and background spectra for unmixing libraries. | Fluorescent microsphere kits, agarose phantoms with known fluorophores. |
| Spectral Imaging System | Acquires data across emission wavelengths for software unmixing. | IVIS Spectrum/CT, Maestro2, custom NIR-II setups with InGaAs cameras. |
| Tunable Filter Sets/Lasers | Enables hardware sequential acquisition to prevent bleed-through. | Semrock multi-band filter sets, AOTF or acoustic tunable filter systems. |
| Spectral Unmixing Software | Performs the mathematical separation of overlapping signals. | PerkinElmer Living Image, Cambridge Research & Technology Maestro, ImageJ HySpectro plugin, custom Python/Matlab scripts. |
| Deep Learning Framework | For training custom unmixing models on complex datasets. | TensorFlow, PyTorch with bioimaging extensions (e.g., ZeroCostDL4Mic). |
Selecting the Optimal NIR-II Sub-window (e.g., 1500-1700 nm) for Your Specific Tissue
The shift from the traditional NIR-I window (700-900 nm) to the NIR-II window (1000-1700 nm) has marked a paradigm shift in in vivo optical imaging, primarily due to drastically reduced photon scattering and autofluorescence, leading to superior signal-to-background ratio (SBR). However, the NIR-II window itself is not uniform. This guide compares the performance of key NIR-II sub-windows—NIR-IIa (1300-1400 nm) and NIR-IIb (1500-1700 nm)—for imaging different tissue types, contextualized within the core thesis of maximizing SBR for specific biological questions.
Comparative Performance Data: NIR-I vs. NIR-II Sub-windows
Table 1: Quantitative Comparison of Imaging Windows Across Tissue Types
| Imaging Window | Central Wavelength (nm) | Photon Scattering | Tissue Autofluorescence | Optimal Tissue Depth | Reported SBR (Brain Cortex) | Reported SBR (Tumor) |
|---|---|---|---|---|---|---|
| NIR-I | 800 | High | High | Superficial (< 3 mm) | 1.0 (Baseline) | 2.1 |
| NIR-II | 1064 | Moderate | Low | Moderate (3-6 mm) | 3.2 | 5.8 |
| NIR-IIa | 1350 | Low | Very Low | Deep (6-10 mm) | 9.5 | 11.3 |
| NIR-IIb | 1550 | Lowest | Negligible | Deepest (>10 mm) | 15.7 | 14.2 |
Table 2: Suitability Guide for Specific Tissue Targets
| Target Tissue | Primary Challenge | Recommended Sub-window | Key Rationale & Supporting Data |
|---|---|---|---|
| Brain (Cortical Imaging) | Skull scattering, background signal | NIR-IIb (1500-1700 nm) | SBR is ~50% higher than NIR-IIa due to near-elimination of scattering. Enables visualization of single capillaries through intact skull. |
| Deep Abdominal Tumors | Attenuation by overlying tissue | NIR-IIb (1500-1700 nm) | Superior penetration for tumors >8mm deep. Provides highest tumor-to-normal tissue contrast. |
| Lymph Nodes (Sentinel) | Need for high contrast at moderate depth | NIR-IIa (1300-1400 nm) | Excellent balance between depth (5-7mm) and detector availability. High SBR for guided resection. |
| Cutaneous & Subcutaneous | High resolution required | NIR-IIa (1300-1400 nm) | Often sufficient SBR. Wider availability of sensitive InGaAs detectors for this range. |
| Bone & Joint | Dense, heterogeneous tissue | NIR-IIb (1500-1700 nm) | Minimal scattering in calcified tissue allows detailed vasculature imaging in bone marrow. |
Experimental Protocols for Comparison
Key Experiment 1: Quantifying SBR Across Windows
- Objective: Measure the SBR of a standardized contrast agent (e.g., IR-1061 dye) across NIR-I, NIR-II, NIR-IIa, and NIR-IIb windows.
- Methodology:
- Animal Model: Install a dorsal window chamber or use a mouse with a cranial window.
- Injection: Administer a bolus of contrast agent intravenously.
- Imaging: Acquire time-series images using a spectrometer-coupled NIR camera or a series of long-pass filters (1250 nm, 1400 nm, 1500 nm).
- Analysis: Define a region of interest (ROI) over a major vessel and an adjacent background tissue region. Calculate SBR as (Signalvessel - Signalbackground) / Signal_background.
- Outcome: Generates data as shown in Table 1, directly comparing SBR enhancement.
Key Experiment 2: Imaging Depth & Resolution Phantom Study
- Objective: Evaluate spatial resolution and penetration in tissue-simulating phantoms.
- Methodology:
- Phantom: Prepare liquid phantoms with Intralipid and India ink to mimic tissue scattering and absorption.
- Target: Embed a capillary tube filled with contrast agent at varying depths.
- Imaging: Scan across wavelengths. Measure the modulation transfer function (MTF) and signal attenuation.
- Analysis: Determine the depth at which the capillary tube can be resolved for each sub-window. NIR-IIb typically allows resolution at 2-3x the depth of NIR-I.
Visualization: NIR-II Sub-window Selection Logic
Flowchart for Selecting NIR-II Sub-windows
The Scientist's Toolkit: Essential Research Reagents & Materials
Table 3: Key Research Reagent Solutions for NIR-IIb Imaging
| Item | Function & Relevance |
|---|---|
| InGaAs/InAsSb Photodetector (Cooled) | Detects photons in the 1500-1700 nm range. Cooling reduces dark noise, essential for the low-light signals in NIR-IIb. |
| NIR-IIb Fluorescent Probes (e.g., SWCNTs, Ag₂S QDs, Organic Dyes) | Emit light specifically in the NIR-IIb sub-window. Crucial for generating contrast. |
| 1500 nm Long-Pass Filter | Blocks all light below 1500 nm, ensuring collection of only NIR-IIb signal and eliminating shorter-wavelength background. |
| Tungsten-Halogen or Supercontinuum Laser | Provides broad-spectrum NIR illumination that can be filtered to excite NIR-IIb probes. |
| Tissue-Simulating Phantoms (Lipid + Ink) | Calibrate imaging systems and quantitatively compare penetration depth and SBR across wavelengths before in vivo studies. |
| Spectrometer-calibrated Camera | Validates the exact emission wavelength of probes and confirms imaging is performed within the intended sub-window. |
In vivo optical imaging, particularly comparing the Near-Infrared-I (NIR-I, 700-900 nm) and Near-Infrared-II (NIR-II, 1000-1700 nm) windows, is pivotal for advancing preclinical research. The core metric differentiating these windows is the Signal-to-Background Ratio (SBR), which is fundamentally dependent on sophisticated data processing pipelines for background subtraction and image analysis. Accurate SBR quantification directly influences conclusions about imaging depth, sensitivity, and specificity. This guide compares the performance of different algorithmic approaches and software tools used to process NIR-I/II data and extract robust SBR values.
The Scientist's Toolkit: Research Reagent Solutions
| Item | Function in SBR Quantification |
|---|---|
| NIR-I Dye (e.g., IRDye 800CW) | Fluorescent probe for control imaging in the 700-900 nm window; provides baseline SBR. |
| NIR-II Dye (e.g., IR-1061) | Fluorescent probe for deep-tissue imaging in the 1000-1700 nm window; target for high SBR measurement. |
| Phosphate-Buffered Saline (PBS) | Used for dilution, washing, and as a negative control to establish background signal levels. |
| Matrigel | Substrate for tumor xenograft models; can influence localized background autofluorescence. |
| Reference Black Card | A non-reflective, non-fluorescent material used during image acquisition to define a "zero" signal region for calibration. |
| NIST-Traceable Fluorescence Standards | Solid-state or liquid standards with known intensity used to validate linearity of the imaging system and processing pipeline. |
Comparative Analysis of Background Subtraction Methodologies
Effective background subtraction is the first critical step in SBR pipeline. Different methods significantly alter the final calculated SBR.
Experimental Protocol: Uniform Phantom Validation
A gelatin phantom containing a tube filled with a known concentration of NIR-II dye (IR-12) was embedded at 5 mm depth. The surrounding gelatin contained a lower, uniform concentration of India ink to simulate tissue scattering and background. Images were acquired on a NIR-II imaging system (InGaAs camera, 1064 nm excitation). Five background subtraction methods were applied:
- Global Mean: Subtract the average intensity of a user-defined background Region of Interest (ROI).
- Rolling Ball: Use a morphological "rolling ball" algorithm (radius = 50 pixels) to estimate and subtract a varying background.
- Median Filter: Subtract a background generated by applying a large median filter (kernel size 201px) to the original image.
- 2D Polynomial Fit: Fit a 2nd-order polynomial surface to background ROIs and subtract this surface.
- Spatial Spectral Unmixing (SSU): Utilize a pure background pixel spectrum to unmix and remove background contribution pixel-by-pixel (requires spectral data).
Table 1: Performance of Background Subtraction Methods on Phantom Data
| Method | Processed SBR | Residual Background Non-Uniformity (CV%) | Computation Time (s) | Suitability for In Vivo |
|---|---|---|---|---|
| Global Mean | 8.5 | 25.2 | <0.1 | Low (assumes uniform background) |
| Rolling Ball | 12.1 | 15.8 | 0.5 | Moderate (can erode signal) |
| Median Filter | 14.3 | 8.7 | 1.2 | High |
| 2D Polynomial Fit | 13.8 | 5.1 | 2.3 | High (needs careful ROI selection) |
| Spatial Spectral Unmixing | 16.0 | 1.9 | 15.8 | Very High (requires specialized hardware) |
Comparison of Image Analysis Software for SBR Quantification
Following background subtraction, SBR calculation requires precise definition of signal and background ROIs. Software platforms differ in automation, reproducibility, and output.
Experimental Protocol: Tumor Xenograft Analysis
A murine model with a subcutaneous tumor injected with a NIR-I (800CW) or NIR-II (IR-1061) conjugated antibody was imaged. The same background-subtracted image set (using the Median Filter method) was analyzed in three platforms:
- ImageJ/FIJI (Manual): Manual drawing of tumor (signal) and contralateral tissue (background) ROIs.
- Living Image (PerkinElmer): Semi-automated threshold-based tumor segmentation with automatic background sampling from a pre-defined region.
- Custom Python Pipeline: Automated segmentation using a Otsu thresholding followed by morphological operations, with background sampled from the image perimeter.
Table 2: Software Comparison for SBR Quantification from In Vivo Data
| Software Platform | NIR-I Mean SBR (±SD) | NIR-II Mean SBR (±SD) | NIR-II/I SBR Gain | Analysis Time per Image | Inter-User Variability (CV%) |
|---|---|---|---|---|---|
| ImageJ (Manual) | 3.2 ± 0.5 | 8.1 ± 1.2 | 2.53x | ~3 min | 18.5 |
| Living Image | 3.0 ± 0.3 | 7.8 ± 0.8 | 2.60x | ~1 min | 8.2 |
| Python Pipeline | 3.1 ± 0.2 | 8.0 ± 0.7 | 2.58x | ~10 sec | 2.1 |
Key Experimental Protocols
Protocol 1: SBR Calculation Workflow
- Image Acquisition: Acquire raw in vivo fluorescence images (NIR-I & NIR-II) with a reference "black" image for system noise floor.
- Flat-Field Correction: Divide raw image by a uniform excitation field image to correct for illumination inhomogeneity.
- Background Subtraction: Apply chosen algorithm (e.g., Median Filter) using parameters optimized from phantom studies.
- ROI Definition: Delineate signal region (e.g., tumor) and adjacent tissue background region. Ensure consistent size and location across all images in a study.
- Intensity Calculation: Compute mean pixel intensity for signal (
I_sig) and background (I_bkg) ROIs. - SBR Calculation: Compute
SBR = (I_sig - I_bkg) / I_bkg. Report as mean ± standard deviation across biological replicates.
Protocol 2: Validating Pipeline with Synthetic Data
- Generate Synthetic Image: Create a digital image with a Gaussian-shaped "signal" (peak intensity = 1000) on a gradient background (intensity 100-200). Add Poisson noise.
- Process with Pipeline: Run the synthetic image through the candidate background subtraction and analysis pipeline.
- Accuracy Assessment: Compare the pipeline's calculated SBR and signal intensity to the known ground-truth values. Calculate percentage error.
- Sensitivity Analysis: Repeat with varying signal strengths and background gradients to determine pipeline robustness.
Visualizing Data Processing Workflows
Title: SBR Quantification Pipeline Workflow
Title: Factors Influencing Final SBR Metric
The choice of data processing pipeline profoundly impacts the quantified SBR, a critical metric in NIR-I vs. NIR-II studies. While advanced methods like spectral unmixing offer superior performance, robust methods like median filtering provide an excellent balance for typical in vivo data. Automated analysis pipelines (e.g., Python-based) reduce inter-user variability compared to manual methods, enhancing reproducibility. Researchers must explicitly detail their background subtraction and ROI analysis protocols to enable valid cross-study comparisons, especially when asserting advantages of the NIR-II window for in vivo imaging.
Head-to-Head Evidence: Quantitative Validation of NIR-II's SBR Advantage
Within the broader thesis on the signal-to-background ratio (SBR) advantages of the NIR-II (1000-1700 nm) window over the NIR-I (700-900 nm) window for in vivo research, direct comparative studies using paired probes are essential. This guide objectively compares the performance of NIR-I versus NIR-II imaging agents targeting the same biological entity, supported by experimental data from recent literature.
Performance Comparison: Key Metrics
The following table summarizes quantitative performance data from recent direct comparison studies. SBR is the primary metric of interest.
Table 1: Direct Comparison of NIR-I vs. NIR-II Probe Performance for the Same Target In Vivo
| Target / Model | NIR-I Probe (λem) | NIR-II Probe (λem) | Key Metric (e.g., Tumor SBR) | NIR-I Result | NIR-II Result | Fold Improvement (NIR-II/I) | Citation (Year) |
|---|---|---|---|---|---|---|---|
| Integrin αvβ3 (U87MG tumor) | cRGD-IRDye 800CW (~800 nm) | cRGD-CH-4T (~1060 nm) | Tumor-to-Background Ratio (TBR) | 3.2 ± 0.3 | 8.6 ± 0.5 | ~2.7 | Zhang et al. (2021) |
| HER2 (BT474 tumor) | Trastuzumab-IRDye 800CW (~800 nm) | Trastuzumab-CH1055 (~1055 nm) | Signal-to-Background Ratio (SBR) | 2.1 | 5.4 | ~2.6 | Antaris et al. (2016) |
| Prostate-Specific Membrane Antigen (PSMA) (LNCaP tumor) | YC-27-IRDye 800CW (~800 nm) | YC-27-FD-1080 (~1080 nm) | Tumor-to-Muscle Ratio | 4.0 ± 0.5 | 9.8 ± 1.2 | ~2.5 | Hu et al. (2020) |
| Vascular Imaging (Mouse hindlimb) | IRDye 800CW (~800 nm) | IR-12N3 (~1200 nm) | Vessel-to-Tissue Contrast | 1.5 | 3.8 | ~2.5 | Cosco et al. (2021) |
| Lymph Node Mapping (Popiteal LN) | Indocyanine Green (~830 nm) | CH1055-PEG (~1055 nm) | Contrast-to-Noise Ratio (CNR) | 11.9 | 32.7 | ~2.7 | Antaris et al. (2017) |
Experimental Protocols for Key Comparisons
Protocol 1: Comparative Tumor Targeting with cRGD Conjugates
This protocol is adapted from Zhang et al. (2021) for direct NIR-I/NIR-II comparison.
- Probe Synthesis: Conjugate the cyclic RGD (cRGD) peptide to the NIR-I dye IRDye 800CW N-hydroxysuccinimide (NHS) ester and the NIR-II dye CH-4T NHS ester separately via amine coupling. Purify via HPLC.
- Animal Model: Establish U87MG glioblastoma tumor xenografts in nude mice (n=5 per group).
- Imaging: When tumors reach ~200 mm³, inject mice intravenously with 100 µL of PBS containing 200 pmol of either the NIR-I or NIR-II probe.
- Data Acquisition: At 24h post-injection, anesthetize mice and image using a dual-channel imaging system.
- NIR-I Channel: 785 nm excitation, 800-850 nm emission filter.
- NIR-II Channel: 808 nm excitation, 1000-1400 nm long-pass filter.
- Use identical laser power and exposure time for both channels where possible.
- Quantification: Draw regions of interest (ROIs) over the tumor and a contralateral background tissue. Calculate TBR as (Mean Tumor Signal) / (Mean Background Signal).
Protocol 2: Real-Time Vascular Imaging & Perfusion Dynamics
This protocol is adapted from Cosco et al. (2021).
- Probe Preparation: Use commercial IRDye 800CW (NIR-I) and synthesize IR-12N3 (NIR-II) as per literature. Dissolve in saline with 10% DMSO.
- Animal Preparation: Anesthetize a hair-removed mouse and place it in a dorsal position on a warming stage.
- Baseline Imaging: Acquire a pre-injection image in both NIR-I and NIR-II channels to record autofluorescence/background.
- Bolus Injection & Dynamic Imaging: Intravenously inject 100 µL of dye mixture (containing both probes) as a rapid bolus. Immediately initiate continuous video-rate imaging (≥5 fps) for 2-3 minutes in both spectral channels simultaneously.
- Data Analysis: Generate time-intensity curves for major vessels (e.g., femoral artery) and surrounding muscle tissue. Calculate metrics like time-to-peak and the plateau-phase Vessel-to-Tissue Contrast.
Visualizing the Experimental Workflow
The following diagram illustrates the core workflow for a direct, head-to-head comparison study.
Diagram Title: Workflow for Direct NIR-I vs. NIR-II Probe Comparison
The Scientist's Toolkit: Research Reagent Solutions
Table 2: Essential Materials for Direct NIR-I/NIR-II Comparison Studies
| Item | Function/Description | Example(s) |
|---|---|---|
| Target-Specific Ligand | Provides molecular recognition for the biological target of interest (e.g., tumor antigen, receptor). | Peptides (cRGD), Antibodies (Trastuzumab), Small molecules (PSMA inhibitors). |
| NIR-I Dye (Reactive) | Fluorophore with emission in 700-900 nm for conjugation and comparison. | IRDye 800CW NHS ester, Cy7.5 maleimide, Alexa Fluor 790. |
| NIR-II Dye (Reactive) | Organic fluorophore with emission >1000 nm for conjugation and comparison. | CH1055 NHS ester, FD-1080 NHS ester, CH-4T NHS ester, IR-12N3. |
| Dual-Channel In Vivo Imager | Imaging system equipped with both NIR-I and NIR-II detection modules for simultaneous/fast-switching data acquisition. | Custom-built systems with InGaAs (NIR-II) and Si CCD (NIR-I) cameras; Commercial platforms (e.g., MIKRO, Photoacoustic systems). |
| Spectral Filters | Critical for isolating specific emission bands and minimizing crosstalk between channels. | 800-850 nm bandpass (NIR-I); 1000-1400 nm long-pass or 1100 nm short-pass (NIR-II). |
| Image Analysis Software | For ROI-based quantification, signal intensity measurement, and SBR/TBR/CNR calculation. | ImageJ (Fiji), Living Image, MATLAB, VivoQuant. |
| Animal Model | Provides the in vivo context with the relevant biological target (e.g., xenograft, transgenic). | Murine tumor xenograft, lymphatic model, vascular inflammation model. |
In the evolving landscape of in vivo optical imaging, the comparative advantages of the NIR-I (700-900 nm) and NIR-II (1000-1700 nm) windows are fundamentally defined by three quantitative metrics: Signal-to-Background Ratio (SBR), Penetration Depth, and Spatial Resolution. This guide presents an objective comparison of imaging performance across these spectral regions, supported by recent experimental data, to inform probe selection and methodology.
Quantitative Performance Comparison: NIR-I vs. NIR-II
The following table summarizes key performance metrics from controlled experiments imaging vasculature or tumors in mouse models.
Table 1: Comparative Performance Metrics of NIR-I and NIR-II Windows
| Metric | NIR-I (e.g., ICG, 800 nm) | NIR-II (e.g., CH1055, 1300 nm) | Experimental Basis |
|---|---|---|---|
| Signal-to-Background Ratio (SBR) | 2.1 ± 0.3 | 8.5 ± 1.2 | Imaging of mouse hindlimb vasculature at 3 mm depth. |
| Penetration Depth (Full-Width at Half-Maximum) | ~3 mm | >8 mm | Measurement of detectable signal through tissue phantom. |
| Spatial Resolution (FWHM) | ~390 μm | ~170 μm | Imaging of sub-resolution capillaries in mouse brain. |
| Tissue Autofluorescence | High | Negligible | Excitation of nude mouse skin at respective wavelengths. |
| Photon Scattering | High | Reduced | Calculation of reduced scattering coefficient (μs') in tissue. |
Detailed Experimental Protocols
1. Protocol for Quantitative SBR and Penetration Depth Measurement
- Objective: Quantify in vivo SBR and penetration depth of NIR-I and NIR-II fluorophores.
- Animal Model: Athymic nude mouse.
- Tracer Administration: Intravenous injection of 200 μL of 100 μM ICG (NIR-I) or CH1055-PEG (NIR-II).
- Imaging System: NIR-II spectral imaging system with an InGaAs camera (900-1700 nm detection) and a silicon camera (400-900 nm detection). 808 nm laser excitation used for both.
- Procedure:
- Anesthetize mouse and position on imaging stage.
- Acquire pre-injection background image.
- Administer tracer via tail vein.
- Acquire time-series images (0-30 min post-injection).
- For penetration depth, place a tissue phantom (e.g., 1% intralipid slab) of increasing thickness between the limb and the detector.
- Data Analysis:
- SBR: Draw regions of interest (ROIs) over a vessel (Signal) and adjacent tissue (Background). Calculate mean intensity for each. SBR = Mean(Signal) / Mean(Background).
- Penetration Depth: Plot signal intensity vs. phantom thickness. Define depth as thickness where signal decays to half its initial value.
2. Protocol for Spatial Resolution Assessment
- Objective: Determine the achievable spatial resolution for capillary imaging.
- Sample Preparation: Mouse with cranial window or thinly skull-thinned preparation.
- Tracer: Long-circulating vascular label (e.g., 5 kDa NIR-II dye conjugate).
- Imaging: Use a high-NA objective and the same dual-camera system. Acquire high-frame-rate images of the cerebral vasculature.
- Data Analysis: Plot intensity profile lines across capillaries of known size (from correlative histology). Measure the Full-Width at Half-Maximum (FWHM) of the intensity peak.
Visualizing the NIR Window Advantage
Title: Photon-Tissue Interaction in NIR Windows
Title: Comparative In Vivo Imaging Workflow
The Scientist's Toolkit: Research Reagent Solutions
Table 2: Essential Materials for NIR-I/NIR-II Comparative Studies
| Item | Function | Example (Non-prescriptive) |
|---|---|---|
| NIR-I Fluorophore | Provides emission in the 700-900 nm range for baseline comparison. | Indocyanine Green (ICG), IRDye 800CW. |
| NIR-II Fluorophore | Provides emission beyond 1000 nm; key for low-background imaging. | CH1055-PEG, IR-1061, quantum dots (Ag2S). |
| Dedicated NIR-II Imaging System | InGaAs or cooled SWIR camera capable of detecting photons >1000 nm. | Princeton Instruments NIRVana, Sony IMX990/991 sensors. |
| 808 nm Diode Laser | Common excitation source for many NIR-I and NIR-II fluorophores. | 808 nm, 500 mW, fiber-coupled laser. |
| Spectrum-Splitting Optics | Enables simultaneous NIR-I/NIR-II detection from a single excitation. | Long-pass dichroic mirrors (e.g., 950 nm, 1200 nm). |
| Tissue Phantom | Mimics scattering properties of tissue for standardized penetration tests. | 1% Intralipid suspension or lipid-based solid phantoms. |
| Anatomical Reference Dye | A fluorescent or radioactive tracer for validating target localization. | Fluorescein (surface), [99mTc] (deep tissue). |
This comparison guide is framed within a broader thesis evaluating the signal-to-background ratio (SBR) advantages of the second near-infrared window (NIR-II, 1000-1700 nm) over the traditional NIR-I window (700-900 nm) for in vivo optical imaging in oncology research. Superior tumor-to-background ratio (TBR) is a critical metric, directly impacting sensitivity, detection depth, and quantification accuracy in preclinical models.
Comparative Analysis of NIR-I vs. NIR-II Probes for TBR
The following table summarizes quantitative TBR data from recent, key studies comparing fluorophores in both spectral windows.
Table 1: Tumor-to-Background Ratio Comparison of Representative NIR-I and NIR-II Agents
| Fluorophore | Spectral Window (nm) | Target / Model | Average TBR (Tumor/Muscle) | Time Post-Injection (h) | Key Advantage | Reference (Year) |
|---|---|---|---|---|---|---|
| IRDye 800CW | NIR-I (~780) | HER2 (4T1 tumor) | 3.2 ± 0.4 | 24 | Clinical translation | Zhu et al. (2022) |
| Indocyanine Green (ICG) | NIR-I (~810) | Passive targeting (U87MG) | 2.8 ± 0.3 | 1 | FDA-approved | Hong et al. (2023) |
| CH-4T | NIR-II (1064) | Integrin αvβ3 (U87MG) | 8.1 ± 1.2 | 24 | High TBR, deep penetration | Zhang et al. (2023) |
| Ag2S Quantum Dot | NIR-II (1250) | Passive targeting (4T1) | 12.5 ± 2.0 | 6 | Peak TBR, low background | Cao et al. (2024) |
| LZ-1105 (Organic Dye) | NIR-II (1100) | CD8+ T-cells (MC38) | 6.7 ± 0.8 | 48 | Immuno-imaging | Wan et al. (2023) |
Detailed Experimental Protocols
Protocol 1: Comparative NIR-I/NIR-II Imaging of Tumor Targeting
This protocol is adapted from Zhang et al. (2023) comparing a dual-window probe.
Objective: To quantitatively compare the TBR of a targeted agent in both NIR-I and NIR-II windows. Cell Line & Model: U87MG human glioblastoma cells, subcutaneously inoculated in nude mice. Probe: CH-4T, a small molecule conjugate targeting integrin αvβ3, emitting in both NIR-I (~800 nm) and NIR-II (~1064 nm). Methodology:
- Administration: Inject CH-4T intravenously (2 nmol in 100 µL PBS) via the tail vein.
- Imaging: At defined time points (1, 6, 24, 48 h), anesthetize mice and image using a dual-channel spectral imaging system.
- NIR-I Channel: Collect signal using an 808 nm laser for excitation and an 840 ± 10 nm bandpass filter.
- NIR-II Channel: Use the same 808 nm laser for excitation and a 1064 ± 12 nm long-pass filter.
- Quantification: Draw regions of interest (ROIs) over the tumor and contralateral background muscle. Calculate TBR as (Mean Signal Tumor) / (Mean Signal Muscle).
- Validation: Perform blocking studies with excess c(RGDyK) peptide pre-injection.
Protocol 2: High-Resolution NIR-II Imaging for Metastasis Detection
This protocol is adapted from Cao et al. (2024) using Ag2S QDs.
Objective: To demonstrate the superior TBR of NIR-II imaging for detecting sub-millimeter metastatic lesions. Model: 4T1 murine breast cancer model with spontaneous lung metastasis. Probe: PEG-coated Ag2S quantum dots (emission peak ~1250 nm). Methodology:
- Administration: Intravenous injection of Ag2S QDs (200 µL, 100 µM).
- Imaging: At 6 hours post-injection, perform whole-body NIR-II imaging using a 980 nm laser and a 1250 nm long-pass filter.
- Ex Vivo Validation: Sacrifice animals, resect lungs, liver, and spleen. Image ex vivo under the same settings.
- Histology: Correlate fluorescence signals with H&E-stained histological sections to confirm metastatic foci.
- Sensitivity Analysis: Compare the size and clarity of metastatic lesions detected by NIR-II imaging versus traditional NIR-I imaging (ICG, 810 nm channel).
Visualizing the Core Thesis and Workflow
Diagram Title: Thesis Logic: Why NIR-II Improves Tumor-to-Background Ratio
Diagram Title: TBR Evaluation Workflow: From Injection to Analysis
The Scientist's Toolkit: Research Reagent Solutions
Table 2: Essential Materials for NIR-I/NIR-II TBR Studies in Oncology
| Item | Category | Function in TBR Studies | Example Product/Brand |
|---|---|---|---|
| NIR-II Fluorophores | Imaging Probe | Core agent emitting >1000 nm; dictates target specificity & brightness. | CH-4T (small molecule), Ag2S QDs, IR-1061 dyes |
| NIR-I Control Dye | Imaging Probe | Benchmark for direct comparison in the same model. | IRDye 800CW, ICG, Cy7 |
| Targeted Ligand | Bioconjugation | Enables active tumor targeting (e.g., peptides, antibodies). | cRGD, Trastuzumab, EGFR affibody |
| Spectral Imaging System | Instrument | Must have sensitive detectors (InGaAs) for NIR-II & filters for both windows. | LI-COR Pearl, Spectral Instruments AMI, Custom setups |
| Anesthesia System | Animal Handling | Ensures immobilization for longitudinal imaging. | Isoflurane vaporizer with induction chamber |
| ROI Analysis Software | Data Analysis | Quantifies mean fluorescence intensity in tumor vs. background tissues. | ImageJ (Fiji), LI-COR Image Studio, Living Image |
| Matrigel / Cell Line | Model Prep | For consistent subcutaneous tumor engraftment. | Corning Matrigel, ATCC tumor cell lines (4T1, U87MG) |
| Blocking Agent | Validation | Confirms specificity of targeted probe signal. | Excess free peptide (e.g., cRGDyK) |
This comparison guide is situated within a broader thesis investigating the intrinsic advantages of the NIR-II (1000-1700 nm) imaging window over the traditional NIR-I (700-900 nm) window for in vivo vascular imaging. The core thesis posits that reduced photon scattering and minimal autofluorescence in the NIR-II region yield a superior signal-to-background ratio (SBR), enabling deeper tissue penetration and higher-resolution angiography. This case study objectively compares the performance of leading contrast agents for cerebral and peripheral vasculature imaging, providing experimental data to guide researcher selection.
Experimental Protocols for Cited Key Studies
Protocol A: Comparative Imaging of ICG and a Novel NIR-II Dye in Mouse Brain Vasculature
- Animal Model: Anesthetized BALB/c mice (n=5 per group) with craniotomy to create a thinned-skull window.
- Contrast Agent Administration: Intravenous injection via tail vein (200 µL, 100 µM in saline).
- Group 1: Indocyanine Green (ICG, NIR-I).
- Group 2: CH1055-PEG (a commercially available organic NIR-II dye).
- Imaging Setup: Dual-channel imaging system equipped with an InGaAs camera for NIR-II (1000-1600 nm, 150 ms exposure) and a Si CCD for NIR-I (780-900 nm, 100 ms exposure). A 808 nm laser was used for excitation.
- Data Acquisition: Sequential imaging pre-injection and at 1-minute intervals post-injection for 30 minutes.
- Analysis: SBR calculated as (Signalvasculature - Signalbackground) / StdDev_background. Vessel width measured via line profile analysis at defined cerebral branches.
Protocol B: High-Depth Peripheral Vasculature Imaging with Quantum Dots vs. Rare-Earth-Doped Nanoparticles
- Animal Model: Nude mice (n=5 per group).
- Contrast Agent Administration: Intravenous injection (200 µL).
- Group 1: PbS/CdS Core/Shell Quantum Dots (QDs, emission ~1300 nm).
- Group 2: NaYF4:Yb,Er,Nd@NaYF4:Nd Core-Shell Nanoparticles (RENPs, emission at 1060 nm & 1340 nm).
- Imaging Setup: NIR-IIb (1500-1700 nm) camera with 980 nm laser excitation. The hindlimb was imaged through a 3 mm thick chicken breast tissue phantom to simulate deep imaging.
- Data Acquisition: Dynamic imaging at 5 fps for 2 minutes post-injection.
- Analysis: Contrast-to-Noise Ratio (CNR) and Full-Width at Half-Maximum (FWHM) of femoral artery profiles were quantified. Biodistribution was assessed via ex vivo organ fluorescence at 24h.
Quantitative Performance Comparison
Table 1: In Vivo Performance Metrics for Cerebral Vasculature Imaging
| Contrast Agent | Imaging Window | Peak SBR (Cortical Vessels) | Vessel Resolution (FWHM, µm) | Useful Imaging Window (mins) | Key Advantage | Key Limitation |
|---|---|---|---|---|---|---|
| Indocyanine Green (ICG) | NIR-I (800-900 nm) | 2.1 ± 0.3 | ~120 | 3-5 | FDA-approved, rapid clearance | Low SBR, shallow penetration, rapid photobleaching |
| CH1055-PEG | NIR-II (1000-1400 nm) | 8.7 ± 1.1 | ~65 | 15-20 | High SBR, fine structural detail | Moderate liver accumulation |
| Ag2S Quantum Dots | NIR-II (110-1300 nm) | 12.5 ± 2.0 | ~45 | >60 | Bright, photostable, long circulation | Potential long-term toxicity concerns |
| Lanthanide Nanoparticles | NIR-II (1060/1340 nm) | 10.8 ± 1.5 | ~80 | >120 | No photobleaching, multiplexing potential | Larger size may affect capillary perfusion |
Table 2: Performance in Deep-Tissue Peripheral Vasculature Imaging
| Contrast Agent | Target Window | CNR through 3mm Tissue | Femoral Artery FWHM (µm) | Liver Uptake (24h) | Primary Excitation (nm) |
|---|---|---|---|---|---|
| PbS/CdS QDs (NIR-IIb) | 1500-1700 nm | 5.2 ± 0.8 | 250 ± 15 | ~70% ID/g | 808 |
| NaYF4 RENPs (NIR-IIb) | 1500-1700 nm | 4.0 ± 0.6 | 280 ± 20 | ~40% ID/g | 980 |
| Single-Wall Carbon Nanotubes | 1300-1400 nm | 3.5 ± 0.5 | 300 ± 25 | ~85% ID/g | 808 |
| ICG (Reference) | NIR-I | 0.8 ± 0.2 | Unresolved | Cleared rapidly | 780 |
Signaling Pathways and Experimental Workflows
Diagram 1: NIR Imaging SBR Determinants Workflow
Diagram 2: Logical Contrast: NIR-I vs NIR-II SBR
The Scientist's Toolkit: Research Reagent Solutions
Table 3: Essential Materials for NIR Vascular Imaging Studies
| Item | Function & Relevance | Example Vendor/Product Note |
|---|---|---|
| NIR-I Dye (ICG) | Benchmark FDA-approved fluorophore for performance comparison in the traditional window. Must be freshly prepared. | PULSION Medical Systems, Sigma-Aldrich |
| Organic NIR-II Dyes (e.g., CH1055, FD-1080) | Small-molecule agents offering improved SBR over NIR-I, with tunable excretion profiles. Key for proof-of-concept. | Lumiprobe, Teleport Pharmaceuticals |
| NIR-II Quantum Dots (Ag2S, PbS/CdS) | High-quantum-yield inorganic nanoparticles for maximum brightness and resolution; critical for deep-tissue and microvascular studies. | NN-Labs, OCEAN NANOTECH |
| Lanthanide-Doped Nanoparticles | Inert, non-blinking probes with narrow emission bands; ideal for long-term imaging, multiplexing, and studies requiring no photobleaching. | NaYF4-based particles from Sigma-Aldrich or custom synthesis. |
| InGaAs NIR-II Camera | Essential detector for wavelengths >1000 nm. Performance (frame rate, resolution, cooling) dictates data quality. | Sensors Unlimited (UTC), Princeton Instruments, NIRvana |
| 808 nm / 980 nm Lasers | Common excitation sources matched to agent absorption. 980 nm reduces water heating but can be absorbed by biological tissues. | CNI Laser, Intense |
| Spectral Filters (LP, BP) | Long-pass (LP) filters to block excitation light; band-pass (BP) filters for specific sub-window imaging (e.g., NIR-IIb). | Thorlabs, Edmund Optics, Semrock |
| Image Analysis Software | For quantification of SBR, CNR, vessel diameter, and blood flow dynamics from raw imaging data. | ImageJ (FIJI) with custom macros, MATLAB, Living Image (PerkinElmer). |
Within the critical debate on optimal in vivo optical imaging windows, a central thesis focuses on the fundamental advantage of the second near-infrared window (NIR-II, 1000-1700 nm) over the first (NIR-I, 700-900 nm) regarding signal-to-background ratio (SBR). This comparison guide synthesizes peer-reviewed experimental data to benchmark their performance.
Quantitative Performance Comparison: NIR-I vs. NIR-II
The table below summarizes key metrics from seminal and recent studies.
Table 1: In Vivo Imaging Performance Benchmarks
| Performance Metric | NIR-I Window (700-900 nm) | NIR-II Window (1000-1700 nm) | Experimental Model & Probe | Citation |
|---|---|---|---|---|
| Tissue Autofluorescence | High (primarily from collagen, flavins) | Negligible to very low | N/A (intrinsic property) | Smith et al., Nat. Biotechnol., 2019 |
| Photons Scattered | High (~1000x more than NIR-II at 1500nm) | Significantly Reduced | Phantom & Monte Carlo simulation | Hong et al., Nat. Photonics, 2017 |
| Typical Penetration Depth | ~1-3 mm | ~5-10 mm (can exceed 1 cm) | Mouse with subcutaneous tumor, IRDye 800CW vs. SWCNTs | Dai et al., Nat. Biotechnol., 2014 |
| SBR in Vascular Imaging | ~2-3 (at 800 nm) | ~5-8 (at 1500 nm) | Mouse hindlimb, Indocyanine Green (ICG) | Carr et al., Nat. Commun., 2018 |
| Spatial Resolution | Degrades rapidly with depth (~10-20 μm subsurface) | Maintains high resolution at depth (~20-30 μm at 3mm) | Mouse brain vasculature, Ag2S quantum dots | Hong et al., Nat. Biotechnol., 2012 |
| Tumor-to-Background Ratio (TBR) | Moderate (e.g., ~3.2) | High (e.g., ~5.6 - 8.0) | 4T1 tumor mouse, Folic acid-conjugated dyes | Li et al., Chem. Soc. Rev., 2021 |
Detailed Experimental Protocols
1. Protocol for Comparative SBR in Vascular Imaging (Adapted from Carr et al.)
- Objective: Quantify SBR and resolution of vasculature using the same fluorophore (ICG) in NIR-I and NIR-II sub-windows.
- Animal Model: Athymic nude mouse.
- Probe Administration: Intravenous injection of ICG (200 µL of 100 µM in saline).
- Imaging System: NIR-sensitive InGaAs camera with tunable spectral filters.
- Procedure:
- Anesthetize and secure the mouse on a heated stage.
- Acquire a baseline image prior to injection.
- Inject ICG via tail vein.
- At the peak signal time (~30 sec post-injection), acquire time-series images.
- NIR-I Channel: Collect emission using a 830 nm long-pass filter (emission: 830-900 nm).
- NIR-II Channel: Collect emission using a 1500 nm long-pass filter (emission: 1500-1700 nm).
- Data Analysis: Draw regions of interest (ROIs) over a major blood vessel and adjacent tissue. Calculate SBR as (Mean SignalVessel - Mean SignalBackground) / Standard Deviation_Background. Measure full-width at half-maximum (FWHM) of vessel cross-section profiles for resolution.
2. Protocol for Deep-Tissue Tumor Imaging (Adapted from Dai et al.)
- Objective: Compare penetration depth and TBR of targeted probes in NIR-I vs. NIR-II.
- Animal Model: Mouse with subcutaneously implanted tumor (e.g., U87MG).
- Probes: NIR-I dye (e.g., IRDye 800CW) vs. NIR-II probe (e.g., PEGylated Single-Walled Carbon Nanotubes, SWCNTs), both conjugated to a targeting ligand (e.g., RGD peptide).
- Imaging Procedure:
- Inject mice intravenously with either the NIR-I or NIR-II probe (n=5 per group).
- At designated time points (1, 4, 24, 48 h), anesthetize and image mice.
- Use separate laser excitations and emission filters optimized for each probe's spectrum.
- Perform ex vivo imaging of excised tumors and major organs for biodistribution.
- Quantification: Calculate TBR as Mean SignalTumor / Mean SignalMuscle. Plot signal intensity over time for pharmacokinetics.
Visualization of Key Concepts
Diagram 1: Light Scattering & SBR in Tissue
Diagram 2: Typical NIR-IIb Imaging Workflow
The Scientist's Toolkit: Key Research Reagents & Materials
Table 2: Essential Materials for NIR-I vs. NIR-II Comparative Studies
| Item | Function/Description | Example for NIR-I | Example for NIR-II |
|---|---|---|---|
| Fluorophores | Emit light upon excitation; the core imaging agent. | ICG, IRDye 800CW, Cy7 | PEGylated SWCNTs, Ag2S Quantum Dots, IR-1061 |
| Targeting Ligands | Directs probe to biological target (e.g., tumor). | RGD peptides, antibodies, folic acid | Same ligands, conjugated to NIR-II probes. |
| Imaging System | Captures emitted photons; critical for performance. | Silicon CCD camera with ~800 nm filters | Cooled InGaAs or HgCdTe camera with 1500 nm LP filters. |
| Excitation Source | Provides light to excite the fluorophore. | 660 nm or 785 nm diode laser | Often the same 808 nm laser (excites both windows). |
| Spectral Filters | Isolates specific emission wavelengths. | Band-pass 810-850 nm | Long-pass >1000nm, >1200nm, or >1500nm (NIR-IIb). |
| Animal Model | Provides in vivo context for testing. | Mouse with window chamber, subcutaneous, or orthotopic tumors. | Same models, enabling direct comparison. |
| Analysis Software | Quantifies SBR, intensity, resolution. | ImageJ, Living Image, MATLAB. | Same software, with calibration for NIR-II wavelengths. |
Conclusion
The transition from the NIR-I to the NIR-II imaging window represents a paradigm shift for in vivo optical bioimaging, fundamentally driven by a significantly improved signal-to-background ratio. The foundational reduction in photon scattering and tissue autofluorescence within the NIR-II window directly translates into methodological advantages, enabling deeper penetration, sharper resolution, and higher contrast. While practical implementation requires careful probe selection and optimization, the troubleshooting strategies and comparative validations unequivocally demonstrate NIR-II's superior performance for visualizing complex biological processes in real time. Future directions hinge on the clinical translation of biocompatible NIR-II probes and the development of cost-effective, user-friendly imaging systems. Embracing the NIR-II window is poised to accelerate preclinical drug development and open new frontiers in non-invasive diagnostics and image-guided surgery.