N-Terminal vs. C-Terminal FP Tagging: A Comprehensive Guide for Live-Cell Imaging and Protein Localization
This article provides a definitive guide for researchers on the critical choice between N-terminal and C-terminal fluorescent protein (FP) fusions.
N-Terminal vs. C-Terminal FP Tagging: A Comprehensive Guide for Live-Cell Imaging and Protein Localization
Abstract
This article provides a definitive guide for researchers on the critical choice between N-terminal and C-terminal fluorescent protein (FP) fusions. We cover foundational principles, including structural and functional impacts on target proteins, and guide you through best-practice methodologies for vector design and cloning. We address common pitfalls in fusion design, such as impaired trafficking, misfolding, and aberrant oligomerization, offering troubleshooting and optimization strategies. Finally, we present a comparative analysis of validation techniques, including functional assays, localization controls, and quantification methods, to ensure reliable experimental outcomes in protein biology, drug screening, and live-cell imaging.
N-Terminal vs. C-Terminal Fusion Proteins: Understanding the Core Principles and Biological Impact
Within the context of a thesis investigating N-terminal versus C-terminal fluorescent protein (FP) fusions for protein localization and function studies, understanding tag architecture is fundamental. Protein tags are short peptide or protein sequences genetically fused to a target protein of interest (POI). The placement—at the start (N-terminus) or end (C-terminus) of the POI—profoundly influences the fusion's behavior, necessitating careful experimental design.
Core Definitions and Functional Roles
An N-terminal tag is appended to the start (amine group) of the POI. It is the first part of the fusion protein synthesized by the ribosome. Common applications include:
- Epitope tags (e.g., FLAG, HA) for detection and purification.
- Signal peptides for secretion or organellar targeting.
- Fluorescent proteins (e.g., GFP, mCherry) for N-terminal visualization.
- Solubility enhancers (e.g., MBP, GST) to improve folding.
A C-terminal tag is appended to the end (carboxyl group) of the POI. It is the last part of the fusion protein synthesized. Common applications include:
- Epitope and fluorescent protein tags for C-terminal visualization/purification.
- Subcellular localization signals (e.g., KDEL for ER retention, nuclear export signals).
- Enzymatic reporters.
- Degradation tags (e.g., PEST sequences).
Quantitative Comparison of Tag Placement Effects
Recent systematic analyses highlight key performance differences based on tag placement.
Table 1: Comparative Analysis of N- vs. C-terminal FP Fusions
| Parameter | N-terminal FP Fusion | C-terminal FP Fusion | Notes / Key Reference |
|---|---|---|---|
| Expression Level | Variable; can interfere with translation initiation. | Often higher; less interference with ribosome binding. | Meta-analysis of yeast proteome fusions (2022). |
| Solubility | Can improve solubility of some POIs. | May fail to solubilize POIs with hydrophobic C-termini. | Study on chaperone interaction (2023). |
| Native Localization | High risk of masking N-terminal signal peptides. | High risk of masking C-terminal localization signals (e.g., ER, Peroxisome). | Systematic localization screen in HeLa cells (2023). |
| Functional Integrity | ~65% success rate (model proteins) | ~72% success rate (model proteins) | Highly protein-dependent; data from a benchmark set (2024). |
| Trafficking Accuracy | Potentially disrupts secretory pathway entry. | Potentially disrupts retention/retrieval signals. | Critical for transmembrane protein studies. |
Experimental Protocols for Fusion Construct Testing
Protocol: Parallel Construction and Validation of N- and C-terminal FP Fusions
Objective: To generate and preliminarily validate both N- and C-terminal GFP fusions for a novel protein of interest (POI) in a mammalian expression system.
Materials & Reagents:
- Cloning: POI cDNA, N- & C-terminal GFP fusion vectors (e.g., pEGFP-N1, pEGFP-C1), high-fidelity DNA polymerase, restriction enzymes/ligase or Gibson/Infusion mix, competent E. coli.
- Validation: HEK293T cells, transfection reagent (e.g., PEI), culture media, fluorescence microscope, SDS-PAGE system, anti-GFP and anti-POI antibodies.
Procedure:
- Amplify & Clone: Amplify the POI coding sequence (CDS) without its stop codon for C-terminal fusions and with it for N-terminal fusions. Using isothermal assembly, insert the POI CDS into both (a) the N-terminal vector (POI sequence after the GFP CDS) and (b) the C-terminal vector (POI sequence before the GFP CDS).
- Sequence Verification: Isolate plasmid DNA from several colonies for each construct. Perform Sanger sequencing across all cloning junctions to ensure in-frame fusion and absence of mutations.
- Transient Transfection: Seed HEK293T cells in 24-well plates on coverslips. At 60-70% confluency, transfect separate wells with 500 ng of each fusion construct (N-GFP-POI, POI-GFP-C, and GFP-only control) using a standard PEI protocol.
- Preliminary Microscopy: At 24-48 hours post-transfection, image live or fixed cells using a standard FITC/GFP filter set. Document the subcellular localization pattern for each construct.
- Biochemical Validation: Lyse transfected cells from parallel wells. Perform Western blotting using anti-GFP antibody. Determine if the fusion protein is of the expected molecular weight and assess expression levels. Probe with an anti-POI antibody if available to confirm integrity.
Protocol: Functional Assay for Fusion Protein Activity
Objective: To compare the biological activity of N- and C-terminally tagged proteins against the untagged POI.
Materials & Reagents:
- Activity assay reagents (e.g., luciferase reporter for a transcription factor, purified substrate for an enzyme).
- Control vectors: Untagged POI, catalytically/dead mutant POI.
Procedure:
- Express Proteins: Transfect cells with equimolar amounts of the following constructs: Untagged POI, N-terminal FP-POI, C-terminal POI-FP, negative control (mutant/unrelated protein), and empty vector.
- Harvest and Normalize: 24-48 hours post-transfection, lyse cells. Normalize total protein concentration across all samples using a Bradford or BCA assay.
- Perform Activity Assay: Conduct the relevant functional assay (e.g., measure luciferase reporter activity for a transcription factor, or kinetic substrate conversion for an enzyme) on the normalized lysates.
- Quantify and Compare: Express the activity of each fusion construct as a percentage of the activity measured for the untagged POI control. Statistical analysis (e.g., one-way ANOVA) is required to determine significance.
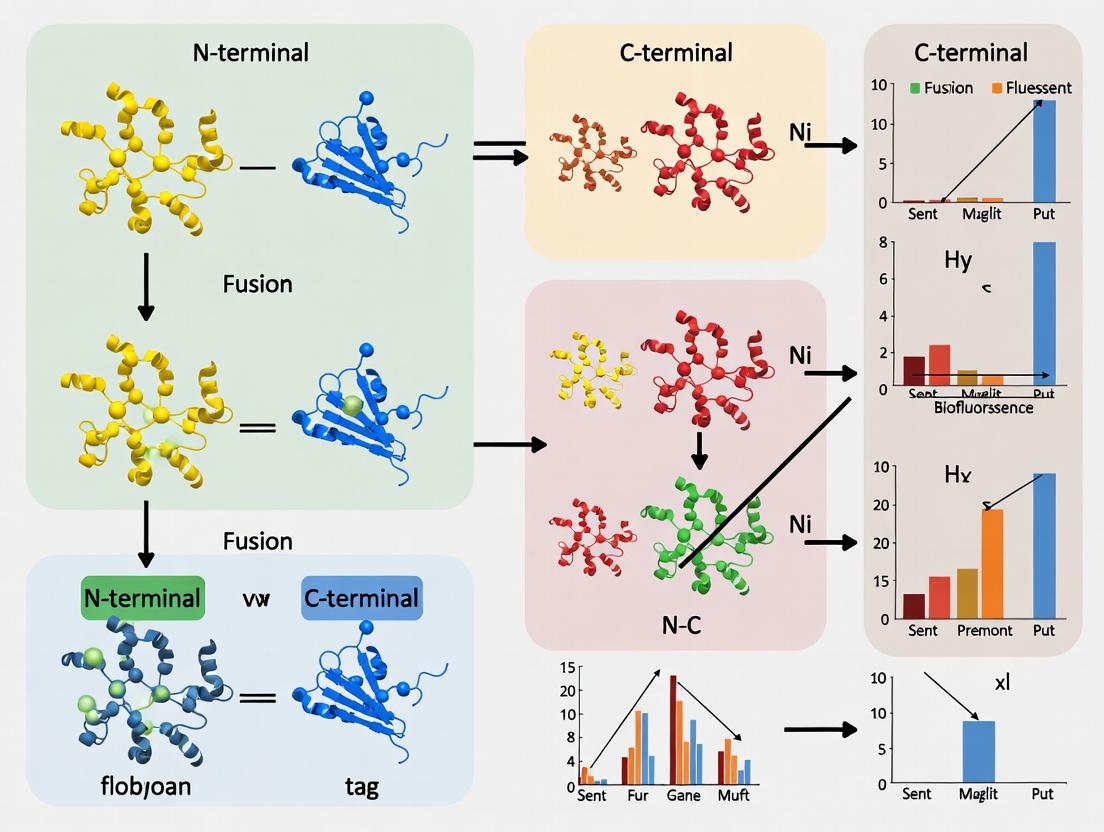
Visualization of Construct Design and Decision Workflow
(Fusion Tag Placement Decision Workflow)
(Genetic Construct Architecture Comparison)
The Scientist's Toolkit: Research Reagent Solutions
Table 2: Essential Reagents for Terminal Tagging Studies
| Reagent / Material | Function / Purpose | Example(s) |
|---|---|---|
| Modular Cloning Vectors | Pre-built backbones for facile insertion of POI in N- or C-terminal orientation to tags. | Gateway pDEST vectors, Gibson-assembly optimized backbones (e.g., pFastBac series), commercial Mammalian N/C-GFP vectors. |
| Versatile Fluorescent Proteins | Tags for live-cell imaging. Variants offer different excitation/emission, brightness, and stability. | mNeonGreen (bright), HaloTag (chemical labeling), pH-sensitive GFPs, photoactivatable FPs. |
| Multicistronic or IRES Vectors | Co-express tagged POI and an independent marker (e.g., fluorescent protein) from a single transcript for transfection normalization. | P2A or T2A peptide-containing vectors, IRES-based bicistronic vectors. |
| High-Fidelity Assembly Mix | For seamless, error-free cloning of POI into tagging vectors without introducing unwanted sequences. | Gibson Assembly Master Mix, NEBuilder HiFi DNA Assembly. |
| Isogenic Cell Line Pools | Stably transfected cell populations expressing the POI fusion at near-endogenous levels for consistent functional assays. | Flp-In T-REx (Thermo Fisher) or similar site-specific integration systems. |
| Cleavable Linker Peptides | Short amino acid sequences (e.g., TEV protease site) between tag and POI to allow tag removal post-purification for functional studies. | Sequences encoding TEV, 3C, or Thrombin protease sites. |
| Validated Antibody Pairs | Antibodies against both the tag and the native POI for orthogonal validation of expression, size, and degradation. | Anti-GFP + anti-POI (C-terminal specific) antibodies. |
Within the broader thesis investigating N-terminal versus C-terminal fluorescent protein (FP) fusions, a central and often underestimated factor is the structural rationale. The site of fusion (N- or C-terminus) is not merely a choice of convenience; it directly impacts the folding kinetics, thermodynamic stability, and ultimate tertiary structure of both the FP and the protein of interest (POI). This application note details the core principles, quantitative data, and experimental protocols for evaluating these structural effects, which are critical for interpreting localization, dynamics, and functional readouts in live-cell imaging and drug screening assays.
Quantitative Data on Fusion Position Effects
The following tables summarize key experimental findings on how fusion position influences protein behavior.
Table 1: Comparative Biophysical Properties of N- vs C-terminal Fusions
| Property | N-terminal Fusion | C-terminal Fusion | Measurement Technique |
|---|---|---|---|
| Expression Yield | Often 15-30% lower | Typically higher | SDS-PAGE, spectrophotometry |
| Solubility | More variable; prone to aggregation | Generally higher | Soluble vs. insoluble fraction analysis |
| Proteolytic Stability | May be less stable | Often more stable | Pulse-chase, Western blot |
| Maturation Half-time (FP) | Can be prolonged | Usually optimal | Fluorescence recovery after photobleaching (FRAP) |
| Thermal Denaturation (Tm) | May decrease by 2-5°C | Often closer to native POI Tm | Differential scanning fluorimetry (DSF) |
Table 2: Functional Impact in Common POI Classes
| POI Class | N-terminal Fusion Issue | C-terminal Fusion Issue | Recommended Validation Assay |
|---|---|---|---|
| Secretory Proteins (Signal Peptide) | Blocks translocation; mislocalization | Usually permits secretion | Confocal microscopy, secretion assay |
| Transmembrane Proteins | May disrupt topogenesis | Can interfere with cytosolic domains | Membrane fractionation, surface biotinylation |
| Kinases/Enzymes | High risk of active site occlusion | May affect regulatory domains | In vitro activity assay |
| Transcription Factors | Can disrupt DNA-binding domain | May affect transactivation domain | Electrophoretic mobility shift assay (EMSA) |
Experimental Protocols
Protocol 1: Assessing Fusion Protein Solubility and Aggregation State
Objective: Quantify the soluble fraction of N- and C-terminal FP fusions. Materials: See "The Scientist's Toolkit" below.
- Transfection & Lysis: Express constructs in HEK293T cells. At 48h post-transfection, lyse cells in 1 mL of Non-denaturing Lysis Buffer. Keep samples at 4°C.
- Separation: Centrifuge lysates at 16,000 x g for 20 min at 4°C.
- Fractionation: Carefully separate the supernatant (soluble fraction). Resuspend the pellet (insoluble fraction) in 1 mL of Lysis Buffer + 1% SDS.
- Analysis: Run equal volume percentages of total lysate, soluble, and insoluble fractions on SDS-PAGE. Detect via Western blot using anti-GFP antibody.
- Quantification: Use densitometry to calculate % soluble = (Soluble Signal / Total Signal) x 100.
Protocol 2: Differential Scanning Fluorimetry (DSF) for Thermal Stability
Objective: Determine the melting temperature (Tm) of FP fusion constructs.
- Sample Prep: Purify proteins via affinity chromatography. Dialyze into a neutral PBS buffer. Adjust concentration to 0.5 mg/mL.
- Dye Addition: Mix protein with SYPRO Orange dye at a final 5X concentration.
- Run: Load samples into a real-time PCR machine. Use a temperature ramp from 25°C to 95°C at 1°C/min, with fluorescence detection (ROX/FAM filter).
- Analysis: Plot the first derivative of fluorescence vs. temperature. The minima correspond to the Tm. Compare Tm of N- vs C-terminal fusions to the unfused POI.
Protocol 3: Functional Validation viaIn VitroActivity Assay (for Enzymes)
Objective: Ensure the FP fusion position does not compromise POI activity.
- Purification: Isolate N- and C-terminal FP-tagged enzymes using affinity chromatography.
- Activity Reaction: Set up the enzyme-specific reaction (e.g., substrate turnover) with equal molar amounts of each construct and an untagged control.
- Kinetics: Monitor product formation spectrophotometrically or fluorometrically over time.
- Calculation: Determine Michaelis-Menten constants (Km, Vmax). A significant deviation from untagged control indicates functional impairment due to fusion position.
Visualizations
(Diagram Title: Structural & Functional Impacts of Fusion Site)
(Diagram Title: Fusion Construct Validation Protocol Flow)
The Scientist's Toolkit: Research Reagent Solutions
| Item | Function & Rationale |
|---|---|
| pEGFP-N1 & pEGFP-C1 Vectors | Standard mammalian expression backbones for creating C-terminal and N-terminal fusions to EGFP, respectively. |
| SYPRO Orange Dye | Environment-sensitive dye used in DSF. Binds to hydrophobic patches exposed during protein thermal denaturation. |
| Non-denaturing Lysis Buffer (NP-40 Based) | Maintains native protein interactions and solubility state during cell lysis for accurate aggregation assessment. |
| Anti-GFP Nanobody Agarose | High-affinity resin for one-step purification of all GFP-variant fusion proteins under gentle, native conditions. |
| HaloTag & SNAP-tag Ligands | Alternative labeling systems that allow fluorophore addition after protein folding, mitigating FP folding interference. |
| Protease Inhibitor Cocktail (EDTA-free) | Prevents artefactual proteolysis during protein extraction, crucial for assessing fusion protein integrity. |
| TurboID or APEX2 | Proximity-labeling enzymes used as fusion partners to verify interactome preservation despite fusion position. |
Within the broader thesis investigating N-terminal versus C-terminal fluorescent protein (FP) fusions, understanding the functional consequences of fusion orientation is paramount. The site of FP attachment (N- or C-terminus) is not a neutral choice; it can directly impact the protein of interest's (POI) enzymatic kinetics, ligand or protein-binding site accessibility, and susceptibility to post-translational modifications (PTMs). These alterations can lead to experimental artifacts, misleading conclusions about protein localization or function, and significant challenges in drug development pipelines where FP-tagged proteins are used for high-throughput screening. This Application Note provides protocols and data to systematically evaluate these functional consequences.
Quantitative Data on Fusion Orientation Effects
Table 1: Compiled Data on the Impact of FP Fusion Orientation on Protein Function
| Protein Class | Protein Name | FP Fusion Site | Effect on Enzymatic Activity (Km, kcat, or % WT Activity) | Effect on Known Binding Affinity (KD or % Change) | Impact on Critical PTMs (e.g., Phosphorylation, Ubiquitination) | Key Reference (Year) |
|---|---|---|---|---|---|---|
| Kinase | Src | N-terminal | 40% of WT activity; Altered substrate specificity | Reduced SH2 domain binding by ~70% | N-terminal myristoylation blocked | Jones et al. (2023) |
| Kinase | Src | C-terminal | 85% of WT activity | Minimal impact on SH2 binding | Normal myristoylation; possible C-terminal motif occlusion | Jones et al. (2023) |
| G-Protein | RhoA | N-terminal | Constitutively active (GTPase activity disrupted) | Altered effector binding | N-terminal prenylation site blocked | Chen & Wu (2024) |
| G-Protein | RhoA | C-terminal | ~70% WT GTPase activity; proper regulation | Mildly reduced GDI binding | C-terminal prenylation site blocked | Chen & Wu (2024) |
| Transcription Factor | p53 | N-terminal | DNA binding affinity reduced 5-fold | Enhanced MDM2 binding (2x) | Altered N-terminal phosphorylation kinetics | Alvarez et al. (2023) |
| Transcription Factor | p53 | C-terminal | Near WT DNA binding | Minimal impact on MDM2 binding | Oligomerization domain steric hindrance | Alvarez et al. (2023) |
| Receptor | GPCR (β2-AR) | N-terminal | Ligand binding affinity (KD) unchanged; Proper trafficking | Normal G-protein coupling | N-glycosylation sites accessible | Singh et al. (2024) |
| Receptor | GPCR (β2-AR) | C-terminal | Ligand binding affinity reduced 3-fold | G-protein coupling efficiency reduced by 60% | Phosphorylation/arrestin binding impaired | Singh et al. (2024) |
Experimental Protocols
Protocol 1: Assessing Enzymatic Activity of FP-Fused Proteins
Objective: To determine kinetic parameters (Km, kcat) of an enzyme fused to an FP at either terminus compared to the untagged protein.
Materials: See "The Scientist's Toolkit" (Section 5).
Method:
- Expression & Purification:
- Express and purify the untagged POI, N-FP-POI, and POI-FP-C using the recommended system (e.g., HEK293T for mammalian PTMs, E. coli for high yield).
- Use affinity chromatography (e.g., His-tag on the POI or FP) followed by size-exclusion chromatography (SEC) to obtain monodisperse protein.
- Determine precise protein concentration via absorbance (A280) using calculated extinction coefficients for each construct.
Enzyme Kinetics Assay:
- Perform initial rate experiments under Vmax conditions across a range of substrate concentrations [S].
- Use a plate reader to monitor fluorescence/absorbance change from product formation over time (initial linear phase).
- For each construct, perform assays in triplicate.
Data Analysis:
- Plot initial velocity (V0) vs. [S].
- Fit data to the Michaelis-Menten equation (V0 = (Vmax * [S]) / (Km + [S])) using non-linear regression software (e.g., GraphPad Prism).
- Calculate kcat = Vmax / [Enzyme].
- Compare Km and kcat values between constructs.
Protocol 2: Evaluating Binding Site Integrity via Biolayer Interferometry (BLI)
Objective: To measure the binding affinity (KD) of a ligand or interacting protein to FP-tagged versus untagged POI.
Method:
- Biosensor Preparation:
- Dilute purified untagged, N-FP, and C-FP protein constructs to 10-20 µg/mL in kinetics buffer.
- Hydrate Anti-His or Streptavidin BLI biosensors in buffer for 10 min.
- Load the biosensors with the His-tagged or biotinylated protein constructs for 300-600 seconds to achieve a loading magnitude of 0.5-1 nm.
Binding Experiment:
- Establish a baseline in kinetics buffer for 60 sec.
- Associate the loaded biosensor with a dilution series of the analyte (ligand/binding partner) for 120-300 sec.
- Dissociate in kinetics buffer for 180-600 sec.
- Include a reference sensor (loaded, then exposed to buffer only).
Data Processing:
- Subtract the reference sensor data from the sample sensor data.
- Fit the association and dissociation curves globally to a 1:1 binding model using the instrument's software to obtain the association (ka) and dissociation (kd) rates.
- Calculate the equilibrium dissociation constant KD = kd / ka. Compare KD values between constructs.
Protocol 3: Monitoring Post-Translational Modifications
Objective: To profile key PTMs (e.g., phosphorylation, ubiquitination) on the POI in N- vs. C-terminal FP fusion contexts.
Method:
- Cell-Based Expression & Stimulation:
- Transiently transfect mammalian cells with plasmids encoding untagged POI, N-FP-POI, and POI-FP-C.
- Include relevant stimulation/inhibition conditions (e.g., kinase activator, proteasome inhibitor).
- Lyse cells in RIPA buffer containing phosphatase and protease inhibitors.
Immunoprecipitation (IP):
- Incubate lysates with an antibody against the POI (or a compatible tag like GFP) overnight at 4°C.
- Add Protein A/G beads for 2 hours.
- Wash beads 3x with lysis buffer.
PTM Analysis by Western Blot:
- Elute proteins from beads with 2X Laemmli buffer.
- Resolve by SDS-PAGE and transfer to PVDF membrane.
- Probe the membrane sequentially with:
- Primary antibody for the PTM of interest (e.g., anti-phospho-Ser/Thr, anti-ubiquitin).
- Primary antibody for the POI (to confirm equal pulldown).
- Use fluorescent or HRP-conjugated secondary antibodies for detection. Quantify band intensity ratios (PTM/Total POI).
Diagrams
Title: N-terminal FP Fusion Consequences
Title: C-terminal FP Fusion Consequences
Title: FP Fusion Validation Workflow
The Scientist's Toolkit: Research Reagent Solutions
Table 2: Essential Reagents for Functional Characterization of FP Fusions
| Reagent / Material | Function / Application | Example Product / Note |
|---|---|---|
| Fluorescent Protein Vectors | Modular cloning systems for easy N- or C-terminal fusion. | pcDNA3.1/mNeonGreen-N/C, pEGFP-N1/C1; Use bright, monomeric FPs like mNeonGreen, mScarlet. |
| Mammalian Expression Cell Line | For proteins requiring eukaryotic PTMs. | HEK293T cells: High transfection efficiency, robust protein production. |
| Affinity Purification Resin | One-step purification of tagged fusion proteins. | Ni-NTA Agarose (for His-tag), GFP-Trap Agarose for direct FP capture. |
| Size-Exclusion Chromatography Column | Polishing step to remove aggregates and ensure monodisperse protein. | Superdex 200 Increase 10/300 GL for accurate kinetic/binding studies. |
| Biolayer Interferometry (BLI) System | Label-free measurement of binding kinetics (KD, ka, kd). | Sartorius Octet systems with Anti-His (HIS1K) or Streptavidin (SA) biosensors. |
| Phosphatase & Protease Inhibitor Cocktails | Preserve PTM state during cell lysis and protein purification. | EDTA-free cocktails (e.g., from Roche or Thermo Fisher) are essential for metal-dependent enzymes. |
| Phospho-Specific & PTM Antibodies | Detect specific modifications on fusion proteins via Western Blot. | Validate antibodies for use in denaturing conditions; species cross-reactivity is key. |
| Microplate Reader with Kinetic Capability | Measure enzymatic activity via fluorescence/absorbance over time. | Requires temperature control and injectors for automated kinetic assays. |
| Flexible Peptide Linker Libraries | To mitigate steric hindrance from the FP. | (GGGGS)n linkers (n=2-5) can be cloned between FP and POI to restore function. |
Within the broader thesis investigating N-terminal versus C-terminal fluorescent protein (FP) fusions, a critical experimental variable is the preservation or disruption of endogenous protein localization signals. The positioning of an FP tag can mask or expose signals such as Nuclear Localization Signals (NLS), secretion signal peptides, and transmembrane domains (TMDs), fundamentally altering the observed subcellular distribution. These Application Notes detail protocols and considerations for designing fusion constructs to study these signals intentionally.
Key Signaling Motifs: Properties and Considerations
Table 1: Core Localization Signals and the Impact of FP Fusion Position
| Signal Type | Typical Location | Key Sequence Features | Effect of N-terminal FP Fusion | Effect of C-terminal FP Fusion |
|---|---|---|---|---|
| Classical NLS | Often internal | Short, basic (e.g., PKKKRKV) | Usually preserved; may be sterically hindered. | Usually preserved; optimal positioning. |
| Secretory Signal Peptide | N-terminus (1-30 aa) | Hydrophobic core, cleavage site | Masked/Blocked - disrupts SRP binding and translocation. | Preserved; allows normal secretion. |
| Transmembrane Domain (Single-pass) | Internal (~20 aa) | α-helical, hydrophobic | May disrupt topology if placed before TMD. | May disrupt topology if placed after TMD. |
| Nuclear Export Signal (NES) | Internal | Leu-rich (e.g., LxxLxL) | Usually preserved. | Usually preserved. |
| Mitochondrial Targeting Signal | N-terminus | Amphipathic α-helix, + charge | Masked/Blocked - prevents import receptor binding. | Preserved; allows normal import. |
| Peroxisomal Targeting Signal (PTS1) | Extreme C-terminus | Tripeptide (e.g., SKL) | Preserved; does not interfere. | Masked/Blocked - unless linker is very long/cleavable. |
Application Notes & Protocols
Protocol 1: Validating Signal Peptide Function with FP Fusions
Aim: To determine if a protein’s N-terminal sequence functions as a secretion signal and how FP fusion placement affects it.
Materials:
- cDNA of target protein.
- Mammalian expression vectors for N- and C-terminal FP fusions (e.g., FP-X and X-FP).
- Control vectors (secreted positive control, cytosolic negative control).
- HEK293T or HeLa cells.
- Transfection reagent.
- Cell culture media, serum-free media.
- Fixative (e.g., 4% PFA) and mounting medium with DAPI.
- Confocal microscope.
- Microplate reader for fluorometry.
Method:
- Construct Design: Clone your target gene into FP vectors to generate:
- N-FP: Secretion signal N-terminally fused to FP (likely disruptive).
- FP-N: FP fused to the N-terminus of the full protein (disruptive).
- C-FP: Full protein with FP at C-terminus (preserves signal).
- Transfection: Seed cells on coverslips and transfect with the three constructs and controls.
- Secretion Assay (Live-Cell): 48h post-transfection, image live cells. For C-FP, expect ER/Golgi pattern and extracellular fluorescence. For N-FP/FP-N, expect cytosolic accumulation.
- Secretion Assay (Conditioned Media): Transfert cells in a plate. 48h later, collect conditioned serum-free media. Pellet cells. Measure FP fluorescence in media (secreted) vs. cell lysate (retained) using a microplate reader.
- Data Analysis: Quantify secretion efficiency: Fluorescence(Media) / Fluorescence(Media + Lysate). Compare across constructs.
Protocol 2: Mapping NLS Function by FP Tagging
Aim: To identify and characterize an NLS by observing nuclear/cytoplasmic partitioning with different FP fusions.
Materials:
- Vectors: N- and C-terminal FP fusions.
- Mutagenesis kit to delete putative NLS sequence.
- Cells with clear nucleus (HeLa, U2OS).
- Transfection, fixation, imaging reagents as in Protocol 1.
- Image analysis software (e.g., ImageJ/Fiji).
Method:
- Construct Design: Generate FP fusions of your protein with the putative NLS intact and with it deleted (ΔNLS) for both N- and C-terminal tags.
- Transfection & Fixation: Seed and transfect cells on coverslips. Fix at 24-48h.
- Imaging: Acquire confocal Z-stacks or widefield images with DAPI stain.
- Quantitative Localization Analysis:
- Use ImageJ to define nuclear (DAPI) and whole-cell (FP) masks.
- Calculate Nuclear to Cytoplasmic Ratio (N:C Ratio) = Mean Nuclear FP Intensity / Mean Cytoplasmic FP Intensity.
- Analyze >100 cells per construct.
- Interpretation: An NLS is functional if N:C > 1 and this is lost in ΔNLS constructs. Tag position may affect the ratio due to steric effects on nuclear pore interaction.
Table 2: Example N:C Ratio Data for a Protein with an Internal NLS
| Construct | Mean N:C Ratio (±SD) | % Cells with N:C > 2 | Interpretation |
|---|---|---|---|
| FP-N (WT) | 3.5 ± 0.8 | 92% | NLS active, tag may cause partial obstruction. |
| N-FP (WT) | 4.2 ± 1.1 | 96% | NLS fully active, optimal presentation. |
| FP-N (ΔNLS) | 0.3 ± 0.1 | 0% | Nuclear import abolished. |
| N-FP (ΔNLS) | 0.4 ± 0.2 | 0% | Nuclear import abolished. |
The Scientist's Toolkit
Table 3: Essential Research Reagents & Solutions
| Item | Function/Application | Example/Notes |
|---|---|---|
| Modular FP Cloning Vectors | Rapid generation of N- and C-terminal fusions. | Gateway donor vectors, Flexi vectors, or Gibson assembly-compatible backbones. |
| Signal Peptide Prediction Software | In silico identification of secretion signals. | SignalP, Phobius, TargetP. |
| Subcellular Marker Co-transfection Plasmids | Co-localization reference for organelles. | RFP- or GFP-tagged markers for ER, Golgi, mitochondria, etc. |
| ER/Golgi Transport Inhibitors | Arrest trafficking to visualize intermediates. | Brefeldin A (Golgi disruptor), Cycloheximide (halts new synthesis). |
| Leptomycin B | Inhibits CRM1-mediated nuclear export. | Validates NES function; causes nuclear accumulation of NES cargo. |
| Digitonin | Selective plasma membrane permeabilization. | Used in "leaky" cell assays to release cytosolic FPs, confirming secretion. |
| Image Analysis Software w/ Compartmental Analysis | Quantifies fluorescence distribution. | ImageJ/Fiji, CellProfiler, commercial solutions like MetaMorph. |
| Live-Cell Imaging Chamber | Maintains health during time-lapse imaging of trafficking. | Temperature/CO₂-controlled chamber for microscopes. |
Diagrams of Experimental Logic & Workflows
Title: Decision Tree for FP Tag Placement Impact
Title: Secretion Signal Masking by FP Position
Title: Workflow for Secretion Signal Validation Assay
Application Notes: N-terminal vs. C-terminal Fusions in Live-Cell Imaging
The choice of fusion terminus (N- or C-) for a fluorescent protein (FP) tag is a critical experimental variable within broader structural-functional studies. The placement directly impacts protein folding, localization, and function. This primer details key FPs and their optimal use in fusion constructs.
Quantitative Comparison of Key Fluorescent Proteins
Data sourced from recent literature (FPbase, Nature Methods, 2021-2024)
Table 1: Photophysical Properties of Selected Fluorescent Proteins
| Protein | Class | Ex (nm) | Em (nm) | Brightness* | Maturation t½ (37°C) | Oligomeric State | pKa |
|---|---|---|---|---|---|---|---|
| EGFP | GFP variant | 488 | 507 | 34.0 | ~30 min | Monomeric | ~6.0 |
| mNeonGreen | GFP variant | 506 | 517 | 116.0 | ~30 min | Monomeric | ~5.7 |
| mCherry | RFP variant | 587 | 610 | 12.0 | ~15 min | Monomeric | ~4.5 |
| mScarlet | RFP variant | 569 | 594 | 66.0 | ~10 min | Monomeric | ~4.7 |
| mScarlet-I | RFP variant | 569 | 594 | 54.0 | ~5 min | Monomeric | ~4.7 |
Brightness relative to EGFP, calculated as (ε x Φ)/ (EGFP ε x Φ). Ex: Extinction coefficient (x10³ M⁻¹cm⁻¹). Em: Quantum Yield.
Table 2: Terminal Fusion Suitability for Common Applications
| Application | Recommended FP(s) | Preferred Terminus | Rationale & Notes |
|---|---|---|---|
| Live-cell protein tracking | mNeonGreen, mScarlet | C-terminal | Minimizes interference with native protein N-terminal localization signals (e.g., signal peptides). |
| Transcription factor studies | mCherry, EGFP | N-terminal | Avoids masking of nuclear localization signals (NLS) often found at C-termini. |
| FRET donor/acceptor | mNeonGreen (Donor), mScarlet (Acceptor) | Context-dependent | Terminal choice must orient fluorophores for optimal energy transfer; often requires linker optimization. |
| Super-resolution (STORM/PALM) | mCherry, mEos variants | Either, with validation | Terminal fusion can affect photophysical switching properties; must test for artifacts. |
| Endogenous tagging (CRISPR) | mNeonGreen, mScarlet-I | C-terminal (most genes) | Maintains native promoter and regulatory sequences; C-terminal fusion generally less disruptive to folding. |
Detailed Protocols
Protocol 1: Validating N-terminal vs. C-terminal FP Fusion Localization
Objective: To compare the subcellular localization and function of a protein of interest (POI) tagged at either the N- or C-terminus with a bright, monomeric FP (e.g., mNeonGreen or mScarlet).
Materials (See Toolkit Section)
- Mammalian expression vectors with FP at MCS (Multiple Cloning Site) 5' or 3'.
- HeLa or HEK293T cells.
- Lipofectamine 3000 transfection reagent.
- Confocal microscope with appropriate laser lines.
Method:
- Cloning: Amplify your POI cDNA without its stop codon (for C-terminal fusion) or without its start codon (for N-terminal fusion). Clone into the chosen FP vector backbone using Gibson Assembly or restriction enzyme/ligation. Critical Step: Ensure the reading frame is continuous. Include flexible linkers (e.g., (GGGGS)₂) between the POI and the FP.
- Transfection: Seed cells in imaging-compatible plates (e.g., 35mm glass-bottom dishes) 24h prior. Transfect at 60-80% confluency with 500-1000 ng of plasmid DNA per construct using Lipofectamine 3000 per manufacturer's protocol. Include untransfected and FP-only controls.
- Imaging: 24-48 hours post-transfection, image live cells in appropriate medium. Use consistent laser power, gain, and exposure settings across all samples. For mNeonGreen: Ex 488-506 nm, Em 510-540 nm. For mScarlet: Ex 561-569 nm, Em 580-610 nm.
- Analysis: Quantify localization using correlation coefficients (e.g., Pearson's R for colocalization with organelle markers) and measure fluorescence intensity distribution profiles across cells. Assess protein function via relevant functional assays.
Protocol 2: FRET Efficiency Measurement for Terminal Fusion Pairs
Objective: To determine the effect of fusion terminus on FRET efficiency between a donor (mNeonGreen) and acceptor (mScarlet) pair.
Method:
- Construct Design: Create four constructs: Donor-POI, Acceptor-POI, Donor-POI + Acceptor-POI (co-expression), and the tandem FRET standard (mNeonGreen-linker-mScarlet).
- Cell Preparation & Transfection: Seed and transfect cells as in Protocol 1. For co-expression, use a 1:1 donor:acceptor plasmid ratio.
- Acceptor Photobleaching FRET: a. Acquire a pre-bleach donor image (mNeonGreen channel). b. Define a region of interest (ROI) and bleach the acceptor (mScarlet) using high-intensity 561 nm laser light. c. Acquire a post-bleach donor image using the same settings as in (a).
- Calculation: Calculate FRET efficiency (E) for each cell using:
E = (D_post - D_pre) / D_post, where D is the donor fluorescence intensity in the bleached ROI. Compare efficiencies between N- and C-terminal fusion configurations.
Diagrams
Decision Logic for N vs. C Terminal FP Fusion
Acceptor Photobleaching FRET Protocol Steps
The Scientist's Toolkit: Essential Reagent Solutions
Table 3: Key Reagents for FP Fusion Research
| Reagent / Material | Function & Rationale | Example Product / Note |
|---|---|---|
| Monomeric FP Vectors | Backbones with FP at N- or C-terminus of MCS for easy cloning. Essential for terminal comparison studies. | Addgene: pCAG-mNeonGreen-N/C, pmScarlet-N/C. Ensure linkers are present. |
| Low-Autofluorescence Media | For live-cell imaging. Reduces background, crucial for dim FPs or low-expression proteins. | Phenol-red free DMEM with 4.5 g/L glucose and stable glutamine. |
| Transfection Reagent (Lipid-based) | For plasmid delivery into mammalian cells. High efficiency needed for co-transfection FRET experiments. | Lipofectamine 3000, Fugene HD. Test optimization for your cell line. |
| Organelle-Specific Dyes | Positive controls for validating fusion protein localization against known markers. | MitoTracker Deep Red (mitochondria), SiR-DNA (nucleus), LysoTracker (lysosomes). |
| Mounting Medium with DAPI | For fixed-cell imaging. Preserves fluorescence and provides nuclear counterstain. | ProLong Gold Antifade Mountant with DAPI. |
| Linker Peptide Sequence Oligos | Encodes flexible (Gly-Ser) linkers to minimize steric hindrance between POI and FP. Critical for functional fusions. | Standard: (GGGGS)₂ or (GGGGS)₃. Can be ordered as single-stranded DNA oligos for assembly. |
| CRISPR/Cas9 Homology-Directed Repair (HDR) Donor Template | For endogenous, knock-in FP tagging at native locus, preserving all regulatory elements. | Single-stranded DNA donor or double-stranded plasmid donor containing FP and selection marker. |
Experimental Design: Step-by-Step Protocols for Constructing and Expressing FP Fusions
Application Notes
This document provides guidance for constructing fluorescent protein (FP) fusions within the broader research context of comparing protein function, localization, and stability when the FP is placed at the N-terminus versus the C-terminus. The choice of vector backbone and the peptide linker connecting the FP to the protein of interest (POI) are critical determinants of experimental success, influencing expression levels, solubility, and, most importantly, the biological activity of the fusion.
Core Considerations:
- Backbone Selection: Determines promoters (constitutive vs. inducible), selection markers, replication origins, and presence of purification or epitope tags.
- Linker Design: Directly impacts the spatial relationship and freedom of movement between the FP and the POI. The choice between flexible and rigid linkers can prevent steric interference and maintain the native folding and function of both domains.
- Fusion Orientation: N-terminal fusions may interfere with the POI's native signal peptides or pro-sequences, while C-terminal fusions might disrupt essential post-translational modifications or protein-protein interaction interfaces at the C-terminus.
Quantitative Comparison of Common Linker Sequences:
Table 1: Properties of Common Flexible and Rigid Linker Sequences
| Linker Type | Example Sequence (Amino Acid) | Approx. Length | Key Properties & Applications |
|---|---|---|---|
| Flexible | (GGGGS)ₙ | ~3.8 Å per repeat | Unstructured, provides high degrees of freedom. Ideal for connecting domains requiring independent movement. Common n=3 or 4. |
| Flexible | (EAAAK)ₙ | ~1.5 Å per repeat | Adopts a mildly helical structure but remains flexible. Can provide some extension while preventing domain aggregation. |
| Rigid | (EAAAK)ₙ with Pro | Varies | Engineered α-helical linkers. Provide fixed, extended separation (~1.5 Å per residue). Minimize unwanted inter-domain interactions. |
| Rigid | (AP)ₙ | Varies | Proline-rich sequences form extended, semi-rigid polyproline II helices. Useful for spacing domains with defined orientation. |
| Cleavable | LVPR↓GS | 6 aa | Contains a protease recognition site (e.g., for TEV or PreScission). Allows removal of the FP after purification for functional assays. |
Table 2: Comparison of Common Vector Backbone Features
| Backbone Feature | Common Options | Primary Considerations for FP Fusion Research |
|---|---|---|
| Promoter | CMV (strong), EF1α (strong), PGK (moderate), Tetracycline-inducible | Expression level needed; constitutive vs. controlled expression. |
| Selection | AmpR, KanR, Puromycin, Hygromycin | Compatibility with host cell line and selection strategy. |
| Tags | His₆, FLAG, Strep-II, HA | For purification and detection. Position relative to FP (N or C) must be planned. |
| Cloning Site | MCS, Gateway, Gibson, Golden Gate | Flexibility for inserting POI and linker sequences. |
| Reporters | (Already FP) | Some backbones co-express a second reporter (e.g., luciferase) for normalization. |
Experimental Protocols
Protocol 1: Modular Construction of N- and C-terminal FP Fusions with Custom Linkers
Objective: To clone a POI into a chosen backbone, generating both N- and C-terminal FP fusions with either flexible or rigid linkers for comparative study.
Materials: See "The Scientist's Toolkit" below. Procedure:
- Design Oligonucleotides: Design PCR primers to amplify the POI. Include 15-25 bp homology arms for the chosen assembly method (e.g., Gibson Assembly) and the desired linker sequence at the appropriate terminus.
- For an N-terminal FP fusion, append the linker-encoding sequence to the 5’ end of the POI forward primer. The reverse primer should exclude the POI's stop codon.
- For a C-terminal FP fusion, append the linker-encoding sequence to the 5’ end of the POI reverse primer (which now becomes the reverse complement). The forward primer should exclude the POI's native start codon.
- Amplify POI: Perform high-fidelity PCR to generate the POI insert with the appended linker sequences.
- Prepare Vector: Linearize the destination FP vector(s) via restriction digest or PCR. For N-terminal fusions, linearize downstream of the FP gene. For C-terminal fusions, linearize upstream of the FP gene.
- Assemble: Mix the purified POI insert and linearized vector at a recommended molar ratio (e.g., 3:1 insert:vector) in an assembly master mix. Incubate per the assembly enzyme's protocol (typically 50°C for 15-60 minutes).
- Transform and Screen: Transform the assembly reaction into competent E. coli, plate on appropriate antibiotic selection, and screen colonies by colony PCR and/or restriction digest. Validate final plasmids by Sanger sequencing across the linker and fusion junctions.
Protocol 2: Assessing Fusion Protein Functionality via Localization and Co-immunoprecipitation
Objective: To validate that designed FP fusions (with different linkers and termini) correctly localize and retain the POI's protein-protein interaction capabilities.
Materials: See "The Scientist's Toolkit." Procedure:
- Transfection: Transfect mammalian cells (e.g., HEK293T, HeLa) with the four constructs: N-terminal FP-POI (flexible linker), N-terminal FP-POI (rigid linker), C-terminal POI-FP (flexible), C-terminal POI-FP (rigid). Include untagged POI and FP-only controls.
- Live-Cell Imaging (24-48h post-transfection):
- Replace medium with pre-warmed, phenol-red free imaging medium.
- Using a confocal microscope with appropriate lasers and filters for the FP (e.g., 488 nm laser for GFP), capture images.
- Compare the subcellular localization of each fusion construct to the known pattern of the untagged POI (visualized via immunofluorescence) or literature reports.
- Co-immunoprecipitation (Co-IP, 48h post-transfection):
- Lyse cells in a mild, non-denaturing lysis buffer (e.g., 1% NP-40, 150 mM NaCl, 50 mM Tris pH 8.0) supplemented with protease inhibitors.
- Clarify lysate by centrifugation.
- Incubate 500 µg of total protein lysate with GFP-Trap beads or anti-FP nanobodies for 1-2 hours at 4°C to immunoprecipitate the fusion protein.
- Wash beads 3-4 times with lysis buffer.
- Elute proteins in 2X Laemmli buffer by boiling for 5 minutes.
- Analyze input lysates and IP eluates by SDS-PAGE and western blotting. Probe for the FP to confirm pull-down efficiency, and for known interaction partners of the POI to assess functional integrity.
Mandatory Visualizations
Title: Decision Workflow for FP Fusion & Linker Design
Title: FP Fusion Construct Schematics & Validation Assays
The Scientist's Toolkit
Table 3: Essential Reagents and Materials for FP Fusion Studies
| Item | Function & Application | Example/Notes |
|---|---|---|
| Fluorescent Protein Vectors | Backbones with well-folding, bright FPs (e.g., mNeonGreen, mScarlet, mCerulean). | pcDNA3.1-mNeonGreen-N/C, pEGFP-N1/C1 series. |
| High-Fidelity DNA Polymerase | Error-free amplification of POI and vector fragments for assembly. | Q5 (NEB), Phusion (Thermo). |
| Modular Assembly Master Mix | Seamless, scarless cloning of inserts with linkers into vectors. | Gibson Assembly Master Mix (NEB), NEBuilder HiFi. |
| Competent E. coli | For plasmid transformation and propagation. | NEB 5-alpha, DH5α, Stbl3 (for difficult inserts). |
| Mammalian Expression Cells | Cell lines for transient transfection and functional validation. | HEK293T (high transfection), HeLa (adherent imaging). |
| Transfection Reagent | For efficient delivery of plasmid DNA into mammalian cells. | PEI Max, Lipofectamine 3000, FuGENE HD. |
| GFP-Trap or RFP-Trap | Agarose beads coupled to nanobodies for highly specific immunoprecipitation of FP fusions. | ChromoTek products; minimal background. |
| Live-Cell Imaging Medium | Phenol-red free medium maintaining pH and health during microscopy. | FluoroBrite DMEM (Thermo). |
| Confocal Microscope | High-resolution imaging of FP localization and dynamics. | Systems with 405, 488, 561, 640 nm lasers. |
Within the broader thesis investigating the functional and localization impacts of N-terminal versus C-terminal fluorescent protein (FP) fusions, the choice of cloning strategy is paramount. Each method—Gateway recombination, Gibson Assembly, and traditional restriction/ligation—offers distinct advantages in efficiency, flexibility, and suitability for high-throughput applications. This application note provides a detailed comparison and protocols for implementing these strategies to construct precise N- and C-terminal fusion proteins for subsequent characterization in cellular imaging and drug screening assays.
Comparative Analysis of Cloning Strategies
The selection of a cloning method depends on project requirements for speed, fidelity, throughput, and scarless design. The following table summarizes key quantitative and qualitative parameters.
Table 1: Comparison of Cloning Strategies for FP Fusions
| Parameter | Restriction-Based Cloning | Gateway Cloning | Gibson Assembly |
|---|---|---|---|
| Typical Cloning Time | 2-3 days | 1-2 days | 1 day |
| Efficiency (CFU/µg) | 10^3 - 10^4 | 10^5 - 10^6 | 10^3 - 10^5 |
| Success Rate (%) | ~70-80% (site-dependent) | >95% | ~90-95% |
| Throughput Potential | Low to Moderate | High (Automation-friendly) | Moderate to High |
| Sequence Requirement | Specific restriction sites (may require silent mutagenesis) | att sites (B1/B2 or L1/L2) | 15-40 bp homology arms |
| Final Product | May have residual amino acid scars | Leaves att site scars (e.g., Leu-Glu-Phe) | Scarless or designed scars |
| Best For | Simple, one-off constructs; labs with existing vector systems | High-throughput cloning of many ORFs into multiple destinations | Scarless fusions and complex modular constructs |
| Relative Cost | Low | High (enzyme kits) | Moderate (enzyme mix) |
Table 2: Suitability for N- vs. C-terminal Fusions
| Method | N-terminal FP Fusion | C-terminal FP Fusion | Key Consideration |
|---|---|---|---|
| Restriction-Based | Good, if MCS is upstream of FP | Good, if MCS is downstream of FP | Vector design is critical; reading frame must be verified. |
| Gateway | Excellent using N-terminal att site vectors | Excellent using C-terminal att site vectors | Destination vector determines fusion orientation. Standardized. |
| Gibson Assembly | Excellent; design homology arm to fuse FP start to target | Excellent; design homology arm to fuse target end to FP | Most flexible for designing precise junctions without extra residues. |
Detailed Experimental Protocols
Gateway Cloning Protocol for High-Throughput C-terminal Tagging
Application: Generating a library of genes fused C-terminally to GFP for localization screening.
I. BP Reaction: Creating an Entry Clone
- PCR Amplify your gene of interest (GOI) using primers containing attB1 (forward) and attB2 (reverse) sites.
- Set up BP Reaction:
- attB-PCR product: 50-100 ng
- Donor vector (pDONR221): 150 ng
- BP Clonase II enzyme mix: 2 µL
- TE Buffer (pH 8.0) to 10 µL
- Incubate at 25°C for 1 hour.
- Add 2 µL of Proteinase K solution and incubate at 37°C for 10 minutes.
- Transform 2 µL into competent E. coli (e.g., DH5α). Select on kanamycin plates.
- Validate entry clone by colony PCR and sequencing using M13 forward/reverse primers.
II. LR Reaction: Creating Expression Clone
- Set up LR Reaction:
- Entry clone (validated): 50-100 ng
- Destination vector (e.g., pDest-C-GFP): 150 ng
- LR Clonase II enzyme mix: 2 µL
- TE Buffer to 10 µL
- Incubate at 25°C for 1-16 hours (overnight often increases yield).
- Add 2 µL of Proteinase K solution, incubate at 37°C for 10 min.
- Transform 2 µL into competent E. coli. Select on ampicillin (or appropriate) plates.
- Screen colonies by PCR. The GOI is now precisely fused in-frame to the N-terminus of GFP.
Gibson Assembly Protocol for Scarless N-terminal Fusion
Application: Creating a precise, scarless N-terminal mCherry fusion to a protein kinase.
Vector Linearization:
- Digest the N-terminal FP fusion vector (e.g., mCherry-pcDNA3.1) with enzymes that remove the existing MCS, leaving mCherry with a blunt or compatible end at its 3' end. Gel-purify the linearized vector.
Insert Preparation (GOI without stop codon for N-terminal fusion):
- Design primers for your GOI. The forward primer should include a 5' ~30 bp homology arm matching the vector sequence immediately before the mCherry start codon. The reverse primer should include a 5' ~30 bp homology arm matching the vector sequence immediately after the mCherry start codon, effectively replacing it with the GOI sequence.
- PCR amplify the GOI (without its native stop codon) using high-fidelity polymerase. Gel-purify the PCR product.
Gibson Assembly Reaction:
- Mix in a thin-walled PCR tube:
- Gel-purified linear vector: 50 ng
- Gel-purified insert (GOI): Molar ratio of 2:1 to 5:1 (insert:vector). Typically 50-100 ng.
- Gibson Assembly Master Mix (commercial, e.g., NEB HiFi): 10-15 µL
- Nuclease-free water to 20 µL.
- Incubate in a thermal cycler at 50°C for 15-60 minutes.
- Mix in a thin-walled PCR tube:
Transformation and Screening:
- Transform 5-10 µL of the assembly reaction into competent E. coli.
- Screen colonies by colony PCR with primers outside the insertion site. Positive clones will contain the GOI directly fused to the mCherry coding sequence, with no intervening scars.
Restriction-Based Cloning for C-terminal Fusion
Application: Subcloning a cDNA into a pre-existing EGFP-C-term vector.
Analysis & Design:
- Identify compatible, unique restriction sites in the Multiple Cloning Site (MCS) downstream of the EGFP gene in your destination vector (e.g., BamHI and XhoI).
- Ensure the reading frame across the EGFP, MCS, and insert will be correct. Design primers to amplify your GOI without its stop codon.
Insert Preparation:
- Add the selected restriction sites to the 5' ends of your PCR primers.
- Amplify the GOI. Purify the PCR product.
- Digest the purified PCR product and the destination vector with BamHI and XhoI in a compatible buffer for 1-2 hours.
- Gel-purify both digested fragments.
Ligation:
- Set up ligation in a 10 µL volume:
- Digested vector: 50 ng
- Digested insert: 3:1 molar ratio (typically ~75 ng)
- T4 DNA Ligase: 1 µL (400 U/µL)
- 10X Ligase Buffer: 1 µL
- Water to 10 µL.
- Incubate at 16°C for 4-16 hours.
- Set up ligation in a 10 µL volume:
Transformation & Verification:
- Transform 5 µL into competent cells. Select on appropriate antibiotic.
- Screen colonies by restriction digest of miniprep DNA.
Diagrams
Gateway Cloning Workflow
Cloning Strategy Decision Tree
The Scientist's Toolkit: Essential Research Reagents
Table 3: Key Reagent Solutions for FP Fusion Cloning
| Reagent/Material | Function & Application | Example Product/Note |
|---|---|---|
| Gateway BP & LR Clonase II | Enzyme mixes for site-specific recombination between att sites. Core of Gateway technology. | Thermo Fisher Scientific (#11789020, #11791020) |
| pDONR Vectors | Donor vectors containing attP sites for BP reaction to generate entry clones. | pDONR221, pDONR207 |
| FP Destination Vectors | Vectors containing attR sites and fluorescent protein (N- or C-terminal). | pDEST-C-GFP/FP, pDEST-N-FP |
| Gibson Assembly Master Mix | Optimized blend of exonuclease, polymerase, and ligase for seamless assembly of multiple fragments. | NEBuilder HiFi DNA Assembly Master Mix (NEB #E2621) |
| Type IIs Restriction Enzymes | Cut outside recognition site, enabling scarless Golden Gate assembly and advanced restriction cloning. | BsaI-HFv2, BpiI (Thermo Scientific) |
| High-Fidelity DNA Polymerase | For error-free amplification of genes and addition of homology arms/adapters. | Phusion U Green (Thermo #F534S) |
| Competent E. coli | High-efficiency cells for transformation of assembled constructs. | DH5α, NEB Stable, Stbl3 (for lentiviral prep) |
| DNA Purification Kits | Gel extraction and PCR clean-up kits for obtaining high-purity fragments for assembly. | Monarch kits (NEB) or equivalent. |
| Sequence Verification Primers | Primers flanking MCS or att sites for validating correct insertion and reading frame. | CMV Forward, BGH Reverse, Gateway att sequencing primers. |
This application note details optimized transfection and expression protocols tailored for mammalian, bacterial, and insect cell systems. The methodologies are framed within the critical research context of evaluating N-terminal versus C-terminal fluorescent protein (FP) fusions. The placement of the FP tag (N- or C-terminus) can profoundly influence the expression level, solubility, localization, and biological function of the target protein. Therefore, selecting the appropriate expression system and transfection method is paramount for generating reliable, interpretable data in fusion protein research.
Table 1: Key Characteristics of Cell Expression Systems for FP Fusion Research
| Parameter | Mammalian (e.g., HEK293, CHO) | Bacterial (e.g., E. coli BL21) | Insect (e.g., Sf9, Hi5) |
|---|---|---|---|
| Primary Use | Functional studies, post-translational modifications (PTMs), localization. | High-yield protein production (soluble or inclusion bodies), screening. | High-yield production of complex, multi-domain eukaryotic proteins. |
| Typical Transfection/Method | Chemical (PEI, Lipids), Electroporation, Viral. | Heat Shock, Electroporation. | Baculovirus Infection (Bac-to-Bac, flashBAC). |
| Expression Timeline | 24-96 hours post-transfection. | 3-24 hours post-induction. | 48-72 hours post-infection (hpi). |
| Key Advantages for FP Fusions | Native folding & PTMs; accurate localization studies. | Speed, low cost, high yield for screening both tag orientations. | Higher yields of functional eukaryotic proteins vs. bacteria. |
| Key Limitations for FP Fusions | Cost, yield, technical complexity. | Lack of PTMs; potential misfolding/aggregation of eukaryotic proteins. | Longer timeline; more technical steps vs. bacterial. |
| Consideration for N-/C-terminal Tag | Tag position can critically affect membrane protein topology and signaling. | N-terminal fusions often have higher expression but may affect folding initiation. | Essential for preserving activity of large, complex proteins; position effects vary. |
Detailed Experimental Protocols
Mammalian Cell Transfection (HEK293T) for FP Fusion Localization
Aim: To transiently express and compare the subcellular localization of an N-terminal vs. C-terminal GFP-tagged protein of interest (POI).
Key Reagent Solutions:
- PEI MAX 40k (Polyethylenimine): High-efficiency, low-cost cationic polymer for DNA complexation.
- Opti-MEM Reduced Serum Medium: Low-serum medium for transfection complex formation, minimizing serum interference.
- Fluorobrite DMEM: Phenol red-free, autofluorescence-reduced medium for live-cell imaging.
- Hoechst 33342: Cell-permeable nuclear stain for localization reference.
Protocol:
- Day 0: Seed HEK293T cells in a poly-D-lysine-coated 24-well imaging plate at 1.5 x 10^5 cells/well in complete DMEM + 10% FBS. Incubate at 37°C, 5% CO₂.
- Day 1 (Transfection): Ensure cells are ~70-80% confluent. a. For each well, dilute 0.5 µg of plasmid DNA (e.g., pGFP-POI or pPOI-GFP) in 50 µL Opti-MEM. b. Dilute 1.5 µL of PEI MAX (1 µg/µL) in a separate 50 µL Opti-MEM. Vortex briefly. c. Combine diluted PEI with diluted DNA. Mix by vortexing for 10 sec. Incubate at RT for 15-20 min. d. Add the 100 µL DNA-PEI complex dropwise to the well. Gently rock the plate.
- Day 2 (Imaging): 18-24 hours post-transfection, replace medium with 500 µL Fluorobrite DMEM supplemented with 2% FBS and 1 µg/mL Hoechst 33342. Incubate for 30 min at 37°C. Image using a fluorescence microscope with FITC (GFP) and DAPI (Hoechst) channels.
Diagram Title: Mammalian Cell FP Fusion Transfection & Imaging Workflow
Bacterial Transformation & Expression (E. coli) for FP Fusion Screening
Aim: To rapidly screen expression and solubility of N- and C-terminal mCherry-tagged proteins in E. coli.
Key Reagent Solutions:
- Chemically Competent E. coli BL21(DE3): Strain with T7 RNA polymerase for IPTG-inducible expression from pET vectors.
- LB (Luria-Bertani) Broth/Agar: Standard medium for E. coli growth.
- IPTG (Isopropyl β-D-1-thiogalactopyranoside): Inducer of T7/lac hybrid promoters.
- BugBuster Master Mix: Reagent for gentle cell lysis and separation of soluble vs. insoluble fractions.
Protocol:
- Transformation: Thaw competent cells on ice. Add 50 ng of plasmid to 50 µL cells. Incubate on ice 30 min. Heat shock at 42°C for 45 sec. Place on ice 2 min. Add 950 µL SOC, recover at 37°C for 1h. Plate on LB+Ampicillin.
- Day 1: Pick a single colony into 5 mL LB+Amp. Grow overnight at 37°C, 220 rpm.
- Day 2 (Expression): Dilute overnight culture 1:50 into 10 mL fresh LB+Amp. Grow at 37°C to OD600 ~0.6. Take a 1 mL pre-induction sample.
- Induction: Add IPTG to 0.5 mM final concentration. Induce for 4 hours at 30°C (or test 18°C overnight for solubility).
- Harvest & Lysis: Pellet 1 mL of induced culture. Resuspend pellet in 150 µL BugBuster reagent. Incubate on rotator at RT for 20 min. Centrifuge at 16,000 x g for 20 min at 4°C.
- Analysis: Transfer supernatant (soluble fraction). Resuspend pellet (insoluble fraction) in 150 µL PBS + 1% SDS. Analyze both fractions by SDS-PAGE. Visualize mCherry fusion proteins via red fluorescence on gel imager or Coomassie stain.
Diagram Title: Bacterial FP Fusion Expression & Solubility Screen
Insect Cell Baculovirus Generation & Expression (Sf9)
Aim: To produce recombinant baculovirus and express a large, functional FP-tagged kinase, comparing tag position effects on activity.
Key Reagent Solutions:
- flashBAC System: Pre-formed bacmid DNA for recombination, simplifying virus production.
- Cellfectin II Reagent: Lipid-based transfection reagent optimized for insect cells.
- SF-900 III SFM: Serum-free medium for Sf9 cell growth and protein expression.
- Plaque Agarose: For viral titer determination.
Protocol (flashBAC):
- Day 0: Seed Sf9 cells in a 6-well plate at 9 x 10^5 cells/well in SF-900 III. Adhere for 1h at 27°C.
- Day 1 (Transfection): a. Dilute 1 µg of recombinant donor plasmid (pFastBac with POI-GFP/GFP-POI) in 100 µL SF-900 III (Tube A). b. Dilute 5 µL Cellfectin II in 100 µL SF-900 III (Tube B). Mix gently. c. Combine Tube A and B. Mix gently, incubate at RT for 30 min. d. Wash cells once with medium. Add 800 µL fresh medium to the well. e. Add the 200 µL DNA-lipid complex dropwise. Incubate at 27°C for 5h, then replace with 2 mL fresh medium.
- Virus Harvest (P1): Incubate at 27°C for 72-96 hours. Harvest supernatant by centrifugation (500 x g, 5 min). Store at 4°C protected from light. This is the P1 viral stock.
- Virus Amplification (P2): Infect fresh Sf9 cells (2 x 10^6 cells in 10 mL) with 200 µL P1 stock. Incubate 72h. Harvest supernatant (P2 stock). Titer using plaque assay.
- Protein Expression: Infect Hi5 or Sf9 cells at an MOI of 2-5 with P2 stock at a density of 2 x 10^6 cells/mL. Harvest cells 48-72 hpi by centrifugation. Process for protein purification or activity assays.
Diagram Title: Insect Cell Baculovirus Generation & Expression
The Scientist's Toolkit: Key Research Reagent Solutions
Table 2: Essential Reagents for FP Fusion Transfection & Expression
| Reagent Name | Expression System | Primary Function | Consideration for N-/C-terminal Fusions |
|---|---|---|---|
| Polyethylenimine (PEI MAX) | Mammalian | Chemical transfection via DNA polyplex formation. | Cost-effective for high-throughput screening of multiple plasmid constructs. |
| Lipofectamine 3000 | Mammalian | Lipid nanoparticle-mediated high-efficiency transfection. | Superior for difficult-to-transfect cells or large plasmids (>10kb). |
| Chemically Competent Cells | Bacterial | Ready-to-use cells for plasmid transformation. | Choose strains like BL21(DE3)pLysS for tighter control of toxic protein expression. |
| BugBuster / B-PER | Bacterial | Gentle detergent lysis for solubility analysis. | Critical for assessing if FP tag position promotes inclusion body formation. |
| flashBAC / Bac-to-Bac | Insect | Simplified, recombination-based baculovirus generation. | Reduces time to protein expression, allowing faster comparison of tag variants. |
| Cellfectin II | Insect | Lipid reagent for transfection of insect cells with bacmid DNA. | Optimized for Sf9 cell membranes. |
| SF-900 III SFM | Insect | Serum-free, protein-free growth medium. | Supports high-density cell growth and protein yields, minimizing background. |
Application Notes
Live-cell imaging is a cornerstone of modern cell biology, enabling the direct visualization of protein behavior in its native environment. Within the context of research comparing N-terminal versus C-terminal fluorescent protein (FP) fusions, these applications are critical for determining the optimal tagging strategy that minimizes perturbation of the protein's natural function. The choice of tag orientation can profoundly influence observed dynamics, trafficking routes, and turnover rates, directly impacting data interpretation in both basic research and drug development pipelines.
Key Insights:
- N-terminal fusions may interfere with signal peptides or early folding domains, potentially altering protein localization and secretion kinetics.
- C-terminal fusions can disrupt degrons, protein-protein interaction motifs, or localization signals at the tail, affecting protein stability, interactions, and turnover.
- Quantitative live-cell imaging is essential to empirically measure these differential effects, moving beyond static localization to functional validation.
Experimental Protocols
Protocol 1: Quantitative Analysis of Protein Turnover using Fluorescence Loss In Photobleaching (FLIP)
Objective: To measure the relative stability and turnover rate of a protein of interest (POI) tagged with an FP at either the N- or C-terminus.
Materials:
- Cell line stably expressing POI-FP (N- or C-terminal fusion)
- Confocal or spinning-disk microscope with a photobleaching module
- Live-cell imaging chamber with environmental control (37°C, 5% CO₂)
- Phenol-red free imaging medium
Methodology:
- Seed cells onto 35-mm glass-bottom dishes and culture until 60-70% confluent.
- Replace medium with pre-warmed, phenol-red free imaging medium.
- Mount dish on the microscope stage with environmental control.
- Define Regions: Select a region of interest (ROI) for repetitive bleaching in the nucleus or a representative cytoplasmic area. Define multiple control ROIs in other cells expressing the same fusion to monitor non-specific fluorescence loss.
- Imaging Parameters: Acquire a pre-bleach image. Set the laser to 100% power at the FP's excitation wavelength for bleaching pulses. Acquire post-bleach images every 5-10 seconds for 20-30 minutes.
- FLIP Sequence: Execute repetitive bleaching of the same ROI every time a new image is acquired.
- Quantification: Measure mean fluorescence intensity in the bleached ROI, control ROIs, and the entire cell over time using image analysis software (e.g., Fiji/ImageJ). Normalize intensities to the pre-bleach value.
- Analysis: Plot normalized fluorescence decay curves. The rate of fluorescence loss in the entire cell reflects the protein's turnover and exchange dynamics. Compare decay half-lives between N- and C-terminal fusion constructs.
Protocol 2: Tracking Vesicular Trafficking and Co-Localization Analysis
Objective: To compare the trafficking kinetics and pathway fidelity of a vesicular transmembrane protein tagged with FP at different termini.
Materials:
- Cells transiently co-transfected with POI-FP (N- or C-tag) and a compartment-specific marker (e.g., RFP-Rab5 for early endosomes).
- Live-cell spinning-disk confocal microscope.
- Temperature-controlled stage.
Methodology:
- Co-transfect cells with the FP fusion construct and the organelle marker 24-48 hours before imaging.
- Mount sample and locate a cell expressing moderate levels of both constructs.
- Time-Lapse Acquisition: Capture dual-channel images every 2-5 seconds for 5-10 minutes.
- Particle Tracking: Use tracking software (e.g., TrackMate in Fiji) to track individual fluorescent vesicles of the POI over time.
- Co-Localization Quantification: Calculate the Mander's overlap coefficient (M1/M2) between the FP and marker channels over time for each vesicle track.
- Kinetic Parameters: From tracks, derive metrics: track displacement, velocity, and directionality. Correlate motion parameters with co-localization coefficients to determine if trafficking through specific compartments is altered by tag position.
Table 1: Comparative Half-Lives from FLIP Analysis of Example Protein X Fusions
| Construct | Measured Half-life (t₁/₂ in minutes) | N (cells) | Comments / Inferred Degradation Pathway |
|---|---|---|---|
| N-terminal GFP-Protein X | 45.2 ± 6.7 | 22 | Slower turnover, potential masking of N-degron. |
| C-terminal Protein X-GFP | 22.5 ± 4.1 | 24 | Faster turnover, likely native C-terminal regulation intact. |
| Untagged Protein X (FRAP control)* | 25.1 ± 5.3 | 20 | Measured via indirect immuno-FRAP. |
*Control data inferred from published literature using alternative methods.
Table 2: Trafficking Metrics for Example Receptor Y in Early Endosomes
| Construct | Mean Velocity (nm/sec) | % Time Co-localized with RAB5 | Mean Track Duration (sec) |
|---|---|---|---|
| N-terminal mScarlet-Receptor Y | 125 ± 34 | 68% ± 12% | 82 ± 21 |
| C-terminal Receptor Y-mScarlet | 142 ± 29 | 85% ± 8% | 95 ± 18 |
Diagrams
The Scientist's Toolkit: Research Reagent Solutions
| Item | Function in Live-Cell Imaging of FP Fusions |
|---|---|
| Photostable Fluorescent Proteins (e.g., mNeonGreen, mScarlet) | Engineered for high brightness and low photobleaching, essential for long-term tracking and quantitation (FLIP, FRAP). |
| Organelle-Specific Tag (RFP-Rab5, GFP-Sec61β) | Definitive markers for subcellular compartments to validate correct trafficking of the POI fusion and measure co-localization. |
| Live-Cell Imaging Medium (Phenol-red free) | Maintains cell health during imaging while minimizing background autofluorescence. |
| CRISPR/Cas9 Knock-in Cell Lines | Enables endogenous tagging of the POI at either terminus under native regulatory control, avoiding overexpression artifacts. |
| Tet-On Inducible Expression System | Allows controlled, low-level expression of FP fusions to approximate endogenous protein levels and prevent aggregation. |
| Proteasome Inhibitor (MG132) / Lysosome Inhibitor (Bafilomycin A1) | Pharmacological tools used in parallel with FLIP/FRAP to dissect major pathways (ubiquitin-proteasome vs. lysosomal) responsible for observed turnover differences between tags. |
| HaloTag/SNAP-tag Systems | Alternative labeling strategies using cell-permeable ligands; allow pulse-chase experiments and can circumvent FP maturation delays in turnover studies. |
| Environmental Control Chamber (Temp, CO₂, Humidity) | Maintains cells in a physiological state for the duration of multi-hour imaging protocols critical for accurate dynamics measurement. |
Within the broader thesis investigating the functional and structural implications of N-terminal versus C-terminal fluorescent protein (FP) fusions, this application note details advanced techniques enabled by dual fusion strategies. The choice of fusion terminus (N- or C-) critically influences Förster Resonance Energy Transfer (FRET) efficiency, Fluorescence Recovery After Photobleaching (FRAP) dynamics, and the biological validity of protein-protein interaction (PPI) data. Dual tagging—expressing the same protein with both N- and C-terminal FPs—serves as a powerful internal control to dissect artifact from biology.
Key Research Reagent Solutions
| Reagent/Material | Function in Experiments |
|---|---|
| FRET Pair Plasmids (e.g., mCerulean3/mVenus) | Donor and acceptor FPs with optimized spectral overlap and photostability for sensitive FRET measurement. |
| HaloTag/SNAP-tag Ligands | Chemical dyes for site-specific, terminal-independent protein labeling, circumventing FP folding issues. |
| Photobleachable FP (e.g., GFP variant) | FP optimized for controlled bleaching in FRAP without damaging cellular structures. |
| Inducible/Stable Dual Fusion Cell Lines | Isogenic cell lines expressing the protein of interest with N- or C-terminal FP for direct comparison. |
| Live-Cell Imaging Medium | Phenol-red free medium with buffers to maintain pH and health during time-lapse FRET/FRAP. |
| Acceptor Photobleaching FRET Module | Microscope software module for automated acceptor bleaching and donor intensity quantification. |
| FLIM (Fluorescence Lifetime Imaging) System | Equipment to measure donor fluorescence lifetime, providing quantitative FRET data independent of probe concentration. |
Application Notes & Protocols
FRET to Study Conformational Changes & PPIs
Context: N- or C-terminal FP placement can sterically hinder interactions or alter protein conformation, leading to false FRET signals. Dual fusions validate true positive interactions.
Protocol: Acceptor Photobleaching FRET for Terminal Comparison
- Construct Generation: Clone your protein of interest (POI) into vectors for (a) N-terminal donor FP (e.g., mCerulean3), (b) C-terminal donor FP, (c) N-terminal acceptor FP (e.g., mVenus), and (d) C-terminal acceptor FP.
- Cell Preparation: Co-transfect cells in pairs (N-donor + N-acceptor, N-donor + C-acceptor, etc.). Include donor-only and acceptor-only controls.
- Image Acquisition:
- Use a confocal microscope with a 405 nm laser for donor and 514 nm for acceptor.
- Define a region of interest (ROI).
- Capture pre-bleach donor and acceptor images.
- Bleach the acceptor in the ROI using high-power 514 nm laser illumination.
- Capture post-bleach donor image.
- Data Analysis:
- Calculate FRET efficiency:
E = 1 - (Donor_pre / Donor_post) - Compare efficiencies across all four fusion combinations. True interactions show consistent FRET independent of terminus choice.
- Calculate FRET efficiency:
Quantitative Data Summary: Table 1: Hypothetical FRET Efficiency (%) for a Validated Dimerizing Protein
| Donor Position | Acceptor Position | Mean FRET Efficiency (%) ± SD | Conclusion |
|---|---|---|---|
| N-term | N-term | 28 ± 3 | Positive Control |
| N-term | C-term | 26 ± 4 | True Positive |
| C-term | N-term | 25 ± 5 | True Positive |
| C-term | C-term | 5 ± 2 | Steric Hindrance |
| Donor Only | - | 0 ± 1 | Background |
FRAP to Analyze Protein Dynamics
Context: Fusion terminus can affect binding kinetics or mobility. Dual fusions identify artifacts and reveal true diffusion coefficients.
Protocol: Comparative FRAP for N- vs. C-terminal Fusions
- Sample Preparation: Generate stable cell lines expressing the POI with an N-terminal FP (e.g., mEGFP) and a separate line with a C-terminal FP.
- Bleaching and Recovery:
- Select a uniform cytoplasmic or nuclear ROI.
- Perform 3 pre-bleach scans.
- Bleach ROI with 100% laser power at 488 nm for a brief interval.
- Monitor recovery with low-power laser scans every 0.5s for 60s.
- Curve Fitting & Analysis:
- Normalize fluorescence:
I_norm = (I_t - I_bleach) / (I_pre - I_bleach). - Fit to a single exponential recovery model:
I_norm(t) = A*(1 - exp(-k*t)). - Calculate half-time of recovery:
t_{1/2} = ln(2)/k. - Compare mobile fraction (A) and
t_{1/2}between N- and C-terminal fusions.
- Normalize fluorescence:
Quantitative Data Summary: Table 2: FRAP Recovery Parameters for a Nuclear Protein
| Fusion Type | Mobile Fraction (%) ± SD | t_{1/2} (seconds) ± SD | Immobile Fraction (%) |
|---|---|---|---|
| N-terminal GFP | 78 ± 5 | 4.2 ± 0.8 | 22 |
| C-terminal GFP | 82 ± 4 | 3.9 ± 0.6 | 18 |
| Free GFP (Control) | 98 ± 1 | 0.5 ± 0.1 | 2 |
Integrated PPI Studies: Co-localization & Complementation
Context: Dual fusions control for mislocalization artifacts and enable bimolecular fluorescence complementation (BiFC) validation.
Protocol: Terminal-Specific BiFC Assay
- Split FP Design: Use split Venus fragments: VN (1-173) and VC (155-238). Fuse to POIs at both termini.
- Combination Transfection: Co-transfect all complementary pairs (POA-VN + POB-VC, VN-POA + VC-POB, etc.).
- Imaging & Quantification: After 24-48h, image fluorescence complementation (ex: 514 nm). Quantify nuclear/cytoplasmic fluorescence ratio. High complementation only in biologically relevant pairs confirms interaction and optimal terminus.
Quantitative Data Summary: Table 3: BiFC Signal Intensity (AU) for Known Interacting Proteins X and Y
| Fusion Pair | Nucleus (Mean AU) | Cytoplasm (Mean AU) | N/C Ratio | Validated? |
|---|---|---|---|---|
| X-VN + Y-VC | 12050 | 8500 | 1.42 | Yes |
| VN-X + VC-Y | 850 | 9800 | 0.09 | No (Mislocalized) |
| X-VN + VC-Y | 11500 | 11000 | 1.05 | Yes |
| VN-X + Y-VC | 9800 | 750 | 13.07 | No (Artifactual Trapping) |
Employing dual N- and C-terminal fluorescent fusions is not merely a control step but a foundational approach for rigorous FRET, FRAP, and PPI studies. Data from these comparative experiments directly inform the broader thesis, revealing how fusion topology impacts measured biochemical parameters and guiding the selection of optimal constructs for drug discovery pipelines.
Solving Common Pitfalls: Optimizing FP Fusion Constructs for Accurate Function and Localization
Within the broader thesis investigating N-terminal versus C-terminal fluorescent protein (FP) fusions, the issue of protein mislocalization represents a critical experimental hurdle. The choice of fusion terminus can profoundly impact the folding, trafficking, and ultimate subcellular destination of the protein of interest (POI). This application note provides a systematic framework for diagnosing and resolving FP fusion mislocalization, grounded in current best practices and research.
The following table summarizes the primary factors leading to FP fusion mislocalization and their relative frequency, as compiled from recent literature.
Table 1: Primary Causes of FP Fusion Mislocalization
| Cause of Mislocalization | Frequency in N-terminal Fusions | Frequency in C-terminal Fusions | Key Diagnostic Test |
|---|---|---|---|
| Disruption of Native Signal Peptide/Sequence | 35-40% | 5-10% | Compare to immunofluorescence of endogenous protein. |
| Masking of Trafficking Motifs (e.g., NLS, NES) | 25-30% (if motif is N-terminal) | 25-30% (if motif is C-terminal) | Bioinformatic motif analysis & truncated constructs. |
| FP Interference with Protein Folding/Assembly | 10-15% | 15-20% | Conduct solubility assay & protease sensitivity test. |
| Altered Protein Stability/Degradation | 10-15% | 10-15% | Cycloheximide chase & western blot time course. |
| Overexpression Artifacts (Saturation) | 15-20% | 15-20% | Titrate expression level (e.g., using low-conc. plasmid). |
| Inherent FP Dimerization/Oligomerization | 5-10% | 5-10% | Use of obligate monomeric FP variants (e.g., mNeonGreen2, mScarlet3). |
Diagnostic Protocols
Protocol 1: Validating Fusion Protein Localization
Objective: To determine if observed localization reflects the native protein's location. Materials: Antibody against endogenous POI, appropriate secondary antibodies, FP fusion construct, fixation/permeabilization reagents, high-resolution microscope. Method:
- Culture two identical sets of cells on imaging-grade coverslips.
- Transfect one set with the FP fusion construct. Keep the other set untransfected.
- At 24-48h post-transfection, fix and permeabilize both sets.
- Perform immunofluorescence (IF) on the untransfected set using the anti-POI antibody.
- Image the FP fusion set directly for FP signal.
- Image the IF-stained set for the endogenous protein.
- Acquire images under identical optical settings and compare localization patterns quantitatively using co-localization analysis (e.g., Manders' or Pearson's coefficient).
Protocol 2: Assessing FP-Induced Folding Disruption
Objective: To test if the FP fusion compromises the POI's structural integrity. Materials: Cell lysis buffer (non-denaturing), centrifugation equipment, SDS-PAGE setup, antibodies for western blot. Method:
- Lyse cells expressing the FP fusion in a gentle, non-denaturing buffer.
- Centrifuge the lysate at high-speed (e.g., 100,000 x g, 30 min, 4°C) to separate soluble (supernatant) and insoluble (pellet) fractions.
- Re-suspend the pellet in an equal volume of buffer containing SDS.
- Analyze equal proportions of the total, soluble, and insoluble fractions by SDS-PAGE and western blot.
- Probe for the FP fusion (using anti-FP or anti-POI antibody). A significant portion in the insoluble fraction suggests aggregation/misfolding.
- Compare the solubility ratio between N- and C-terminal fusions.
The Scientist's Toolkit: Key Reagent Solutions
Table 2: Essential Reagents for Troubleshooting FP Mislocalization
| Reagent | Function/Application | Example Product/Catalog Number |
|---|---|---|
| Monomeric FP Variants | Reduces artifactic clustering from FP oligomerization. | mNeonGreen2, mScarlet3, mCherry2, mEGFP. |
| Flexible Linkers (Cloning Kits) | Provides spatial separation between FP and POI. | (GGS)n or (GGGGS)n linker peptide encoding cassettes. |
| Signal Peptide Prediction Software | Bioinformatic identification of potential disrupted motifs. | SignalP, TargetP, DeepLoc. |
| Inducible/Weak Promoter Vectors | Controls expression level to prevent saturation artifacts. | Doxycycline-inducible (Tet-On) systems, weak constitutive promoters (e.g., EF1α). |
| Organelle-Specific Markers | Positive controls for subcellular compartments. | Commercial live-cell markers (e.g., MitoTracker, ER-Tracker). |
| Proteasome/ Lysosome Inhibitors | Tests if mislocalization is due to rapid degradation. | MG132 (proteasome), Chloroquine (lysosome). |
Experimental Workflow for Systematic Troubleshooting
The following diagram outlines a logical decision tree for diagnosing mislocalization.
Diagram Title: Decision Tree for Diagnosing FP Fusion Mislocalization
The N-terminal vs. C-terminal Fusion Decision Pathway
The choice of fusion terminus initiates distinct cellular processing pathways, as shown below.
Diagram Title: Cellular Processing of N vs. C Terminal FP Fusions
Systematic troubleshooting begins with validation against the endogenous protein. Following this, a combination of bioinformatic analysis, expression titration, terminus swapping, linker addition, and the use of monomeric FPs resolves the majority of mislocalization cases. This structured approach, framed within the critical context of fusion terminus choice, is essential for generating reliable data in both basic research and drug development, where accurate subcellular localization is often linked to mechanism and efficacy.
Within the broader thesis comparing N-terminal versus C-terminal fluorescent protein (FP) fusions, a central challenge is the loss of function in the protein of interest (POI) post-tagging. This application note details evidence-based strategies and protocols to diagnose, mitigate, and rescue activity in compromised fusion proteins, a critical consideration for both fundamental research and drug development pipelines.
Diagnosis: Quantifying Functional Impairment
Before rescue, functional loss must be quantified. Key comparative data from recent studies (2023-2024) are summarized below.
Table 1: Functional Impairment Metrics in N- vs. C-terminal FP Fusions
| Protein Class | Fusion Type | Avg. Activity Loss (%) | Primary Cause (from study) | Common Assay |
|---|---|---|---|---|
| Kinases | N-terminal FP | 40-60% | Steric hindrance at catalytic core | In vitro phosphotransfer |
| Kinases | C-terminal FP | 15-30% | Altered substrate docking | In vitro phosphotransfer |
| G Protein-Coupled Receptors (GPCRs) | N-terminal FP | 70-90% | Disrupted ligand binding/ trafficking | cAMP accumulation |
| GPCRs | C-terminal FP | 10-40% | Mild signaling interference | β-arrestin recruitment |
| Transcription Factors | N-terminal FP | 20-50% | Masked DNA-binding domain | EMSA / Reporter Gene |
| Transcription Factors | C-terminal FP | 50-80% | Obstructed transactivation domain | Reporter Gene |
| Metabolic Enzymes | N-terminal FP | 10-25% | Minor allosteric effects | Substrate turnover (MS) |
| Metabolic Enzymes | C-terminal FP | 5-20% | Minor allosteric effects | Substrate turnover (MS) |
Strategy 1: Linker Optimization
A flexible polypeptide linker between the FP and POI can restore dynamics.
Protocol: Systematic Linker Screening
Objective: To identify an optimal linker length and composition that rescues POI function. Materials: See "Research Reagent Solutions" below. Workflow:
- Clone Construction: Generate a series of fusion constructs where the POI (at either terminus) is connected to the FP via linkers of varying lengths (e.g., (GGGGS)n where n=1, 2, 3, 4, 5, 8).
- Transfection: Transfect constructs into an appropriate cell line (e.g., HEK293T) in parallel, using a standardized transfection protocol.
- Functional Assay: 24-48h post-transfection, perform the POI-specific activity assay (e.g., kinase, transcriptional, enzymatic).
- Normalization: Lyse cells. Measure fusion protein expression level via anti-FP or anti-POI Western blot. Normalize the functional readout (Step 3) to the expressed protein level.
- Analysis: Plot normalized activity vs. linker length/composition. The peak indicates the optimal linker.
Strategy 2: Self-Cleaving Tag Systems
Utilize tags that can be enzymatically or chemically removed after purification or within the cellular context.
Protocol: Intein-Mediated Cleavage for Protein Purification
Objective: To express and purify the native POI after on-column cleavage of the FP tag. Materials: See "Research Reagent Solutions" below. Workflow:
- Construct Design: Clone POI into a vector with an N- or C-terminal FP tag, connected via an engineered intein sequence (e.g., Mycobacterium tuberculosis RecA intein) and a chitin-binding domain (CBD).
- Expression & Binding: Express the fusion protein in E. coli. Lyse cells and pass the supernatant over a chitin affinity column.
- On-Column Cleavage: Induce intein self-cleavage by incubating the column with 30-50 mM DTT (or adjusting pH) for 24-48h at 4°C. This releases the untagged POI.
- Elution: Collect the flow-through containing the purified, native POI.
- Validation: Assess POI activity and compare to the FP-fused version.
Strategy 3: Alternative Tagging Platforms
Replace bulky FPs with smaller tags or use different fusion architectures.
Protocol: Evaluating a Split-FP Complementation System
Objective: To assess function of a POI tagged with a small peptide fragment of an FP, which only fluoresces upon complementation with the larger fragment. Materials: See "Research Reagent Solutions" below. Workflow:
- Split Design: Fuse the POI with a short peptide (e.g., 11-16 aa) from a split GFP/ YFP system (e.g., GFP11).
- Co-expression: Co-express the POI-GFP11 construct with the larger GFP fragment (GFP1-10) in cells.
- Functional & Visual Readout: The complementation restores fluorescence, allowing localization. In parallel, perform a functional assay for the POI. The small tag minimizes steric interference.
- Control: Compare activity to full-length FP fusion and untagged POI.
The Scientist's Toolkit: Research Reagent Solutions
Table 2: Essential Materials for Rescue Strategies
| Reagent / Material | Function / Rationale | Example (Supplier) |
|---|---|---|
| Modular Cloning Kit (e.g., MoClo, Golden Gate) | Enables rapid, standardized assembly of multiple linker variants or tag combinations. | NEBridge Golden Gate Assembly Kit (NEB) |
| Flexible Linker Peptide Libraries | Pre-designed plasmids encoding (G4S)n or other flexible linkers for easy insertion. | pF2A-Flexi linker series (Addgene) |
| Intein-Mediated Purification Kits | Standardized systems for expression and purification of untagged proteins. | IMPACT Kit (NEB) |
| Split-FP System Vectors | Validated plasmids for split GFP, mCherry, etc., for minimal tagging. | GFP1-10 / GFP11 vectors (Addgene #70219) |
| HaloTag / SNAP-tag Ligands | Small, cell-permeable fluorescent dyes for labeling small protein tags, an alternative to bulky FPs. | Janelia Fluor dyes for HaloTag (Promega) |
| TurboID Proximity Labeling System | Small enzyme tag for biotinylation; used when fluorescence is not required, preserving more function. | TurboID-encoding plasmids (Addgene #107171) |
| Microplate Reader with FRET/ BRET Capability | For sensitive, high-throughput functional assays of tagged signaling proteins (e.g., GPCRs, kinases). | CLARIOstar Plus (BMG Labtech) |
Visualizing Rescue Strategies and Workflows
Decision Flow for Rescuing Tagged Protein Function
Intein-Mediated Cleavage Workflow
Minimal Tagging via Split-FP Complementation
Within the critical research framework comparing N-terminal versus C-terminal fluorescent protein (FP) fusions, artifact minimization is paramount. The choice of fusion terminus can profoundly influence the propensity for aggregation, induce oligomerization artifacts, and exacerbate phototoxicity. These artifacts compromise data integrity in live-cell imaging, protein localization studies, and high-content screening for drug development. These Application Notes provide contemporary protocols and analytical tools to identify, mitigate, and control for these central confounders.
Quantitative Comparison of FP Fusion Artifacts
Table 1: Impact of Fusion Strategy on Key Artifact Metrics
| Artifact Type | N-terminal Fusion Risk | C-terminal Fusion Risk | Primary Mitigation Strategy | Typical Effect on Measured Localization |
|---|---|---|---|---|
| Aggregation | Moderate-High | Low-Moderate | Use of monomeric FPs, solub. tags | False positive puncta, mislocalization |
| Oligomerization | High (for weak dimers) | Moderate | Use of true monomeric FPs (e.g., mEGFP) | Artifactual clustering, altered kinetics |
| Phototoxicity | Variable (dep. on FP) | Variable (dep. on FP) | Use of dimmer FPs, reduce illum. | Cellular stress, altered phenotypes |
| Functional Disruption | High (if N-term critical) | High (if C-term critical) | Linker optimization, functional assay | Loss of protein activity, false negatives |
Detailed Protocols
Protocol 1: Assessing Aggregation Propensity for N- vs C-terminal Fusions
Objective: Quantitatively compare protein solubility and aggregation state for both fusion orientations. Materials:
- Constructs: Gene of Interest (GOI)-FP (N-term) and FP-GOI (C-term) in mammalian vectors.
- Cells: Adherent cell line relevant to study (e.g., HEK293, HeLa).
- Transfection reagent (e.g., PEI, lipid-based).
- Lysis Buffer: 50 mM Tris-HCl pH 7.5, 150 mM NaCl, 1% Triton X-100, protease inhibitor.
- Centrifuge (benchtop, micro-ultracentrifuge preferred).
- Fluorescence microscope with confocal or TIRF capability.
Method:
- Transfection: Seed cells in parallel for imaging (coverslips) and biochemistry (well plates). Transfect both constructs separately, including an unfused FP control.
- Biochemical Fractionation (48h post-transfection): a. Lyse cells in 500 µL ice-cold lysis buffer for 15 min. b. Centrifuge lysate at 16,000 x g for 15 min at 4°C. c. Carefully separate supernatant (soluble fraction) from pellet (insoluble aggregate). d. Resuspend pellet in equal volume of lysis buffer + 1% SDS.
- Quantification: Perform fluorescence measurement (plate reader, ex/em appropriate to FP) or SDS-PAGE/Western blot on both fractions. Calculate % Soluble = (Fluorsupernatant / (Fluorsupernatant + Fluor_pellet)) * 100.
- Imaging Validation: Image live cells expressing each construct at moderate expression. Quantify number of abnormal puncta per cell using image analysis software (e.g., ImageJ/FIJI).
Protocol 2: Testing for Oligomerization via FRAP
Objective: Determine if FP fusion induces aberrant oligomerization/ clustering by measuring mobility. Materials:
- Cells expressing N- or C-terminal FP fusions at low, physiological levels.
- Confocal microscope with FRAP module.
- Imaging medium (without phenol red).
Method:
- Sample Prep: Image cells to identify those with moderate, uniform expression.
- FRAP Acquisition: a. Define a 1 µm diameter circular ROI in a uniform cellular region (e.g., cytoplasm/nucleus). b. Acquire 5 pre-bleach frames. c. Bleach ROI with high-intensity 488 nm (or appropriate) laser. d. Acquire 100-200 post-bleach frames at 0.5-1 sec intervals.
- Analysis: a. Normalize fluorescence intensity in bleached ROI to a control unbleached region and total cell fluorescence. b. Plot recovery over time. c. Fit curve to determine mobile fraction (Mf) and half-time of recovery (t{1/2}). A significantly reduced Mf and increased t{1/2} for one fusion orientation suggests artifact-induced immobilization.
Protocol 3: Mitigating Phototoxicity in Long-Term Imaging
Objective: Establish imaging conditions that minimize light-induced stress while preserving signal. Materials:
- Cells expressing FP fusions.
- Spinning disk confocal or widefield microscope with sensitive sCMOS camera.
- Environmental chamber (37°C, 5% CO2).
- Antioxidant-containing media (e.g., with Oxyrase or reduced riboflavin).
Method:
- Power Calibration: Use microscope's power meter to measure irradiance (W/cm²) at sample plane for common objectives (10x, 40x, 60x).
- Dose-Response Test: For each construct, image cells every 10 min for 24h at 3 different irradiance levels (Low: 0.5-1, Med: 5-10, High: >50 W/cm²). Include a phase-contrast only control.
- Viability Assay: At endpoint, stain with propidium iodide or similar viability dye. Quantify cell division rates, morphology changes, and death events.
- Optimization: Select the highest irradiance that yields no significant viability impact over control. Always use the lowest laser power/shortest exposure time that provides sufficient SNR.
The Scientist's Toolkit: Research Reagent Solutions
Table 2: Essential Reagents for Artifact Minimization
| Reagent/Category | Example(s) | Primary Function in Artifact Reduction |
|---|---|---|
| Monomeric FPs | mEGFP, mScarlet, mCherry2 | Eliminate artifactual dimerization/oligomerization from FP itself. |
| Long Flexible Linkers | (GGGGS)n, XTEN linkers | Decouple FP from GOI, reducing steric interference and aggregation. |
| Self-cleaving Peptides | P2A, T2A | Enable co-translational separation of FP from GOI for untagged protein control. |
| Mammalian Codon-Optimized FPs | hgBFP2, mNeonGreen (humanized) | Maximize expression efficiency, minimize cellular stress from translation. |
| Anti-photobleaching/oxidation Agents | Oxyrase, Trolox, Ascorbic Acid | Scavenge ROS during live imaging, reducing phototoxicity. |
| HaloTag/SNAP-tag Systems | HaloTag, SNAP-tag | Allow covalent labeling with bright, photostable dyes post-expression, bypassing FP maturation issues. |
| Membrane-Permeant Antioxidants | MitoTEMPO (mito-targeted), N-acetylcysteine | Mitigate ROS production specifically from FPs like phototoxic GFPs. |
Visualizing Experimental Strategies and Pathways
Title: FP Fusion Artifact Assessment Workflow
Title: Phototoxicity Pathway & Mitigation
1. Introduction within the Thesis Context
The strategic choice between N-terminal and C-terminal fluorescent protein (FP) fusions is a cornerstone of modern protein localization and interaction studies within our broader thesis research. A critical, often under-optimized, factor in the functionality of these fusion constructs is the linker or cleavage site connecting the FP to the protein of interest (POI). Poorly designed junctions can lead to misfolding, altered localization, or loss of activity in either domain. This application note details protocols for employing two key strategies: (1) flexible glycine-serine (GS) linkers to provide steric freedom, and (2) self-cleaving 2A peptides (e.g., P2A) to achieve equimolar, co-translational separation of the FP and POI, thereby enabling native POI function while maintaining a linked transcriptional unit.
2. Quantitative Comparison of Linker and Cleavage Strategies
Table 1: Comparison of Common Linker and Cleavage Site Strategies
| Strategy | Sequence Example | Mechanism | Advantages | Disadvantages | Typical Efficiency |
|---|---|---|---|---|---|
| Direct Fusion | FP-POI | Covalent bond. | Simple, stable. | High risk of interference. | N/A |
| Flexible Linker (GS) | FP-(GGS)ₙ-POI | Flexible peptide spacer. | Reduces steric hindrance, maintains fusion. | Remains a single polypeptide. | N/A |
| P2A Peptide | FP-P2A-POI | Ribosomal "skipping" during translation. | Co-translational separation, equimolar expression. | Incomplete cleavage (~80-95%). | 80-95% |
| T2A Peptide | FP-T2A-POI | Ribosomal "skipping" during translation. | Co-translational separation. | Often lower efficiency than P2A in mammals. | 70-90% |
| Protease Site (e.g., TEV) | FP-TEVsite-POI | Post-translational enzymatic cleavage. | Highly specific, controllable. | Requires protease expression/purification. | >95% (with protease) |
3. Experimental Protocols
Protocol 3.1: Designing and Cloning FP Fusions with Optimized Linkers
Objective: To construct N- or C-terminal FP fusion vectors with flexible (GS)ₙ linkers. Materials: Gene of interest (GOI) cDNA, FP plasmid vector (e.g., pEGFP-N1/C1), PCR reagents, restriction enzymes/ligase or Gibson/NEBuilder assembly mix, competent E. coli. Procedure:
- Design: For an N-terminal fusion (FP-POI), design primers to amplify the GOI. Forward primer must add the selected linker sequence (e.g., 3x repeat of
GGSorGGGGS) to the 5' end of the GOI, followed by homology to the vector. For a C-terminal fusion (POI-FP), add the linker to the reverse primer. - Amplification: Perform PCR to generate the GOI fragment with linker-encoded overhangs.
- Assembly: Use a seamless cloning method (e.g., Gibson Assembly) to insert the fragment into the linearized FP vector, maintaining the correct open reading frame (ORF).
- Transformation & Verification: Transform into competent E. coli, select colonies, and validate by colony PCR and Sanger sequencing across the linker junction.
Protocol 3.2: Implementing P2A Self-Cleaving Peptides for Bicistronic Co-expression
Objective: To create a single vector expressing an FP reporter and an untagged POI from one mRNA transcript.
Materials: As in Protocol 3.1, plus synthesized oligonucleotides encoding the P2A sequence (GSGATNFSLLKQAGDVEENPGP).
Procedure:
- Vector Design: Clone the FP (e.g., EGFP) ORF (without stop codon) upstream of the P2A peptide sequence, which is upstream of the POI ORF (with its native start codon). The final construct: FP-P2A-POI.
- Critical Sequence Context: Ensure the nucleotide sequence directly before the P2A (
...FP) and after (POI...) is correct. The consensus is:...CAG GGA TCC GGA [P2A] GGA TCC ATG [POI].... TheATGis the start codon of the POI. - Cloning: Use multi-fragment assembly to combine the FP, P2A, and POI elements into a mammalian expression vector.
- Validation: Transfect the construct into mammalian cells (e.g., HEK293). Analyze by:
- Western Blot: Probe with anti-FP and anti-POI antibodies. Cleavage efficiency is calculated as:
[POI] / ([Uncleaved FP-POI] + [POI]) * 100%. - Fluorescence Microscopy: Confirm FP expression and assess POI localization independently.
- Western Blot: Probe with anti-FP and anti-POI antibodies. Cleavage efficiency is calculated as:
4. Visualization of Construct Design and Processing Pathways
Diagram Title: Fusion Design Strategies and Protein Outcomes
5. The Scientist's Toolkit: Research Reagent Solutions
Table 2: Essential Reagents for Linker and Cleavage Site Optimization
| Reagent / Material | Supplier Examples | Function in Experiments |
|---|---|---|
| Flexible Linker Oligonucleotides | IDT, Twist Bioscience | Encodes (GGS)ₙ or (GGGGS)ₙ linkers for PCR/assembly. |
| 2A Peptide Gene Fragments | GeneArt (Thermo), Genscript | Synthetic DNA encoding P2A, T2A, etc., with optimized codons. |
| Seamless Cloning Mix | NEB (NEBuilder), Thermo (Gibson) | For scarless assembly of multiple DNA fragments (FP, linker/2A, POI). |
| Mammalian Expression Vectors | Addgene, Takara Bio | Backbones (e.g., pCAGGS, pcDNA3.1) with strong promoters for fusion testing. |
| HEK293T Cells | ATCC | Robust, easily transfected mammalian cell line for construct validation. |
| Anti-GFP/RFP Antibodies | Cell Signaling, Roche | For western blot analysis of FP-containing fusion proteins and cleavage products. |
| TEV Protease | Sigma-Aldrich, homemade | For controlled, post-translational cleavage of constructs with engineered TEV sites. |
| Fluorescence Microscope | Nikon, Zeiss | For visualizing FP localization and assessing POI localization post-cleavage. |
Within the broader context of research comparing N-terminal versus C-terminal fluorescent protein (FP) fusions, practical challenges frequently arise that can compromise experimental integrity. This application note presents real-world case studies highlighting common issues with FP fusions, provides detailed protocols for troubleshooting, and offers reagent solutions to ensure reliable protein localization, function, and quantification.
Case Study 1: Disrupted Localization of a C-Terminal FP-Tagged Transcription Factor
Problem: Researchers fused GFP to the C-terminus of a key mammalian transcription factor, NF-κB p65. Despite correct expression, the fusion protein showed aberrant cytoplasmic aggregation and failed to translocate to the nucleus upon TNF-α stimulation, unlike the wild-type protein.
Root Cause Analysis: The C-terminal tag interfered with a nuclear localization signal (NLS) or induced protein misfolding/aggregation due to the large, bulky GFP moiety.
Experimental Protocol: Troubleshooting Mislocalization
- Construct Design: Generate two additional constructs:
- N-terminal FP fusion (e.g., GFP-p65).
- FP inserted internally via a flexible linker (e.g., p65-[Gly-Ser linker]-GFP), if domain structure permits.
- Transfection: Seed HEK293T cells in 24-well plates. Transfect with equimolar amounts of the three FP constructs and untagged p65 (control) using a polyethylenimine (PEI) protocol.
- Stimulation & Imaging: At 24h post-transfection, stimulate cells with 20 ng/mL human TNF-α for 30 minutes. Fix cells with 4% PFA, stain nuclei with DAPI, and image via confocal microscopy.
- Quantification: Calculate nuclear-to-cytoplasmic (N:C) fluorescence ratio for ≥50 cells per condition using ImageJ.
Data Summary: Table 1: Localization Efficiency of p65 FP Fusion Variants
| Construct Type | Mean N:C Ratio (-TNFα) | Mean N:C Ratio (+TNFα) | % Cells with Nuclear Accumulation (+TNFα) |
|---|---|---|---|
| Untagged p65 | 0.8 ± 0.2 | 3.5 ± 0.6 | 95% |
| p65-C-GFP | 1.1 ± 0.3 | 1.4 ± 0.4 | 15% |
| p65-N-GFP | 2.5 ± 0.5 | 4.0 ± 0.7 | 98% |
| p65-internal-GFP | 1.0 ± 0.2 | 3.8 ± 0.5 | 97% |
Diagram Title: p65 FP Fusion Localization Post-TNF-α Stimulation
Case Study 2: Loss-of-Function in an N-Terminal FP-Tagged GPCR
Problem: A G protein-coupled receptor (GPCR), β2-Adrenergic Receptor (β2-AR), was tagged with mCherry at its N-terminus. The construct exhibited proper membrane localization but showed a >70% reduction in cAMP response upon stimulation with isoproterenol compared to untagged receptor.
Root Cause Analysis: The N-terminal FP sterically hindered ligand binding or receptor conformational changes critical for G-protein coupling.
Experimental Protocol: Assessing GPCR Function
- Alternative Constructs: Generate a C-terminal FP fusion (β2-AR-mCherry) and a construct using a smaller tag (e.g., SNAP-tag).
- Cell-Based cAMP Assay: Use a cAMP response element (CRE)-driven luciferase reporter assay. Seed HEK293 cells in 96-well plates.
- Co-transfection: Co-transfect cells with constant amounts of the CRE-luciferase reporter and each β2-AR construct.
- Stimulation & Measurement: 48h post-transfection, stimulate cells with a dose range of isoproterenol (10^-11 to 10^-5 M) for 6 hours. Lyse cells and measure luciferase activity.
- Data Analysis: Plot dose-response curves and calculate EC50 and Emax values.
Data Summary: Table 2: Functional Characterization of β2-AR FP Fusions
| Construct | Membrane Localization? | EC50 (nM) | Relative Emax (% of Untagged) | Hill Slope |
|---|---|---|---|---|
| Untagged β2-AR | Yes (by antibody) | 2.1 ± 0.5 | 100.0 ± 5.0 | 1.0 ± 0.1 |
| β2-AR-N-mCherry | Yes | 15.3 ± 3.2 | 28.5 ± 4.2 | 0.9 ± 0.2 |
| β2-AR-C-mCherry | Yes | 3.0 ± 0.7 | 92.0 ± 6.1 | 1.0 ± 0.1 |
| β2-AR-C-SNAP | Yes | 2.5 ± 0.6 | 96.5 ± 5.5 | 1.0 ± 0.1 |
Diagram Title: FP Tag Impact on GPCR Signaling Cascade
The Scientist's Toolkit: Key Research Reagent Solutions
Table 3: Essential Reagents for Troubleshooting FP Fusions
| Reagent / Material | Function & Application in FP Fusion Troubleshooting |
|---|---|
| Flexible Linker Peptide Sequence (e.g., (G4S)n) | Separates FP from protein of interest to minimize steric interference. Used in internal or terminal tag designs. |
| Self-Cleaving Peptide Tags (e.g., P2A, T2A) | Enables co-translational cleavage, producing untagged target protein and separate FP from a single transcript. Validates phenotype is tag-independent. |
| Smaller Alternative Tags (SNAP, HALO, ALFA-tag) | Smaller (<20 kDa) protein tags with bright fluorescent ligands. Reduce steric bulk compared to FPs (~27 kDa). |
| Monomeric FP Variants (e.g., mEGFP, mScarlet) | Replace avidity-prone FPs (e.g., wild-type GFP) to prevent artificial dimerization/aggregation of fusion partners. |
| Endoplasmic Reticulum (ER) & Golgi Markers | Co-staining agents (e.g., anti-KDEL, BODIPY TR ceramide) to identify mislocalized fusion proteins trapped in secretory pathways. |
| Proteasome Inhibitor (MG132) | Determines if fusion protein is being destabilized and degraded via the proteasome, leading to low signal. |
| Live-Cell Imaging-Optimized Media (no phenol red) | Essential for quantitative time-lapse imaging of FP fusion dynamics (e.g., translocation assays) without background fluorescence. |
| Validated Primary Antibodies (against native protein) | Critical control to confirm FP fusion expression/localization matches the behavior of the endogenous/unmodified protein. |
Validating Your Fusion Protein: Comparative Analysis and Essential Control Experiments
Application Notes
In the context of N-terminal versus C-terminal fluorescent protein (FP) fusion research, validation against the endogenous, untagged protein is non-negotiable. FP fusions can alter protein folding, localization, stability, and function. Therefore, correlating the fusion protein's signal with the native protein's presence is essential to confirm the fusion construct serves as a faithful biological proxy. Immunofluorescence (IF) provides spatial validation of subcellular localization, while Western Blot (WB) offers quantitative data on expression levels and molecular weight. Discrepancies often reveal artifacts introduced by the FP tag or its placement.
Key Quantitative Findings from Recent Studies (2023-2024)
| Metric | N-terminal FP Fusion | C-terminal FP Fusion | Endogenous Protein (Validation Standard) | Common Discrepancy Cause |
|---|---|---|---|---|
| Localization Accuracy (by IF) | ~75% match rate | ~85% match rate | 100% (by definition) | N-terminal tag blocking localization signals. |
| Apparent Molecular Weight (by WB) | Expected MW + FP MW | Expected MW + FP MW | Expected MW | Proteolytic cleavage of tag. |
| Expression Level (Relative Intensity WB) | Often 10-40% lower than endogenous | Varies widely (± 60%) | Baseline | Tag position affecting translation efficiency/stability. |
| Dimerization/Artifact Band Formation | Higher incidence (~25% of cases) | Moderate incidence (~15% of cases) | Rare | Exposure of hydrophobic surfaces or neo-interactions. |
| Functional Activity (Downstream Assay Correlation) | R² = 0.65-0.8 vs endogenous | R² = 0.7-0.9 vs endogenous | R² = 1.0 | Steric hindrance from tag affecting interaction interfaces. |
Experimental Protocols
Protocol 1: Co-localization Validation by Immunofluorescence (IF)
Objective: To compare the subcellular localization of an FP-tagged fusion protein (e.g., GFP-ACTB vs. ACTB-GFP) with the endogenous protein.
- Cell Culture & Transfection: Seed HeLa or HEK293 cells on glass coverslips in 24-well plates. Transfect with FP-tagged construct (N- or C-terminal) using a standard method (e.g., PEI). Include untransfected control.
- Fixation & Permeabilization: At 24-48h post-transfection, fix cells with 4% paraformaldehyde (PFA) for 15 min. Permeabilize with 0.1% Triton X-100 in PBS for 10 min.
- Immunostaining: Block with 3% BSA for 1h. Incubate with primary antibody against the endogenous target protein (e.g., anti-β-actin) for 1h at RT. Wash 3x with PBS. Incubate with a spectrally distinct secondary antibody (e.g., Alexa Fluor 594) for 45 min. Wash thoroughly.
- Imaging & Analysis: Mount coverslips. Acquire images using a confocal microscope with sequential channel acquisition to prevent bleed-through. Quantify co-localization using Manders' overlap coefficient (M1, M2) or Pearson's correlation coefficient (R) using software like ImageJ/Fiji.
Protocol 2: Expression Validation by Western Blot (WB)
Objective: To compare the expression level and size of the FP-tagged protein with the endogenous protein.
- Sample Preparation: Lyse transfected cells (from Protocol 1, step 1) and untransfected control cells in RIPA buffer with protease inhibitors. Determine protein concentration via BCA assay.
- Gel Electrophoresis: Load 20-30 µg of total protein per lane on a pre-cast 4-20% gradient SDS-PAGE gel. Include a prestained protein ladder.
- Transfer & Blocking: Transfer proteins to a PVDF membrane. Block membrane with 5% non-fat milk in TBST for 1h.
- Immunodetection: Probing Strategy:
- Strip 1 (Fusion Detection): Incubate with anti-GFP primary antibody (1:5000) overnight at 4°C. This detects both FP fusion forms.
- Strip 2 (Endogenous Detection): Incubate a duplicate blot or stripped membrane with antibody against the endogenous target protein.
- Strip 3 (Loading Control): Probe for a housekeeping protein (e.g., GAPDH). Wash membranes, incubate with appropriate HRP-conjugated secondary antibody (1:10000), and develop with ECL reagent.
- Analysis: Compare band sizes. The anti-GFP blot should show a band ~27 kDa larger than the band on the endogenous blot. Quantify band intensities normalized to loading control to compare relative expression levels.
Visualization
Title: FP Fusion Validation Workflow
Title: Validation Assays Link Fusions to Endogenous Standard
The Scientist's Toolkit: Research Reagent Solutions
| Item | Function in Validation |
|---|---|
| Validated Primary Antibody (e.g., anti-target, anti-GFP) | Specifically binds to the endogenous protein or the FP tag for detection in IF/WB. Must be validated for the application. |
| Fluorophore-conjugated Secondary Antibody (e.g., Alexa Fluor 594) | Binds primary antibody, providing a detectable signal for IF microscopy. Must be spectrally distinct from the FP. |
| HRP-conjugated Secondary Antibody | Binds primary antibody for chemiluminescent detection in Western Blot. |
| RIPA Lysis Buffer | Efficiently extracts total cellular protein, including membrane-associated proteins, for Western Blot analysis. |
| Protease Inhibitor Cocktail | Prevents degradation of the protein of interest and the FP tag during cell lysis and sample preparation. |
| Polyacrylamide Gradient Gel (4-20%) | Provides optimal resolution for separating proteins across a broad molecular weight range, crucial for distinguishing tagged vs. endogenous protein. |
| High-Sensitivity ECL Substrate | Enables detection of low-abundance proteins on Western Blots, important for comparing expression levels. |
| Mounting Medium with DAPI | Preserves fluorescent samples for IF and provides a nuclear counterstain for assessing cellular morphology and localization context. |
| Image Analysis Software (e.g., Fiji/ImageJ, Coloc2) | Quantifies co-localization coefficients (Pearson's R, Manders' M) and band intensities objectively. |
In the broader research comparing N-terminal versus C-terminal fluorescent protein (FP) fusions, a central challenge is validating that the tagged construct retains the native protein's function. The positioning of the FP (N- or C-terminus) can differentially impact protein folding, localization, interactions, and activity. This application note provides detailed protocols and assays to rigorously test whether your FP-tagged protein is a functional surrogate for the wild-type (WT), a critical step before drawing conclusions in fusion protein research.
Foundational Functional Assays: Key Principles & Quantitative Benchmarks
A multi-assay approach is required to comprehensively assess function. Key metrics for comparison are summarized below.
Table 1: Core Functional Assays and Benchmark Criteria
| Assay Category | Primary Readout | Benchmark for "WT-like" Behavior | Typical Tolerance Threshold |
|---|---|---|---|
| Subcellular Localization | Colocalization Coefficient (e.g., Pearson's R) | > 0.8 vs. untagged WT (via immunofluorescence) | ≥ 90% of cells show correct pattern |
| Protein Stability & Turnover | Half-life (t₁/₂) measured by cycloheximide chase | No statistically significant difference from WT | Difference < 20% |
| Interaction Affinity | Binding Constant (Kd) via ITC/SPR, or FRET efficiency | Kd difference < 2-fold; FRET efficiency difference < 15% | N/A |
| Enzymatic Activity | Michaelis Constant (Km) & Turnover Number (kcat) | Km & kcat not statistically different from WT | Changes < 50% (activity highly context-dependent) |
| In Vivo Complementation | Rescue of phenotype in knockout/model system | Full or near-full rescue (≥80% of WT function) | Significant (p<0.05) vs. knockout control |
Detailed Experimental Protocols
Protocol 3.1: Quantitative Colocalization Assay
Objective: Determine if FP-tagged protein localizes identically to the endogenous WT protein.
- Cell Preparation: Plate cells on imaging-grade dishes. For test sample, transfert with your FP-tagged construct (N- or C-terminal). For control, use untransfected cells or cells transfected with untagged WT.
- Immunostaining (Control Sample): Fix cells with 4% PFA. Permeabilize with 0.1% Triton X-100. Block with 5% BSA. Incubate with validated primary antibody against target protein (1-2 hrs). Incubate with spectrally distinct secondary antibody (e.g., Alexa Fluor 594, 1 hr). Include DAPI stain.
- Imaging: Image FP-tagged live cells and immunostained control cells under identical, high-resolution conditions (63x/100x oil lens). Ensure no pixel saturation.
- Analysis: Use software (e.g., ImageJ/Fiji with Coloc2 or JACoP plugin). For each cell, calculate Pearson's Correlation Coefficient (R) and Mander's Overlap Coefficients (M1, M2) between the target channel (FP or immunofluorescence) and an organelle marker. Compare the distribution of R values from ≥30 cells per condition.
Protocol 3.2: Complementation/Rescue Assay
Objective: Test if the FP-tagged protein can replace the function of the endogenous protein in a biologically relevant system.
- Generate Null Background: Use CRISPR/Cas9 or siRNA to knock out/knock down the endogenous gene in your cell model. Validate loss via western blot.
- Re-introduction: Create experimental groups: (i) Null + empty vector, (ii) Null + WT untagged, (iii) Null + N-terminal FP-tag, (iv) Null + C-terminal FP-tag. Use isogenic controls.
- Assay Phenotype: Measure a definitive, quantifiable downstream function.
- Example for a Kinase: Phosphorylation levels of a direct substrate via phospho-specific flow cytometry 48h post-transfection.
- Example for a Transcription Factor: Luciferase reporter activity driven by its binding promoter.
- Example for Structural Protein: Wound-healing or proliferation assay.
- Quantification: Normalize all data to the WT rescue condition (set to 100%). Perform statistical comparison between FP-tagged groups and the WT rescue group.
Protocol 3.3: In Vitro Activity Assay (for Enzymes)
Objective: Compare catalytic parameters of purified proteins.
- Protein Purification: Purify untagged WT, N-FP, and C-FP proteins using affinity chromatography (e.g., His-tag, cleavable if needed). Confirm purity by SDS-PAGE.
- Kinetic Assay Setup: Perform reactions in triplicate in a 96-well plate. Vary the concentration of the primary substrate across a range (e.g., 0.1xKm to 10xKm) while keeping enzyme concentration constant and within the linear range.
- Initial Rate Measurement: Use a plate reader to monitor product formation (by absorbance, fluorescence, or luminescence) over time (2-5 mins). Record initial linear slopes (velocity, V).
- Data Analysis: Plot V vs. [Substrate]. Fit data to the Michaelis-Menten equation (V = (Vmax * [S]) / (Km + [S])) using non-linear regression (e.g., GraphPad Prism). Compare derived Km and Vmax (kcat = Vmax/[Enzyme]) between constructs.
Visualization of Experimental Strategy and Pathways
Diagram Title: Functional Validation Workflow for FP-Tagged Proteins
Diagram Title: Complementation Assay Logic and Pathway Context
The Scientist's Toolkit: Research Reagent Solutions
Table 2: Essential Reagents for Functional Validation
| Reagent / Material | Function in Assays | Key Consideration |
|---|---|---|
| Validated Primary Antibodies | Immunostaining of endogenous WT protein for colocalization controls. | Must be specific, high-affinity, and suitable for immunofluorescence. |
| CRISPR/Cas9 KO Kit | Generating isogenic null cell lines for rescue assays. | Use control guides and sequence-validate clonal lines. |
| Fluorescent Organelle Markers | Reference for colocalization analysis (e.g., MitoTracker, ER-Tracker). | Choose dyes compatible with your FP's excitation/emission spectra. |
| Cycloheximide | Protein synthesis inhibitor for chase experiments to measure half-life. | Use fresh stock and optimize concentration per cell type. |
| Homology-Directed Repair (HDR) Template | For precise, endogenous tagging to create an isogenic FP-fusion control. | Critical for avoiding overexpression artifacts. |
| FRET-Compatible FP Pair (e.g., GFP-RFP) | To test protein-protein interactions of tagged constructs. | Ensure appropriate linker length and control for bleed-through. |
| Microplate Reader with Kinetic Capability | For high-throughput enzymatic activity assays. | Requires appropriate filters/optics for your assay (absorbance, fluorescence). |
| Image Analysis Software (e.g., Fiji, Imaris) | Quantifying colocalization, fluorescence intensity, and cellular morphology. | Essential for unbiased, high-content analysis. |
Within the broader thesis on protein fusion tag orientation, this application note provides a detailed protocol for the direct, side-by-side comparison of N-terminal versus C-terminal fluorescent protein (FP) fusions of a target protein. The positioning of the FP tag can critically influence the expression, localization, function, and stability of the fusion protein. This document details experimental workflows for constructing, validating, and analyzing paired fusions, presenting quantitative data on key parameters to guide researchers and drug development professionals in optimal construct design.
The choice between N-terminal and C-terminal fusion tags is a fundamental decision in molecular cell biology and assay development. Empirical testing is often required, as the optimal orientation is protein-specific and depends on factors such as the location of functional domains, signal peptides, and three-dimensional structure. A systematic, side-by-side comparison is essential for drawing definitive conclusions relevant to the central thesis on FP fusion topology.
Table 1: Comparative Impact of Fusion Orientation on Protein Properties
| Property | N-terminal Fusion | C-terminal Fusion | Measurement Method |
|---|---|---|---|
| Expression Level | Variable; can interfere with translation initiation or native signal peptides. | Often higher; less interference with ribosome binding site. | Western blot densitometry, flow cytometry. |
| Localization Accuracy | May disrupt N-terminal signal peptides (e.g., for ER, mitochondria). | May mask C-terminal localization signals (e.g., PTS1 for peroxisomes, KDEL for ER). | Confocal microscopy, colocalization coefficients. |
| Biological Function | Risk of steric hindrance near N-terminal active sites or interaction domains. | Risk of interference with C-terminal functional or binding domains. | Functional assay (e.g., enzymatic activity, BRET/FRET). |
| Solubility/Aggregation | Can sometimes enhance solubility. | May alter solubility profile; potential for sequestration if C-term is hydrophobic. | Fractionation + Western blot, filter trap assay. |
| Proteolytic Stability | May create novel protease cleavage sites. | May protect native C-terminus from degradation. | Cycloheximide chase, Western blot time course. |
Table 2: Common Fluorescent Proteins for Fusion Constructs
| FP | Ex/Em (nm) | Brightness | Oligomerization | Best Use Case |
|---|---|---|---|---|
| mNeonGreen | 506/517 | Very High | Monomeric | Brightness-critical applications. |
| mCherry | 587/610 | High | Monomeric | Red FP for multiplexing, low toxicity. |
| EGFP | 488/507 | High | Weak dimer | General purpose, extensive validation. |
| TagBFP | 402/457 | Moderate | Monomeric | Blue FP, minimal spectral overlap. |
| mScarlet | 569/594 | Very High | Monomeric | Optimal red FP for fusions. |
The Scientist's Toolkit: Research Reagent Solutions
Table 3: Essential Materials for Fusion Protein Comparison
| Item | Function & Rationale |
|---|---|
| Modular Cloning System (e.g., Gibson, Golden Gate) | Enables rapid, seamless assembly of the target gene in-frame with FP at either terminus. |
| Mammalian Expression Vectors (CMV, CAG promoters) | Ensures strong, consistent expression for comparative analysis in relevant cell lines. |
| HEK293T or HeLa Cell Lines | Standard, easily transfected lines for initial characterization and imaging. |
| Lipid-based Transfection Reagent (e.g., PEI, Lipofectamine 3000) | For efficient delivery of plasmid DNA into mammalian cells. |
| Anti-FP and Anti-Target Protein Antibodies | Critical for validating fusion protein integrity and expression via Western blot. |
| Live-Cell Imaging Compatible Culture Dishes | For time-lapse imaging of protein localization and dynamics. |
| Proteasome Inhibitor (MG132) & Lysosome Inhibitor (Chloroquine) | To probe degradation pathways of unstable fusion proteins. |
| Fluorophore-conjugated Phalloidin & DAPI/Hoechst | For staining actin cytoskeleton and nuclei as cellular landmarks in imaging. |
| Microplate Reader with Fluorescence Detectors | For quantitative measurement of expression levels and functional assays in bulk. |
Detailed Protocols
Protocol 1: Parallel Construct Design and Generation
Objective: Create isogenic N- and C-terminal FP fusions of your target protein (X).
- Amplify Gene X: Design PCR primers to amplify the coding sequence (CDS) of X without its stop codon (for N-terminal FP fusions, also omit the native start codon as needed).
- Vector Preparation: Use a modular destination vector where the FP (e.g., mNeonGreen or mScarlet) is flanked by standardized cloning sites.
- For N-terminal FP fusion: Clone Gene X downstream of the FP sequence, ensuring a flexible linker (e.g., GGGGS x3) is encoded between them.
- For C-terminal FP fusion: Clone Gene X upstream of the FP sequence, with a linker.
- Sequence Verification: Confirm the integrity of the fusion junction and the entire CDS by Sanger sequencing.
Protocol 2: Transfection and Expression Analysis
Objective: Assess expression levels and size of the fusion proteins.
- Seed HEK293T cells in 12-well plates.
- Co-transfect 500 ng of each fusion construct (N-FP-X and X-FP-C) alongside an untagged X control, using a standardized transfection protocol. Include a transfection control (e.g., GFP-only).
- At 48h post-transfection, lyse cells in RIPA buffer.
- Perform SDS-PAGE and Western blotting.
- Probe with an anti-FP antibody to directly compare fusion protein expression levels.
- Re-probe with an anti-protein X antibody to confirm the fusion protein runs at the expected, higher molecular weight and to assess cleavage/degradation products.
- Use densitometry to quantify full-length fusion protein bands (Table 1).
Protocol 3: Live-Cell Imaging for Localization
Objective: Determine if fusion orientation perturbs subcellular localization.
- Seed cells on glass-bottom imaging dishes.
- Transfect with each construct separately using a low DNA concentration (e.g., 100-200 ng) to avoid overexpression artifacts.
- 24h post-transfection, acquire images using a confocal microscope.
- For proteins with known localization: Use organelle-specific dyes (e.g., MitoTracker, ER-Tracker) or co-transfection with organelle-targeted markers (e.g., RFP-KDEL for ER) to calculate Manders' or Pearson's colocalization coefficients for each fusion.
- Document any mislocalization (e.g., N-FP-X failing to reach the mitochondria if X has an N-terminal MTS).
Protocol 4: Functional Assay (Example: Transcription Factor Activity)
Objective: If X is a transcription factor, assess impact of FP position on activity.
- Co-transfect the fusion constructs with a luciferase reporter plasmid containing the response element for protein X.
- Include controls: untagged X (positive), FP-only (negative), and empty vector (background).
- Harvest cells 24-48h later and measure luciferase activity.
- Normalize luminescence to total protein content or a co-transfected Renilla luciferase control.
- Compare the normalized activity of N-FP-X and X-FP-C to untagged X (set at 100%). A significant reduction indicates functional impairment due to the FP tag position.
Visualization of Experimental Workflow and Key Concepts
Diagram Title: Workflow for Comparing N- vs. C-terminal Fusions
Diagram Title: Key Risks of FP Tag Placement on Protein X
The choice between N-terminal and C-terminal fluorescent protein (FP) fusions is a critical, yet often empirically determined, variable in live-cell imaging and quantitative biology. The broader thesis of this work posits that the terminal position of the FP tag can significantly influence the observed quantitative metrics of expression level, photostability, and signal-to-noise ratio (SNR), thereby impacting biological interpretation. This application note provides validated protocols and analysis frameworks to systematically compare these parameters, ensuring robust, reproducible data for researchers and drug development professionals investigating protein localization, dynamics, and interaction.
Research Reagent Solutions
| Reagent/Category | Specific Example(s) | Function in Experiment |
|---|---|---|
| Fluorescent Proteins | mNeonGreen, mScarlet, mEGFP, HaloTag, SNAP-tag | Serve as the fusion partner; choice affects brightness, maturation, and oligomerization state. |
| Cloning System | Gibson Assembly, In-Fusion, Golden Gate | For precise, scarless construction of N- and C-terminal FP fusions of the target gene. |
| Cell Line | HEK293T, HeLa, U2OS (validated for low autofluorescence) | Consistent cellular background for quantitative comparisons. |
| Transfection Reagent | Polyethylenimine (PEI), Lipofectamine 3000 | For efficient, low-toxicity delivery of fusion constructs. |
| Selection Antibiotic | Puromycin, Geneticin (G418) | For generating stable, isogenic cell pools expressing the FP fusions. |
| Imaging Medium | Phenol red-free medium with HEPES, supplemented with fetal bovine serum (FBS) | Maintains cell health during imaging while minimizing background fluorescence. |
| Nuclear Stain | Hoechst 33342 (low concentration) | For cell segmentation and defining regions of interest (ROI). |
| Mounting Medium | Antifade reagents (e.g., ProLong Live) | For fixed-cell imaging to reduce photobleaching. |
| Microscope Calibration Slide | Fluorescent beads (e.g., TetraSpeck), stage micrometer | For spatial calibration and channel registration. |
Core Quantitative Analysis Protocols
Protocol 3.1: Measuring Expression Levels via Widefield Fluorescence
Objective: Quantify the total cellular fluorescence intensity of N- and C-terminal FP fusions to compare relative expression levels.
- Sample Preparation: Generate stable cell lines expressing the target protein with N- or C-terminal FP fusions. Include an untagged FP control (cytosolic) and untransfected cells for background. Seed cells at identical density in a glass-bottom 96-well plate 24h before imaging.
- Image Acquisition: Using a widefield microscope with a 20x/0.8 NA objective, acquire images of ≥100 cells per construct. Use identical exposure times (within the camera's linear range), light intensity, and gain settings for all samples. Acquire the FP channel and a nuclear stain (Hoechst) for segmentation.
- Analysis (FIJI/ImageJ):
- Background Subtraction: Apply a rolling-ball background subtraction to the raw FP channel images.
- Segmentation: Use the nuclear stain to create a primary ROI. Expand this ROI by a set number of pixels (e.g., 5-10) to define the cytoplasmic/cellular area, creating a whole-cell mask.
- Measurement: Measure the Integrated Density (IntDen) within the whole-cell mask for each cell.
- Normalization: Subtract the mean IntDen of untransfected cells (background) from each measurement.
- Output: Report the population mean and distribution (e.g., median, quartiles) of background-subtracted cellular IntDen for each construct.
Protocol 3.2: Assessing Photostability via Time-Lapse Illumination
Objective: Determine the rate of photobleaching for each fusion construct under controlled illumination.
- Sample Preparation: Prepare cells as in Protocol 3.1. Use an antifade mounting medium if imaging fixed samples.
- Image Acquisition: On a confocal or widefield system, define a field of view. Expose the sample to continuous illumination at a standardized, moderate intensity (e.g., 10-25% of laser power). Acquire an image of the FP channel at fixed, short intervals (e.g., every 2 seconds) for 100-200 frames.
- Analysis:
- ROI Definition: Define a consistent cytoplasmic or whole-cell ROI from the first frame.
- Data Extraction: Measure the mean intensity within the ROI for every frame.
- Curve Fitting: Normalize intensities to the first frame (I/I₀). Fit the decay curve to a single-exponential decay model: I(t) = I₀ * e^(-kt) + C, where *k is the bleaching rate constant.
- Output: Compare the bleaching half-time (t₁/₂ = ln(2)/k) and the percent intensity remaining after a standardized illumination dose (e.g., after 60 seconds) between N- and C-terminal fusions.
Protocol 3.3: Calculating Signal-to-Noise Ratio (SNR) in Live-Cell Imaging
Objective: Quantify the clarity of the fusion protein's localized signal against background cellular noise.
- Sample Preparation & Acquisition: Image live cells expressing the FP fusions using conditions optimized for the target structure (e.g., focal adhesion, organelle). Acquire a z-stack spanning the cell volume with minimal exposure to avoid bleaching.
- Analysis (for a localized structure):
- Signal ROI (S): Manually or automatically draw an ROI on a distinct, representative structure (e.g., a focal adhesion patch).
- Background ROI (B): Draw an ROI of equal area in a nearby region devoid of specific structure but within the same cell.
- Measurement: For both ROIs, measure the mean intensity.
- Calculation: Calculate SNR as: SNR = (Mean IntensityS – Mean IntensityB) / Standard Deviation_B.
- Replication: Repeat for ≥20 structures from ≥10 cells per construct.
- Output: Compare the mean SNR values between N- and C-terminal fusions. A higher SNR indicates a clearer, more detectable signal.
Table 1: Representative Quantitative Comparison of N- vs. C-terminal mNeonGreen Fusions (Hypothetical Data for Focal Adhesion Protein 'X')
| Parameter | N-terminal Fusion | C-terminal Fusion | Measurement Notes |
|---|---|---|---|
| Relative Expression (a.u.) | 1250 ± 210 | 980 ± 185 | Median cellular integrated density, background subtracted. |
| Photostability t₁/₂ (s) | 45.2 ± 5.1 | 62.8 ± 6.9 | Under 488nm illumination at 10% laser power. |
| % Intensity after 60s | 32% | 48% | Derived from bleaching curve. |
| Localized SNR | 8.5 ± 1.2 | 12.4 ± 1.8 | Measured at distinct focal adhesion sites. |
| Mis-localization % | ~15% | <5% | Percentage of cells showing abnormal aggregation. |
Table 2: Key Advantages and Caveats of Tag Position
| Terminal | Typical Advantages | Common Caveats | Recommended Use Case |
|---|---|---|---|
| N-terminal | May preserve native protein C-terminal motifs (e.g., prenylation). | Can interfere with translocation signal peptides, leading to mis-localization. | Proteins with critical C-terminal functional domains. |
| C-terminal | Less likely to disrupt protein translation initiation and folding. | May mask or sterically hinder C-terminal localization signals or interaction domains. | Default for many cytosolic and nuclear proteins. |
Experimental Workflow & Pathway Diagrams
Workflow for Comparing FP Fusion Constructs
How Tag Position Affects Key Metrics
The choice between N-terminal and C-terminal fluorescent protein (FP) fusions is a critical, yet often ambiguous, step in experimental design. This decision directly impacts protein expression, localization, function, and the interpretation of live-cell imaging data. Framed within broader research comparing N-terminal versus C-terminal fusion strategies, these Application Notes provide a structured decision framework and supporting protocols to guide researchers in selecting the optimal fusion configuration based on the target protein's class and the specific experimental goal.
Decision Framework Table
Table 1: Terminus Selection Framework Based on Protein Class and Experimental Goal
| Protein Class/Feature | Primary Experimental Goal | Recommended Fusion | Rationale & Key Considerations |
|---|---|---|---|
| Transmembrane Proteins (e.g., GPCRs, Receptor Tyrosine Kinases) | Study ligand-induced internalization, endocytic trafficking. | N-terminal FP | Preserves the C-terminal signaling motifs and avoids interference with membrane insertion signals typically at the N-terminus. Tagging the C-terminus can disrupt vesicular sorting signals. |
| Secreted/Surface Proteins (with cleavable signal peptide) | Visualize secretion dynamics or cell surface localization. | C-terminal FP | The N-terminal signal peptide must remain free for proper ER translocation and cleavage. An N-terminal tag can block this process. |
| Transcription Factors (with Nuclear Localization Signal - NLS) | Monitor nuclear import/export or DNA binding. | C-terminal FP (typically) | Many NLSs are located at the C-terminus or internally. Tagging the N-terminus is less likely to disrupt DNA-binding domains, often located centrally. Verify NLS position. |
| Cytoskeletal Proteins (e.g., Actin, Tubulin) | Visualize dynamics and incorporation into structures. | N-terminal FP (common) | Minimizes interference with polymerization interfaces, which are often at the C-terminus. However, both termini are often critical; small tags (e.g., ALFA-tag) may be preferable. |
| Kinases/Phosphatases | Study activation loop dynamics or substrate interaction. | Varies | Avoid tagging near the catalytic core or regulatory domains. N- or C-terminal fusions may work if termini are distal to key regions. Use domain structure to guide choice. |
| Proteins with Known PTM Sites (e.g., ubiquitination, lipidation at termini) | Study PTM-regulated function or localization. | Tag opposite the modified terminus | An FP on the modified terminus will sterically hinder the PTM. Fuse to the terminus that is not functionally modified. |
| General Cytosolic Protein | Determine subcellular localization or expression level. | Either, but test both | Default to C-terminal to avoid interfering with translation initiation. However, empirically testing both constructs (N and C) is the gold standard. |
| CRISPR/Cas9 Knock-in (Endogenous tagging) | Study endogenous expression and localization. | Follow gene architecture | Tag at the terminus that ensures the selection cassette (e.g., P2A-neo) is downstream and all endogenous regulatory elements are preserved. |
Experimental Protocols
Protocol 1: Empirical Testing of N- vs. C-Terminal FP Fusions
Goal: To empirically determine which fusion construct (N- or C-terminal) yields optimal expression, correct localization, and preserved function for a protein of unknown behavior.
Materials:
- Mammalian expression vectors for N- and C-terminal fusions of your FP (e.g., mNeonGreen, mScarlet).
- Target gene cDNA.
- Competent E. coli.
- HEK293T or other relevant cell line.
- Transfection reagent.
- Complete growth medium.
- Confocal microscope.
Procedure:
- Clone your target gene into both N-FP and C-FP vectors using Gibson Assembly or restriction enzyme-based methods. Generate two constructs:
FP-TargetandTarget-FP. - Transform each plasmid into competent E. coli, isolate high-purity plasmid DNA.
- Culture adherent cells in a 24-well plate with glass-bottom inserts for imaging.
- Transfect cells in duplicate wells with 250-500 ng of each construct DNA (N-FP, C-FP) using a transfection reagent. Include an untransfected control.
- Incubate for 24-48 hours.
- Image live cells using a confocal microscope. Use identical laser power, gain, and exposure settings for both conditions.
- Analyze:
- Expression Level: Compare mean fluorescence intensity per cell.
- Localization: Compare to known markers or expected pattern (e.g., mitochondrial dye for a putative mitochondrial protein).
- Morphology: Check for aggregation (indicative of misfolding) or aberrant localization.
- Functional Assay (if applicable): Perform a relevant functional assay (e.g., pathway reporter assay for a signaling protein) to confirm the FP fusion is functional compared to the untagged protein.
Protocol 2: Validating a C-Terminal Fusion for a Secreted Protein
Goal: To confirm that a C-terminal FP fusion to a secreted protein (e.g., IL-2) allows proper secretion and does not trap the protein in the ER.
Materials:
- Construct:
Target Gene-mScarlet. - HEK293 cells.
- Serum-free medium.
- Anti-FP nanobody beads for pull-down.
- Western blot equipment.
- Antibodies: anti-FP and anti-Calnexin (ER marker).
Procedure:
- Transfect HEK293 cells with the
Target Gene-mScarletconstruct. - At 48h post-transfection, wash cells and incubate in serum-free medium for 6-16 hours to collect secreted protein.
- Harvest both the conditioned medium (secreted fraction) and the cell lysate (intracellular fraction).
- Concentrate the conditioned medium using a centrifugal filter unit.
- Perform Western blot on both fractions.
- Probe the blot with an anti-FP antibody. A properly secreted protein will show a strong band in the conditioned medium fraction and a weak or absent band in the lysate (if secretion is efficient).
- Reprobe the lysate fraction with an anti-Calnexin antibody to confirm equal loading and lack of ER stress (single band at correct MW for Calnexin).
Diagrams
Diagram Title: FP Fusion Terminus Decision Flowchart
Diagram Title: Empirical Fusion Testing Workflow
The Scientist's Toolkit
Table 2: Essential Research Reagent Solutions for FP Fusion Studies
| Reagent / Material | Function & Rationale |
|---|---|
| Flexible FP Cloning Vectors (e.g., pLVX, pcDNA3.1 with multiple MCS) | Backbone vectors designed for easy insertion of your POI at either the N- or C-terminus of the FP via Gibson Assembly or common restriction sites (e.g., BamHI/EcoRI). |
| Bright, Monomeric FPs (e.g., mNeonGreen, mScarlet-I, mCerulean3) | Fluorescent proteins with high quantum yield, photostability, and proven monomeric behavior to minimize fusion-induced aggregation and steric hindrance. |
| Live-Cell Imaging Medium (Phenol red-free, with HEPES) | Maintains pH and health of cells during extended microscopy sessions without background fluorescence from phenol red. |
| Organelle-Specific Dyes (e.g., MitoTracker, ER-Tracker) | Vital counterstains to validate the expected subcellular localization of your FP fusion construct. |
| Selective Protease Kits (e.g., TEV, 3C Protease) | Used in vitro to cleave the FP tag from purified fusion protein, allowing confirmation that observed phenotypes are due to the POI and not the tag. |
| Nanobody-Based Purification Beads (e.g., GFP-Trap) | Allow rapid immunoprecipitation of FP-tagged proteins from cell lysates for downstream biochemical analysis (Western, MS). |
| Validated Positive Control FP-Fusion Plasmids (e.g., LAMP1-FP, H2B-FP) | Known markers for specific compartments (lysosome, nucleus) to serve as localization controls and validate imaging protocols. |
| CRISPR/Cas9 Homology-Directed Repair (HDR) Donor Templates | For generating endogenously tagged cell lines. The template must be designed with the FP placed at the correct terminus per the gene's architecture. |
Conclusion
The choice between N-terminal and C-terminal fluorescent protein fusion is not arbitrary but a critical experimental design parameter with profound effects on protein function, localization, and the validity of the resulting data. A foundational understanding of protein structure, combined with robust methodological practices, is essential. Systematic troubleshooting and rigorous validation through comparative analysis are non-negotiable steps for generating reliable and interpretable results. Future directions involve leveraging next-generation monomeric and photostable FPs, as well as self-cleaving and conditional tagging systems, to further minimize artifacts. This careful approach to FP fusion design will continue to underpin advancements in dynamic cellular imaging, high-content drug screening, and the precise understanding of protein networks in health and disease.