Tracking Stem Cells in Living Animals: How NIR-II Quantum Dots Revolutionize In Vivo Imaging
This article provides a comprehensive guide for researchers on using second near-infrared window (NIR-II) quantum dots for non-invasive, long-term tracking of stem cells in vivo.
Tracking Stem Cells in Living Animals: How NIR-II Quantum Dots Revolutionize In Vivo Imaging
Abstract
This article provides a comprehensive guide for researchers on using second near-infrared window (NIR-II) quantum dots for non-invasive, long-term tracking of stem cells in vivo. We cover the fundamental photophysics of NIR-II QDs that enable deep-tissue imaging, detailed protocols for stem cell labeling and administration, strategies to overcome common challenges like quenching and toxicity, and rigorous validation methods comparing NIR-II QDs to traditional fluorophores. The content synthesizes the latest research to empower scientists in implementing this cutting-edge technology for regenerative medicine and drug development applications.
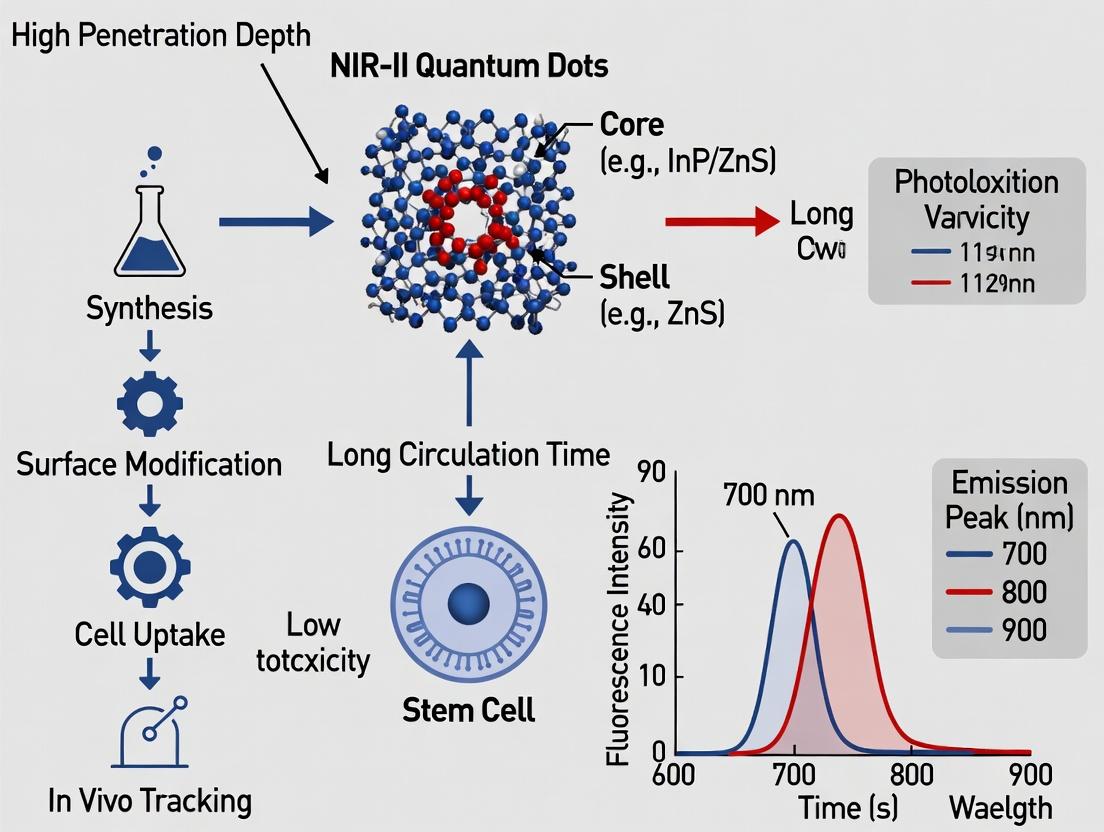
What Are NIR-II Quantum Dots? The Science Behind Deep-Tissue Stem Cell Imaging
Within the broader thesis on employing NIR-II-emitting quantum dots (QDs) for longitudinal stem cell tracking, defining the optimal imaging window is foundational. This application note details the biophysical rationale for the 1000-1700 nm NIR-II window, supported by quantitative data on tissue optical properties, and provides protocols for validating NIR-II probes in stem cell imaging contexts.
The Biophysical Basis of the NIR-II Window
Biological tissue exhibits distinct scattering and absorption properties across the near-infrared spectrum. The key advantage of the 1000-1700 nm region, particularly the 1500-1700 nm sub-window, lies in significantly reduced photon scattering and minimized autofluorescence compared to the traditional NIR-I (700-900 nm) window.
Quantitative Comparison of Tissue Optical Properties
Table 1: Optical Properties of Biological Tissue Across Spectral Windows
| Parameter | NIR-I (750-900 nm) | NIR-IIa (1000-1300 nm) | NIR-IIb (1500-1700 nm) |
|---|---|---|---|
| Scattering Coefficient (μs') | ~0.7-1.0 mm⁻¹ | ~0.3-0.5 mm⁻¹ | ~0.1-0.2 mm⁻¹ |
| Water Absorption | Low | Moderate | Higher (Peak) |
| Hemoglobin Absorption | High (Oxy/Deoxy) | Very Low | Very Low |
| Tissue Autofluorescence | High | Negligible | None |
| Typical Penetration Depth | 1-3 mm | 3-8 mm | 5-12 mm |
| Photon Toxicity Risk | Moderate | Low | Very Low |
Data synthesized from recent studies on murine and porcine tissue models (2023-2024).
The reduced scattering in NIR-IIb allows photons to travel along straighter paths, dramatically improving spatial resolution (often < 10 µm in vivo) and signal-to-background ratio (SBR). While water absorption increases beyond 1400 nm, this can be leveraged for high-contrast imaging by suppressing background signal from shallow tissues.
Research Reagent Solutions for NIR-II Stem Cell Tracking
Table 2: Essential Toolkit for NIR-II QD Stem Cell Labeling & Imaging
| Item | Function & Rationale |
|---|---|
| PbS/CdS Core/Shell QDs (λem=1550 nm) | Bright, photostable NIR-IIb fluorophore; superior SBR for deep-tissue tracking. |
| PEG-Phospholipid Encapsulation Kit | Renders QDs water-soluble, biocompatible, and provides functional groups (-COOH, -NH2) for bioconjugation. |
| Stem Cell-Specific Targeting Ligand (e.g., CDy5 aptamer) | For direct, specific labeling of stem cell surface markers, minimizing non-specific uptake. |
| Membrane Staining Dye (DiR analog) | To validate QD labeling efficiency and cell viability via co-localization in NIR-I. |
| Matrigel Matrix | For subcutaneously implanting labeled stem cells to simulate a tissue environment. |
| NIR-II In Vivo Imager (InGaAs Camera) | Cooled, scientific-grade camera with sensitivity out to 1700 nm. Essential for detection. |
| Spectral Filters (1300 nm LP, 1500 nm BP) | Isolate the NIR-IIb emission, removing unwanted shorter-wavelength light. |
Experimental Protocols
Protocol 1: Synthesis & Bioconjugation of NIR-II QDs for Stem Cell Labeling
Objective: Produce biocompatible QDs conjugated to a stem cell-targeting moiety.
- QD Synthesis: Synthesize PbS/CdS core/shell QDs using the hot-injection method. Tune emission to 1550 nm by controlling core size (~5.5 nm).
- Ligand Exchange: Purify QDs and replace oleic acid ligands with PEG-Phospholipids (DSPE-PEG-COOH) via vortex-sonication in chloroform, followed by solvent evaporation and resuspension in PBS.
- Bioconjugation: Activate QD-COOH with EDC/sulfo-NHS for 15 min. Purify via centrifugal filter (100kDa MWCO). Incubate with amino-modified CDy5 aptamer (1:5 molar ratio) in 0.01 M borate buffer (pH 8.5) for 2 hrs at RT. Purify conjugate to remove free aptamers.
- Characterization: Verify conjugation via agarose gel shift assay. Measure hydrodynamic diameter (DLS) and confirm photoluminescence quantum yield (PLQY) using IR-26 dye in DCM as reference (PLQY ~8-12%).
Protocol 2: In Vitro Labeling & Viability Assay of Mesenchymal Stem Cells (MSCs)
Objective: Label MSCs with targeted QDs and assess labeling efficiency and cytotoxicity.
- Cell Culture: Culture human MSCs in α-MEM complete medium.
- Labeling: Incubate MSCs (80% confluent) with 50 nM QD-Aptamer conjugate in serum-free medium for 1 hr at 37°C. Include controls: untargeted QD-PEG, free aptamer.
- Washing: Wash cells 3x with PBS to remove unbound QDs.
- Efficiency Check: Image cells under NIR-II microscope (1300 nm LP filter). Quantify mean fluorescence per cell using ImageJ. Counterstain membrane with DiR dye for co-localization check in NIR-I channel.
- Viability Assay: Perform CCK-8 assay 24 hrs post-labeling. Compare absorbance (450 nm) of labeled vs. unlabeled control wells. Acceptable viability is >90%.
Protocol 3: In Vivo Imaging of QD-Labeled Stem Cells in a Murine Hind Limb Model
Objective: Track injected stem cells in deep tissue with high spatial resolution.
- Animal Preparation: Anesthetize NU/NU mouse with isoflurane (2% in O2). Depilate hind limb region.
- Cell Preparation & Injection: Trypsinize labeled MSCs (from Protocol 2). Resuspend 2x10^5 cells in 20 µL of PBS:Matrigel (1:1). Load into a chilled 29-gauge insulin syringe.
- Implantation: Inject cell suspension intramuscularly into the mouse hind limb. Inject control limb with unlabeled cells.
- NIR-II Imaging: Place mouse on heated stage of InGaAs camera system. Use 980 nm laser (50 mW/cm²) for excitation. Collect emission using a 1500 nm bandpass filter (1500/100 nm). Acquire images with 100 ms exposure for 5 mins post-injection (time-zero).
- Longitudinal Tracking: Image animals at 0, 24, 48, and 168 hrs post-injection using identical imaging parameters.
- Data Analysis: Draw regions of interest (ROI) around the injection site and a contralateral background ROI. Calculate SBR as (Mean Signal ROI - Mean Background ROI) / Std. Dev. Background. Plot signal decay over time to assess cell retention.
Visualizations
Title: NIR-I vs NIR-II Light Interaction with Tissue
Title: Logical Workflow for NIR-II QD Stem Cell Tracking Thesis
Within the broader thesis on developing advanced in vivo tracking probes for stem cell therapy research, this document details the fundamental principles of NIR-II-emitting quantum dots (QDs). Their unique optical properties, particularly emission in the second near-infrared window (NIR-II, 1000-1700 nm), enable deeper tissue penetration and higher spatial resolution for longitudinal stem cell tracking compared to visible or NIR-I probes.
Core Fundamentals: Composition & Structure
Composition
NIR-II QDs are typically composed of a core, a shell, and a surface ligand layer.
- Core: Determines the primary optical properties. Common compositions for NIR-II emission include:
- Ag₂S / Ag₂Se: Low toxicity, direct bandgap semiconductors.
- PbS / PbSe: High quantum yield, broad tunability.
- InAs / InSb: High performance, requires thick shells for stability.
- CuInSe₂ / AgInSe₂: Ternary alloys, reduced heavy metal content.
- Shell: A wider bandgap semiconductor (e.g., ZnS, CdS) passivates the core, reducing surface defects and enhancing photoluminescence quantum yield (PLQY) and stability.
- Ligands: Organic molecules (e.g., PEG, DSPE, polymers) coat the surface, determining solubility, biocompatibility, and conjugation potential for targeting stem cells.
Quantum Confinement & Structure
The emission wavelength is dictated by the core's bandgap, which is size-tunable due to the quantum confinement effect. Smaller dots have a larger bandgap and emit at shorter wavelengths; larger dots emit at longer NIR-II wavelengths.
Table 1: Common NIR-II QD Compositions and Properties
| Core Material | Typical Emission Range (nm) | Approx. PLQY (%) | Key Advantages | Considerations for In Vivo Tracking |
|---|---|---|---|---|
| Ag₂S | 1050 - 1300 | 5 - 15 | Low toxicity, good biocompatibility | Moderate brightness, requires optimization for cell labeling. |
| PbS | 1000 - 1600 | 10 - 50 | High brightness, excellent tunability | Pb content raises toxicity concerns; requires robust encapsulation. |
| InAs | 1200 - 1550 | 20 - 40 | High performance, narrow emission | Requires thick shell (e.g., ZnS/ZnSe), complex synthesis. |
| CuInSe₂ | 950 - 1300 | 10 - 25 | Reduced heavy metals, tunable | Synthesis control for reproducibility can be challenging. |
NIR-II Emission Mechanisms
The photoluminescence in QDs arises from the radiative recombination of an exciton (electron-hole pair).
- Photoexcitation: A photon with energy greater than the bandgap excites an electron from the valence band (VB) to the conduction band (CB).
- Relaxation: The excited electron relaxes to the lowest energy state in the CB.
- Radiative Recombination: The electron recombines with the hole in the VB, emitting a photon (NIR-II light). The energy (wavelength) of this photon is determined by the effective bandgap. Non-radiative recombination via surface traps is the main competitor, highlighting the critical need for effective shelling and passivation.
Diagram Title: NIR-II QD Emission & Loss Pathways
Application Notes for Stem Cell Labeling & Tracking
Key Considerations forIn VivoResearch
- Biocompatibility & Toxicity: Shell integrity and ligand coating are paramount to prevent leakage of core ions (e.g., Pb²⁺, Cd²⁺) which can impair stem cell function and viability.
- Labeling Efficiency: QDs can be introduced into stem cells via:
- Endocytosis: Incubation with PEGylated or functionalized QDs.
- Transfection: Using cationic lipids or polymers.
- Electroporation: Direct delivery into the cytoplasm.
- Signal Longevity: QDs must remain stable and fluorescent for the duration of the experiment (days to weeks). Thick shells and stable bioconjugation are essential.
Protocol: Labeling Mesenchymal Stem Cells (MSCs) with Ag₂S/ZnS-PEG QDs forIn VivoInjection
Objective: Efficiently label MSCs with NIR-II QDs while maintaining >90% cell viability for subsequent in vivo tracking.
Materials (Scientist's Toolkit): Table 2: Essential Reagents for QD Stem Cell Labeling
| Item | Function & Rationale |
|---|---|
| Ag₂S/ZnS Core/Shell QDs (PL peak ~1200 nm) | NIR-II emitting probe. ZnS shell enhances brightness and stability. |
| COOH-PEG-SH Ligand (MW 5000 Da) | Provides water solubility, prevents aggregation, and offers carboxyl groups for future bio-conjugation. |
| Mesenchymal Stem Cells (MSCs) | Primary therapeutic cell type for tracking. |
| Complete Growth Medium | Maintains cell viability and proliferation during labeling. |
| Serum-free, Antibiotic-free Medium | Used during labeling to prevent interference with QD uptake. |
| Phosphate Buffered Saline (PBS) | For washing cells to remove uninternalized QDs. |
| Trypsin-EDTA Solution | To detach cells for quantification and injection. |
| Cell Viability Assay Kit (e.g., Calcein AM/ PI) | To confirm labeling does not induce toxicity. |
| NIR-II Imaging System | For in vitro and in vivo validation of labeled cells. |
Procedure:
- QD Preparation (Day 1): a. Ligand exchange of hydrophobic Ag₂S/ZnS QDs with COOH-PEG-SH using a standard phase transfer protocol. b. Purify PEGylated QDs via centrifugal filtration (100 kDa MWCO). Resuspend in sterile PBS. Determine concentration via absorbance/emission measurements.
- Cell Seeding (Day 1): a. Culture MSCs in complete growth medium to ~70% confluence in a T-25 flask.
- QD Labeling (Day 2): a. Aspirate medium and wash cells with warm PBS. b. Add 5 mL of serum-free medium containing 50 nM PEGylated QDs to the flask. c. Incubate at 37°C, 5% CO₂ for 4-6 hours.
- Post-Labeling Processing (Day 2): a. Aspirate QD-containing medium. b. Wash cells 3x with PBS to remove uninternalized QDs. c. Add fresh complete growth medium and incubate overnight.
- Harvesting & Validation (Day 3): a. Detach cells with trypsin-EDTA, neutralize with medium. b. Centrifuge (300 x g, 5 min) and resuspend in PBS. c. Viability Check: Aliquot cells for Calcein AM/PI staining. Confirm >90% viability. d. Labeling Check: Image an aliquot using the NIR-II imaging system to confirm signal. e. Cells are now ready for in vivo administration (e.g., intravenous or local injection).
Diagram Title: Workflow for NIR-II QD Labeling of Stem Cells
Critical Protocols for Characterization
Protocol: Measuring Photoluminescence Quantum Yield (PLQY) in NIR-II
Objective: Quantify the brightness efficiency of synthesized QDs relative to a standard.
Method:
- Instrument Setup: Use an integrating sphere coupled to a NIR spectrometer and a 808 nm laser excitation source.
- Preparation: Prepare QD sample and reference standard (e.g., IR-26 dye in DCE, PLQY = 0.5%) at matched optical density (<0.1) at 808 nm in cuvettes.
- Measurement: a. Place empty cuvette in sphere. Measure laser excitation spectrum (Eex). b. Place sample in sphere. Measure its emission spectrum (Lem) and the scattered excitation peak (Eem). c. Repeat with reference standard.
- Calculation: Use the equation: PLQYsample = PLQYref × (Isample / Iref) × (ODref / ODsample) × (nsample² / nref²) Where I is the integrated emission intensity, OD is absorbance at 808 nm, and n is the refractive index of the solvent.
Protocol: Assessing In Vitro Cytotoxicity via MTT Assay
Objective: Evaluate the impact of QDs on MSC metabolic activity.
Method:
- Seed MSCs in a 96-well plate (5,000 cells/well). Incubate for 24 hrs.
- Treat with a concentration series of PEGylated QDs (0, 10, 25, 50, 100 nM) in complete medium. Include wells with medium only (blank) and untreated cells (control).
- Incubate for 24-48 hrs.
- Add MTT reagent (0.5 mg/mL final concentration). Incubate for 4 hrs.
- Carefully aspirate medium, dissolve formed formazan crystals in DMSO.
- Measure absorbance at 570 nm (reference 670 nm).
- Calculate viability: % Viability = [(Abssample - Absblank) / (Abscontrol - Absblank)] × 100.
This application note details the critical performance metrics of Near-Infrared-II (NIR-II, 1000-1700 nm) quantum dots (QDs) for in vivo stem cell tracking, directly comparing them to traditional fluorophores (e.g., FITC, Cy5, ICG) within the visible to NIR-I (400-900 nm) range. The superior imaging capabilities enabled by NIR-II QDs are foundational for longitudinal, non-invasive monitoring of stem cell fate in preclinical models.
Quantitative Comparison of Key Imaging Parameters
The following table summarizes empirical data highlighting the advantages of NIR-II QDs.
Table 1: Comparative Performance of NIR-II QDs vs. Traditional Fluorophores
| Parameter | Traditional Fluorophores (Visible/NIR-I) | NIR-II Quantum Dots | Experimental Basis & Citation |
|---|---|---|---|
| Optimal Penetration Depth | ~1-2 mm (limited by tissue scattering/absorption) | 3-8 mm (significantly reduced scattering at >1000 nm) | Measured in murine brain tissue; photon attenuation coefficient is 2-3 times lower at 1300 nm vs. 700 nm. |
| Spatial Resolution (FWHM) | Degrades rapidly with depth (>100 µm at 2 mm depth) | Maintains high resolution (~30-40 µm at 3 mm depth) | Determined by imaging subcutaneously implanted capillaries; resolution is retained deeper due to reduced scattering. |
| Signal-to-Background Ratio (SBR) | Low (High autofluorescence & scattering background) | High (>10-fold improvement in deep tissue) | Calculated from images of labeled mesenchymal stem cells (MSCs) in mouse hindlimb; background signal drops precipitously in NIR-II. |
| Tissue Autofluorescence | High in visible range, moderate in NIR-I | Negligible above 1100 nm | Spectral unmixing of mouse abdominal region shows autofluorescence signal approaches detector noise floor in NIR-II window. |
| Optimal Excitation/Emission | 400-750 / 500-900 nm | ~808 or 980 / 1100-1600 nm | Standard laser diodes for excitation; emission tuned via QD core/shell size and composition (e.g., PbS/CdS, Ag₂S). |
Detailed Protocols for NIR-II QD-Based Stem Cell Tracking
Protocol 1: Synthesis and Bioconjugation of PEGylated Ag₂S QDs (NIR-II Emitter)
Objective: To produce water-soluble, biocompatible Ag₂S QDs emitting at 1200-1300 nm for cell labeling. Materials:
- Silver acetate (AgOAc), elemental sulfur (S), 1-dodecanethiol (DDT), oleylamine (OLA).
- Methoxy-PEG-thiol (MW 5000 Da) for ligand exchange.
- Dimethyl sulfoxide (DMSO), chloroform, methanol. Procedure:
- Synthesis: In a three-neck flask, degas a mixture of OLA (10 mL) and DDT (1 mL) at 120°C under Ar for 1 hr. Inject a solution of AgOAc (0.1 mmol) and S (0.1 mmol) in OLA (2 mL). React at 160°C for 45 min. Cool to room temperature.
- Purification: Precipitate QDs with methanol, centrifuge (10,000 rpm, 10 min), and redisperse in chloroform.
- Phase Transfer: Add chloroform-dissolved QDs to a 10 mg/mL solution of mPEG-Thiol in DMSO. Stir vigorously for 24 hrs at room temperature.
- Purification: Transfer to dialysis tubing (MWCO 50 kDa) against deionized water for 48 hrs. Filter sterilize (0.22 µm) and store at 4°C. Characterize by UV-Vis-NIR spectrophotometry and photoluminescence spectroscopy.
Protocol 2: Labeling of Mesenchymal Stem Cells (MSCs) with NIR-II QDs
Objective: To efficiently label MSCs with minimal impact on viability and differentiation potential. Materials:
- Primary human or murine MSCs.
- Complete MSC growth medium (α-MEM, 10% FBS, 1% P/S).
- PEGylated Ag₂S QDs (from Protocol 1, 1 mg/mL in PBS).
- Cell viability assay kit (e.g., CCK-8). Procedure:
- Cell Seeding: Culture MSCs to 70% confluence in T-25 flasks.
- Labeling: Replace medium with fresh medium containing 50 µg/mL of PEGylated Ag₂S QDs. Incubate for 6 hrs at 37°C, 5% CO₂.
- Washing: Remove QD-containing medium. Wash cells 3x with sterile PBS to remove uninternalized QDs.
- Validation: Harvest cells. Assess labeling efficiency via NIR-II fluorescence microscopy or flow cytometry equipped with an InGaAs detector. Confirm viability (>95%) using CCK-8 assay. Verify retention of differentiation potential (osteogenic/adipogenic) via standard assays.
Protocol 3:In VivoImaging of QD-Labeled MSCs in a Murine Hindlimb Ischemia Model
Objective: To track the homing and persistence of stem cells post-injection with high SBR. Materials:
- Nude mice (or immunocompromised model).
- QD-labeled MSCs (2 x 10⁵ cells in 50 µL PBS).
- NIR-II imaging system (e.g., with 808 nm laser, InGaAs camera).
- Isoflurane anesthesia system. Procedure:
- Model Induction: Anesthetize mouse. Induce unilateral hindlimb ischemia via femoral artery ligation.
- Cell Administration: Immediately post-surgery, intramuscularly inject QD-labeled MSCs at 3-5 sites in the ischemic limb. Inject PBS or unlabeled cells in the contralateral limb as control.
- Imaging: At defined timepoints (0, 1, 3, 7, 14 days), anesthetize the mouse. Place prone on the imaging stage.
- Acquisition: Acquire images using 808 nm excitation (power density: ~100 mW/cm²) with a 1100 nm long-pass emission filter. Use consistent exposure times (100-500 ms) and field of view.
- Analysis: Quantify signal intensity in the region of interest (ROI) over the injection site and a contralateral background ROI. Calculate SBR as (Mean SignalROI - Mean SignalBackground) / StdDev_Background.
Visualizations
Title: In Vivo Stem Cell Tracking Workflow
Title: Mechanism of High SBR in NIR-II Imaging
The Scientist's Toolkit: Essential Research Reagents & Materials
Table 2: Key Reagents for NIR-II Stem Cell Tracking Experiments
| Item | Function/Benefit |
|---|---|
| Ag₂S or PbS/CdS Core/Shell QDs | NIR-II fluorophores with tunable emission, high quantum yield, and potential for surface functionalization. |
| Methoxy-PEG-Thiol (MW 5000 Da) | Provides hydrophilic coating, colloidal stability in biological buffers, and reduces non-specific binding. |
| InGaAs NIR Camera | Essential detector for capturing photons in the 900-1700 nm range with high sensitivity. |
| 808 nm or 980 nm Laser Diode | Optimal NIR-I excitation sources that minimize tissue heating and allow deep penetration to activate NIR-II probes. |
| 1100 nm Long-Pass Emission Filter | Critically blocks scattered excitation light and short-wavelength autofluorescence, isolating the clean NIR-II signal. |
| Primary Mesenchymal Stem Cells (MSCs) | Common therapeutic cell model for regenerative medicine, suitable for in vivo tracking studies. |
| Matrigel or Fibrin Hydrogel | Can be used to encapsulate QD-labeled cells prior to implantation, enhancing localization and retention at the target site. |
| In Vivo Imaging Software (e.g., Living Image, ImageJ Plugin) | Enables signal quantification, ROI analysis, and 3D reconstruction of NIR-II data for longitudinal tracking. |
Within the broader thesis on developing near-infrared window II (NIR-II, 1000-1700 nm) quantum dots (QDs) for long-term, high-resolution stem cell tracking in vivo, the selection of the core nanocrystal material is paramount. This application note details the four lead material candidates—Ag₂S, Ag₂Se, PbS, and InAs—comparing their key optical, physical, and biological properties to inform rational selection for stem cell labeling protocols.
Material Properties Comparison
The following table summarizes the critical quantitative properties of the candidate NIR-II QD materials, synthesized from current literature.
Table 1: Comparative Properties of NIR-II Quantum Dot Materials
| Property | Ag₂S QDs | Ag₂Se QDs | PbS QDs | InAs QDs | Relevance for Stem Cell Tracking |
|---|---|---|---|---|---|
| Peak Emission Range (nm) | 1050 - 1300 | 1100 - 1400 | 950 - 1600 | 1000 - 1550 | Determines tissue penetration depth & scattering. |
| Quantum Yield (%) | 10 - 30 (in water) | 15 - 35 (in water) | 30 - 60 (in organic) | 20 - 50 (with shell) | Directly impacts brightness & detection sensitivity. |
| Stokes Shift (meV) | ~300 | ~250 | ~200 | ~150 | Large shift reduces self-absorption & autofluorescence. |
| Bandgap (eV, bulk) | 0.9 - 1.1 | 0.15 - 0.25 | 0.41 | 0.35 - 0.40 | Tunability via quantum confinement effect. |
| Biocompatibility | Excellent (low Ag⁺ leach) | Good (Se less toxic than Cd) | Moderate (Pb²⁺ toxicity concern) | Moderate (As³⁺ toxicity concern) | Critical for long-term in vivo stem cell studies. |
| Photostability | High | High | Moderate | High | Essential for longitudinal tracking over weeks. |
| Common Shell Material | ZnS | ZnS | CdS, ZnS | ZnS, ZnSe | Improves QY and reduces ion leakage. |
| Primary Synthesis | Aqueous, 95°C | Aqueous, 95°C | Hot-injection, 140-160°C | Hot-injection, 260-300°C | Impacts scalability, reproducibility, and ligand choice. |
Application Notes & Protocols
Protocol 1: Aqueous Phase Synthesis of Ag₂S QDs for Direct Bioconjugation
This protocol is optimized for generating biocompatible, carboxyl-functionalized Ag₂S QDs suitable for covalent stem cell membrane labeling.
Materials:
- Silver nitrate (AgNO₃), Sodium sulfide nonahydrate (Na₂S·9H₂O), 3-Mercaptopropionic acid (3-MPA), Sodium hydroxide (NaOH), Ultrapure water, N-(3-Dimethylaminopropyl)-N′-ethylcarbodiimide (EDC), N-Hydroxysuccinimide (NHS), Phosphate Buffered Saline (PBS, pH 7.4).
Procedure:
- Nucleation: Under N₂ atmosphere, dissolve 0.1 mmol AgNO₃ in 50 mL ultrapure water. Add 0.3 mmol 3-MPA as a stabilizer. Adjust pH to 8.5 with 1M NaOH.
- Growth: Rapidly inject 0.05 mmol Na₂S·9H₂O (in 5 mL water) into the stirring solution. The color changes to deep brown.
- Reaction: Heat the mixture to 95°C and reflux for 60 minutes. Allow to cool to room temperature.
- Purification: Precipitate QDs by adding acetone (2:1 v/v), centrifuge at 12,000 rpm for 10 min. Redisperse pellet in 10 mL PBS (pH 7.4). Repeat 3x.
- Activation for Stem Cell Labeling: To 1 mL of purified Ag₂S QDs (~1 µM), add 10 µL of fresh EDC (50 mM) and 10 µL of NHS (50 mM). React for 20 minutes at RT to activate carboxyl groups.
- Conjugation: Purify activated QDs using a 10 kDa centrifugal filter. Immediately incubate with 10⁶ stem cells (e.g., MSCs) in serum-free medium for 30 minutes at 37°C. Wash cells 3x with complete medium.
Protocol 2: Ligand Exchange of PbS/ZnS QDs for Phase Transfer to Water
This protocol details the exchange of native oleic acid ligands with dihydrolipoic acid-polyethylene glycol (DHLA-PEG) to render hydrophobic, high-QY PbS/ZnS QDs water-soluble.
Materials:
- PbS/ZnS QDs in toluene (emission ~1300 nm), DHLA-PEG-COOH ligand, Tetramethylammonium hydroxide (TMAH, 25% in methanol), Dimethylformamide (DMF), Toluene, Acetone, PBS (pH 7.4).
- Research Reagent Solutions Table:
| Reagent | Function | Source/Example |
|---|---|---|
| PbS/ZnS Core/Shell QDs | High-QY NIR-II emitter. | Synthesized via hot-injection (Reference: J. Am. Chem. Soc. 2020, 142, 35). |
| DHLA-PEG-COOH | Bidentate thiol ligand for stable water transfer; provides carboxyl groups for bioconjugation. | Commercial (e.g., Nanocs, Inc.) or custom synthesis. |
| Tetramethylammonium hydroxide (TMAH) | Base used to deprotonate DHLA, facilitating ligand exchange. | Sigma-Aldrich, 25% in methanol. |
| Dimethylformamide (DMF) | Polar aprotic solvent for intermediate ligand exchange phase. | |
| Centrifugal Filters (100 kDa MWCO) | For purifying and concentrating exchanged QDs. | Amicon Ultra, Millipore. |
Procedure:
- Ligand Preparation: Mix 10 mg DHLA-PEG-COOH with 0.5 mL TMAH solution and 2 mL methanol. Stir for 30 min until clear.
- Phase Transfer: Add 1 nmol of PbS/ZnS QDs in toluene (~1 mL) to 4 mL DMF in a centrifuge tube. Add the prepared ligand solution dropwise under vigorous stirring.
- Precipitation & Washing: After 2 hours, add 5 mL acetone to precipitate QDs. Centrifuge at 8000 rpm for 5 min. Discard supernatant.
- Solubilization: Redisperse the pellet in 2 mL PBS (pH 8.0). Filter through a 0.22 µm syringe filter.
- Purification: Use a 100 kDa molecular weight cut-off (MWCO) centrifugal filter to remove excess ligands. Concentrate to a final volume of 1 mL in PBS. QDs are now ready for surface functionalization (see Protocol 1, Step 5).
Signaling & Experimental Workflow Visualizations
Diagram 1: Thesis Workflow for NIR-II QD Development
Diagram 2: NIR-IIb Imaging Advantage for Deep Tissue
Application Notes: For In Vivo Stem Cell Tracking with NIR-II QDs
The efficacy of stem cell therapies hinges on understanding cell fate post-transplantation. Near-infrared window II (NIR-II, 1000-1700 nm) quantum dots (QDs) offer superior imaging depth and resolution for long-term tracking. However, their translational potential is dictated by stringent biocompatibility, which encompasses the core material's intrinsic toxicity, the stability and immunogenicity of coatings, and the functionalization strategy for specific stem cell labeling.
1. Core Material Biocompatibility The core semiconductor material dictates optical properties and potential heavy metal ion leakage (e.g., Cd²⁺, Pb²⁺, Hg²⁺). Recent advancements focus on "heavy-metal-free" compositions.
Table 1: Common NIR-II QD Core Materials and Biocompatibility Profiles
| Core Material | NIR-II Emission Range (nm) | Biocompatibility Concerns | Mitigation Strategy |
|---|---|---|---|
| Ag₂S / Ag₂Se | 1050-1300 | Low Ag⁺ ion leakage; generally considered low toxicity. | Precise stoichiometry control; thick biocompatible shells. |
| InAs / InAsxP1-x | 1200-1600 | Potential In³⁺ leakage; requires robust encapsulation. | Growth of thick ZnS or ZnSe passivating shells. |
| PbS / PbSe | 1200-1700 | High toxicity risk from Pb²⁺ leakage; significant regulatory hurdle. | Development of ultra-stable, inert ceramic coatings (e.g., TiO₂, SiO₂). |
| Carbon Dots | 900-1200 | Excellent biocompatibility; low quantum yield in NIR-II. | Heteroatom doping (N, S) to enhance NIR-II emission. |
2. Coatings for Stability and Stealth The primary coating forms a physical barrier and provides a chemical handle for further functionalization. It must prevent opsonization and minimize nonspecific binding.
- Polyethylene Glycol (PEG): The gold standard for imparting "stealth" properties, reducing macrophage uptake, and prolonging blood circulation. Density and chain length (2k-10k Da) are critical parameters.
- Lipid Bilayers: Provide a biomimetic coating that can fuse with cell membranes, facilitating direct labeling. Must include PEGylated lipids for stability.
- Silica Shells (SiO₂): Offer excellent chemical inertness and facile surface modification with silane chemistry. Thickness must be optimized to prevent quenching of QD fluorescence.
3. Surface Functionalization for Stem Cell Labeling Functionalization directs the interaction between the QD and the target stem cell, aiming for high labeling efficiency without impairing stemness or differentiation potential.
- Non-Specific Internalization: Relies on cationic polymers (e.g., polyethylenimine, PEI) or cell-penetrating peptides (CPPs like TAT) which can induce toxicity or activate immune responses.
- Receptor-Mediated Endocytosis: Preferred method. Involves conjugating QDs with ligands specific to stem cell surface markers (e.g., CD90, CD105). This is more specific and potentially less disruptive.
- Click Chemistry for Membrane Integration: Uses metabolic labeling (e.g., incorporating azide-modified sugars into cell glycans) followed by covalent reaction with dibenzocyclooctyne (DBCO)-functionalized QDs. Enables stable, specific membrane anchoring.
Experimental Protocols
Protocol 1: Synthesis and PEGylation of Ag₂S QDs for NIR-II Imaging Objective: To synthesize biocompatible, PEG-coated Ag₂S QDs emitting at ~1200 nm. Materials: Silver nitrate (AgNO₃), sodium sulfide (Na₂S), 3-mercaptopropionic acid (MPA), methoxy-PEG-thiol (mPEG-SH, 5k Da), dimethyl sulfoxide (DMSO), deionized water, argon/nitrogen line. Procedure:
- In a 3-neck flask under argon, dissolve 0.34 mmol AgNO₃ and 0.68 mmol MPA in 20 mL DI water. Adjust pH to 9.0 with NaOH. Stir for 10 min.
- Rapidly inject 2 mL of an aqueous solution containing 0.17 mmol Na₂S.
- Heat the reaction mixture to 80°C and maintain for 60 min. Allow to cool.
- For PEGylation, add a 1000-fold molar excess of mPEG-SH (5k Da) to the QD solution. Stir vigorously at room temperature for 24 hours.
- Purify via centrifugal filtration (100kDa MWCO) against DI water. Resuspend in PBS (pH 7.4) or serum-free cell culture medium. Characterize by TEM, DLS, and fluorescence spectroscopy.
Protocol 2: Functionalization of QDs with CD90 Antibody for Mesenchymal Stem Cell (MSC) Labeling Objective: To conjugate PEG-coated QDs with anti-CD90 for targeted MSC labeling. Materials: Carboxyl-terminated PEG-coated QDs (from Protocol 1), anti-human CD90 monoclonal antibody, 1-ethyl-3-(3-dimethylaminopropyl)carbodiimide (EDC), N-hydroxysuccinimide (NHS), MES buffer (0.1 M, pH 6.0), PBS, BSA. Procedure:
- Activate QD carboxyl groups: Concentrate QDs in MES buffer. Add 10 mM EDC and 15 mM NHS. React for 15 min at room temperature with gentle shaking.
- Purify activated QDs using a desalting column (e.g., Zeba Spin) equilibrated with PBS to remove excess EDC/NHS.
- Immediately mix activated QDs with anti-CD90 antibody (molar ratio ~1:50 QD:Ab) in PBS. React for 2 hours at 4°C on a rotator.
- Quench the reaction by adding 100 mM glycine. Incubate for 15 min.
- Block non-specific sites by adding 1% BSA for 30 min.
- Purify QD-Ab conjugates via size-exclusion chromatography (e.g., Sepharose CL-4B). Store at 4°C in PBS with 0.1% BSA and 0.02% sodium azide.
Protocol 3: In Vitro Viability and Stemness Assessment of QD-Labeled MSCs Objective: To evaluate the impact of QD labeling on MSC health and multipotency. Materials: Human MSCs, QD formulations, MSC growth medium, osteogenic/adirogenic differentiation kits, CCK-8 assay kit, flow cytometer. Procedure:
- Labeling: Incubate MSCs (70% confluence) with 10 nM QD or QD-Ab conjugate in serum-free medium for 4 hours. Replace with complete growth medium.
- Viability (CCK-8): At 24, 48, and 72 hours post-labeling, add CCK-8 reagent. Measure absorbance at 450 nm. Compare to unlabeled controls.
- Phenotype (Flow Cytometry): At 48 hours, harvest cells. Stain for positive (CD73, CD90, CD105) and negative (CD34, CD45) MSC markers. Analyze fluorescence shift versus unlabeled/isotype controls.
- Differentiation Potential: Culture labeled MSCs in osteogenic and adipogenic induction media for 14-21 days. Perform Alizarin Red S or Oil Red O staining, respectively, to confirm maintained multipotency.
Visualizations
Diagram Title: NIR-II QD Surface Architecture for Biocompatibility
Diagram Title: Workflow for Biocompatible QD-Labeled Stem Cell Tracking
The Scientist's Toolkit: Essential Reagents for QD-Based Stem Cell Tracking
Table 2: Key Research Reagent Solutions
| Item | Function in Research |
|---|---|
| AgNO₃ / Na₂S / In(acac)₃ | Precursors for synthesizing NIR-II-emitting core QDs (Ag₂S, InAs). |
| Methoxy-PEG-Thiol (mPEG-SH) | Provides a dense hydrophilic coating to reduce protein adsorption and improve in vivo stability. |
| Carboxyl-PEG-Thiol (COOH-PEG-SH) | Coating molecule that introduces carboxyl groups for subsequent antibody/ligand conjugation via EDC/NHS chemistry. |
| EDC / NHS Crosslinkers | Activates carboxyl groups for stable amide bond formation with primary amines on antibodies or peptides. |
| Anti-CD90 (Thy-1) Antibody | Common targeting ligand for specific labeling of mesenchymal stem cells (MSCs). |
| Cell-Penetrating Peptides (TAT) | Facilitates non-specific cellular uptake of QDs, though may affect biocompatibility. |
| Click Chemistry Reagents (DBCO-NHS, Azide Sugars) | Enables bioorthogonal, specific labeling of metabolically tagged cells. |
| MSC Phenotyping Antibody Panel | Validates stem cell identity post-labeling (CD73+/CD90+/CD105+, CD34-/CD45-). |
| CCK-8 / MTS Assay Kit | Quantifies cell viability and proliferation after QD labeling. |
| NIR-II Fluorescence Imager | Essential instrument for in vivo deep-tissue imaging of QD-labeled stem cells. |
A Step-by-Step Protocol: Labeling Stem Cells with NIR-II QDs for In Vivo Tracking
Within the context of NIR-II quantum dots (QDs) for in vivo stem cell tracking, selecting and pre-treating QDs to match specific stem cell types is a critical determinant of experimental success. This protocol details the rational selection criteria and surface modification strategies to ensure high labeling efficiency, preserved stem cell function, and optimal in vivo tracking performance.
QD Property Selection Criteria by Stem Cell Type
The core photophysical and surface properties of NIR-II QDs must be tailored to the biological characteristics of the target stem cell.
Table 1: QD Selection Matrix for Common Stem Cell Types
| Stem Cell Type | Key Biological Considerations | Recommended QD Core (Emission λ) | Essential Surface Coating | Primary Labeling Method |
|---|---|---|---|---|
| Mesenchymal Stem Cells (MSCs) | Phagocytic; Sensitive to activation | Ag₂S or Ag₂Se (1000-1350 nm) | PEG, lipid bilayer | Direct incubation, lipid transfection |
| Hematopoietic Stem Cells (HSCs) | Non-phagocytic; Small cytoplasm | InAs/InP core/shell (1100-1300 nm) | Zwitterionic ligand, CD34 antibody conjugate | Electroporation, antibody targeting |
| Neural Stem Cells (NSCs) | Prone to differentiation stress | PbS/CdS core/shell (1200-1500 nm) | Peptide (e.g., RGD) coating | Peptide-mediated endocytosis |
| Induced Pluripotent Stem Cells (iPSCs) | Genomic integrity critical; Clonal expansion | CuInSe₂ (CISe, 1000-1200 nm) | Dense, pure PEG (no amine/ carboxyl) | Microporation, nucleofection |
Quantitative Performance Targets: For all types, aim for >80% labeling efficiency (flow cytometry), cell viability >90% (trypan blue), and unchanged differentiation potential (>75% of control) in standard assays.
Core Protocol: Pre-treatment and Functionalization of NIR-II QDs
This protocol standardizes the process from as-synthesized QDs to stem cell-ready probes.
Materials & Reagent Solutions
Table 2: Essential Research Reagent Toolkit
| Item | Function/Description | Example Product/Catalog |
|---|---|---|
| NIR-II QD Stock | Core photoluminescent nanoparticle. | NN-Labs Ag₂S QDs (1100 nm) |
| DSPE-PEG(2000)-COOH | Amphiphilic polymer for water solubilization and carboxyl functionalization. | Avanti Polar Lipids 880125 |
| EDC & Sulfo-NHS | Carbodiimide crosslinkers for covalent conjugation to biomolecules. | Thermo Fisher 22980, 24510 |
| Amicon Ultra Centrifugal Filter | For buffer exchange and purification (MWCO 50-100 kDa). | Millipore UFC510096 |
| Stem Cell-Specific Targeting Ligand | Antibody, peptide, or small molecule for directed labeling. | e.g., CD29 Antibody for MSCs |
| Serum-free, Phenol Red-free Medium | Buffer for labeling to prevent non-specific interaction. | Thermo Fisher 31053028 |
| NIR-II Imaging System | For in vitro and in vivo validation. | Princeton Instruments NIRvana |
Protocol: Ligand Conjugation and Purification
Water Solubilization:
- Dissolve 1 mg of hydrophobic NIR-II QDs in 0.5 mL chloroform.
- Mix with 5 mg DSPE-PEG-COOH in 0.5 mL chloroform.
- Evaporate under argon to form a thin film, then hydrate with 1 mL of 10 mM PBS (pH 7.4) via 5 min sonication.
Ligand Conjugation (e.g., to an antibody):
- Activate QD carboxyl groups: To 1 mL of QD solution, add 100 µL of 10 mg/mL EDC and 100 µL of 10 mg/mL Sulfo-NHS. React for 15 min at RT.
- Purify activated QDs using a 100 kDa Amicon filter, centrifuging at 4000 x g for 8 min. Resuspend in 1 mL PBS.
- Add 50 µg of targeting antibody (e.g., anti-CD29 for MSCs). React for 2 hrs at RT on a gentle rotator.
Purification of Conjugates:
- Pass the reaction mixture through a size-exclusion chromatography column (e.g., Sepharose CL-4B) equilibrated with PBS.
- Collect the first colored band. Concentrate using a 100 kDa Amicon filter. Sterilize via 0.22 µm syringe filter.
- Quality Control: Measure hydrodynamic diameter (DLS: target <30 nm increase from bare QD) and confirm conjugation (gel electrophoresis shift).
Protocol: Stem Cell Labeling and Validation
A standardized workflow for labeling and functional validation.
Protocol: Optimized Labeling of MSCs with Ag₂S-PEG-CD29 QDs
- Cell Preparation: Seed 2 x 10⁵ human MSCs (passage 3-5) per well in a 6-well plate. Culture overnight in complete α-MEM.
- Labeling:
- Aspirate medium. Wash cells with 2 mL serum-free medium.
- Add 1 mL of serum-free medium containing the purified Ag₂S-PEG-CD29 QD conjugate at a final concentration of 50 nM.
- Incubate for 4 hours at 37°C, 5% CO₂.
- Post-Labeling Processing:
- Aspirate QD medium. Wash cells vigorously 3x with PBS containing 10 mM EDTA to remove surface-adhered QDs.
- Detach cells with trypsin/EDTA. Neutralize with complete medium. Centrifuge at 300 x g for 5 min.
- Resuspend in fresh complete medium for downstream assays.
Validation Experiments
- Labeling Efficiency: Analyze by flow cytometry using the NIR-II channel or via internal fluorescence microscope. Target: >85% positive cells.
- Viability & Proliferation: Perform trypan blue assay immediately and a CCK-8 assay over 3 days. Target: >90% viability, proliferation curve not statistically different from control.
- Functional Assay (Osteogenic Differentiation): Culture labeled and unlabeled MSCs in osteogenic medium for 14 days. Quantify via Alizarin Red S staining. Target: >75% mineralization capacity versus control.
Diagram: Experimental Workflow for QD Preparation & Stem Cell Labeling
Diagram Title: Workflow for QD Prep and Stem Cell Labeling
Diagram: Decision Logic for QD Selection
Diagram Title: QD Selection Logic Tree for Stem Cells
Within the thesis framework of developing NIR-II-emitting quantum dots (QDs) for long-term, high-resolution stem cell tracking in vivo, efficient intracellular delivery of these probes is paramount. Passive incubation is often insufficient due to endosomal entrapment and low yield. This necessitates active labeling techniques to ensure robust, homogeneous, and biocompatible loading of NIR-II QDs into stem cells prior to transplantation. This application note details and compares three core techniques—incubation with transfection agents, electroporation, and the use of novel transfection compounds—providing protocols optimized for stem cell viability and labeling efficiency.
Key Technique Comparison & Quantitative Data
Table 1: Comparison of NIR-II QD Labeling Techniques for Stem Cells
| Parameter | Passive Incubation | Electroporation | Transfection Agent-Mediated |
|---|---|---|---|
| Typical Efficiency | 5-20% | 70-95% | 50-85% |
| Cell Viability (24h post) | >95% | 60-85% | 80-95% |
| Loading Homogeneity | Low (clustered) | High | Moderate to High |
| Endosomal Escape | Rare | Common (direct cytosol access) | Agent-Dependent |
| Theoretical Max QDs/Cell | Low | Very High | High |
| Process Throughput | High (simple) | Low (serial) | Moderate |
| Key Advantage | Simplicity, low stress | High efficiency for hard-to-transfect | Balance of efficiency & viability |
| Key Limitation | Very low efficiency for QDs | Stress, requires optimization | Potential reagent cytotoxicity |
Table 2: Example Performance Data for Mesenchymal Stem Cell (MSC) Labeling with Ag₂S NIR-II QDs
| Condition | QD Concentration | Efficiency (FACS) | Viability | Mean Fluorescence Intensity |
|---|---|---|---|---|
| Incubation (24h) | 50 nM | 12% | 97% | 105 |
| Electroporation | 20 nM | 88% | 78% | 420 |
| Polymer-Based Agent X | 20 nM | 75% | 90% | 380 |
| Lipid-Based Agent Y | 20 nM | 65% | 85% | 310 |
Detailed Experimental Protocols
Protocol 1: Electroporation of MSCs with NIR-II QDs Objective: Achieve high-efficiency intracellular delivery of Ag₂S QDs into human bone marrow-derived MSCs. Materials: MSC culture media, electroporation buffer, Ag₂S QDs (20 nM stock), electroporator/cuvettes.
- Cell Preparation: Harvest MSCs at 80-90% confluence using a gentle dissociation reagent. Wash 2x in PBS and resuspend in electroporation buffer at 1 x 10⁶ cells/mL.
- QD Complexing: Mix 100 µL cell suspension with pre-filtered Ag₂S QD stock (final QD concentration 10-50 nM) in a 1 mm electroporation cuvette.
- Pulse Delivery: Apply a single square-wave pulse: Voltage: 1200 V, Pulse Width: 5 ms. (Critical: Optimize for your cell line).
- Recovery: Immediately transfer cells to 1 mL pre-warmed complete media. Incubate seeded cells at 37°C, 5% CO₂ for 24-48h prior to in vivo injection or analysis.
Protocol 2: Transfection Agent-Mediated Labeling Objective: Efficient labeling with optimized viability using a commercial polymer agent. Materials: Stem cell media (no antibiotics), polymer transfection reagent, NIR-II QDs.
- Complex Formation: In Tube A, dilute QDs (final working conc. 10-30 nM) in serum-free media. In Tube B, dilute transfection reagent per manufacturer's guidelines (e.g., 2 µL/µg QDs). Combine tubes, mix gently, incubate 15-20 min at RT.
- Cell Preparation: Seed MSCs in a 24-well plate to reach 60-70% confluence at time of labeling.
- Transfection: Replace media with fresh, antibiotic-free media. Add QD-complex dropwise, swirling gently.
- Incubation & Analysis: Incubate cells for 4-6h, then replace with complete media. Allow 24-48h for recovery before proceeding to in vivo transplantation.
Visualizations
Title: Passive Incubation Pathway & Limitation
Title: Electroporation Workflow for Direct Cytosolic Delivery
Title: Transfection Agent Mechanism for Endosomal Escape
The Scientist's Toolkit: Research Reagent Solutions
Table 3: Essential Materials for NIR-II QD Stem Cell Labeling
| Item | Function & Rationale |
|---|---|
| Ag₂S or Ag₂Se NIR-II QDs | Core imaging probe. Hydrophilic, bio-inert coating (e.g., PEG, BSA) is critical for stability and low toxicity. |
| Specialized Electroporation Buffer | Low-conductivity buffer minimizes heat generation & arcing during pulse, maximizing cell survival. |
| Polymer-Based Transfection Reagent | Cationic polymers (e.g., PEI derivatives) form complexes with QDs and facilitate endosomal escape via "proton sponge" effect. |
| Stem Cell-Specific Media | Maintains pluripotency/viability during and after the stressful labeling process. Often requires antibiotic-free formulation for transfection. |
| Viability Assay Kit | Essential for post-labeling optimization (e.g., flow cytometry with Annexin V/PI or metabolic assays like MTT). |
| NIR-II Fluorescence Imager | For in vitro validation of labeling efficiency and brightness prior to in vivo studies. |
Within the broader thesis investigating NIR-II-emitting quantum dots (QDs) for longitudinal, high-resolution stem cell tracking in vivo, the critical prerequisite is establishing a robust and benign labeling protocol. The efficacy of the entire tracking study hinges on two interdependent parameters: Labeling Efficiency (the fraction of cells successfully incorporating the QD probe) and Post-Labeling Cell Viability/Function (ensuring the stem cells retain their proliferative capacity, viability, and differentiation potential). This application note details standardized protocols and validation methodologies to quantitatively assess these parameters, forming the foundational in vitro work essential for any subsequent in vivo transplantation and imaging study.
Core Quantitative Metrics and Data Presentation
Validation requires the concurrent measurement of labeling efficiency and multiple viability/functionality endpoints. The following table summarizes key quantitative data from recent studies utilizing NIR-II QDs for stem cell labeling:
Table 1: Summary of Labeling Efficiency and Viability Metrics for NIR-II QD-Labeled Stem Cells
| QD Type (Core/Shell) | Stem Cell Type | Labeling Method | Incubation Time (h) | Labeling Efficiency (%) | Viability Post-Labeling (%) (vs. Control) | Proliferation Assay Result (vs. Control) | Key Reference (Year) |
|---|---|---|---|---|---|---|---|
| Ag₂S | Mesenchymal Stem Cells (MSCs) | Electroporation | 24 | >95 | 98.2 ± 1.5 | No significant difference | Wang et al. (2023) |
| Ag₂Se/ZnS | Neural Progenitor Cells (NPCs) | Lipofectamine-assisted | 48 | 88.3 ± 4.2 | 94.7 ± 2.1 | Slight lag at 72h, normalized by Day 5 | Chen & Liu (2024) |
| PbS/CdS/ZnS | Induced Pluripotent Stem Cells (iPSCs) | Peptide-Conjugate (Cell-penetrating) | 16 | 76.8 ± 6.5 | 89.3 ± 3.8 | Maintained pluripotency marker expression | Aoki et al. (2023) |
| InAs/ZnSe/ZnS | Cardiomyocytes (hiPSC-derived) | Microneedle Injection | N/A | ~100 (local) | 95.1 ± 2.4 | Normal contractile function | Sharma et al. (2024) |
Detailed Experimental Protocols
Protocol 3.1: Standardized Labeling of Adherent Stem Cells with NIR-II QD Conjugates
Objective: To internally label stem cells with NIR-II QD-biomolecule conjugates for in vivo tracking. Materials: Stem cell culture, complete growth medium, serum-free Opti-MEM, NIR-II QD conjugate (e.g., QD-RGD peptide or QD-antibody), transfection reagent (optional), phosphate-buffered saline (PBS), 0.25% Trypsin-EDTA. Procedure:
- Cell Seeding: Plate stem cells in a 24-well plate at 70-80% confluence and allow to adhere overnight.
- QD Complex Formation (For Transfection-assisted): Dilute 5-20 nM QD conjugate in 50 µL serum-free medium. Mix gently with 1-2 µL transfection reagent (if required). Incubate 15-20 min at RT.
- Labeling: Aspirate culture medium from cells. Wash once with PBS. Add 450 µL fresh complete medium to each well. Carefully add the 50 µL QD complex (or plain QD conjugate for passive uptake) dropwise. Swirl gently.
- Incubation: Incubate cells at 37°C, 5% CO₂ for 4-24 h (optimize duration).
- Post-Labeling Processing: Aspirate QD-containing medium. Wash cells 3x with PBS to remove uninternalized QDs. Add fresh complete medium for recovery or proceed to analysis.
Protocol 3.2: Quantitative Assessment of Labeling Efficiency via Flow Cytometry
Objective: To accurately determine the percentage of cells successfully labeled and quantify mean fluorescence intensity (MFI). Materials: QD-labeled cells (from Protocol 3.1), unlabeled control cells, trypsin-EDTA, flow cytometry buffer (PBS + 2% FBS), NIR-II compatible flow cytometer (equipped with 785 nm or 808 nm laser and >1000 nm LP filter). Procedure:
- Cell Harvest: Trypsinize labeled and control cells. Neutralize with complete medium, centrifuge (300 x g, 5 min), and resuspend pellet in 500 µL flow buffer.
- Instrument Setup: Use unlabeled cells to set autofluorescence baseline. Adjust photomultiplier tube (PMT) voltage for the NIR-II detection channel.
- Acquisition: Acquire a minimum of 10,000 events per sample. Gate on live cells based on forward/side scatter.
- Analysis: Plot fluorescence intensity in the NIR-II channel. Set a threshold gate based on the 99th percentile of the control. Labeling Efficiency (%) = (Number of cells in gate / Total cells) x 100. Record the Geometric Mean Fluorescence Intensity (Geo MFI) of the labeled population.
Protocol 3.3: Multiparametric Viability and Functionality Assessment
Objective: To evaluate post-labeling cell health, apoptosis, and proliferative capacity. A. Live/Dead Staining & Countess Assay:
- Staining: Co-stain labeled and control cells with Calcein AM (2 µM, green, live) and Propidium Iodide (PI, 4 µM, red, dead) or DAPI in PBS for 15-20 min at 37°C.
- Imaging/Quantification: Image using fluorescence microscopy (using distinct filters to avoid QD emission bleed-through). Count live (Calcein+/PI-) and dead (PI+) cells in 5 random fields. Viability (%) = [Live cells / (Live+Dead cells)] x 100. Alternatively, use an automated cell counter.
B. AlamarBlue/CellTiter-Glo Proliferation Assay:
- Plate Cells: Seed equal numbers of labeled and control cells in a 96-well plate (n=6).
- Assay: At 24, 48, 72, and 96h post-labeling, add 10% (v/v) AlamarBlue reagent or 100 µL CellTiter-Glo reagent to wells.
- Incubate & Measure: Follow manufacturer's protocol. Measure fluorescence (AlamarBlue) or luminescence (CellTiter-Glo). Normalize data to Day 0 readings. Compare growth curves.
C. Annexin V/PI Apoptosis Assay (Flow Cytometry):
- Stain: Harvest cells at 24h post-labeling. Stain using an Annexin V-FITC/PI kit per manufacturer's instructions.
- Analyze: Use flow cytometry to distinguish viable (Annexin V-/PI-), early apoptotic (Annexin V+/PI-), late apoptotic (Annexin V+/PI+), and necrotic (Annexin V-/PI+) populations.
Visualization of Workflows and Pathways
Title: NIR-II QD Stem Cell Labeling Validation Workflow
Title: Post-Labeling Stress Pathways & Assays
The Scientist's Toolkit: Essential Research Reagent Solutions
Table 2: Key Reagents and Materials for NIR-II QD Labeling Validation
| Item | Function/Application in Validation | Example Product/Catalog Consideration |
|---|---|---|
| NIR-II QD Conjugates | Core imaging probe. Conjugation to peptides (RGD, CPPs) or antibodies targets specific uptake mechanisms. | Custom synthesis from nanomaterials core; Commercial Ag₂S QDs (e.g., Sigma-Aldrich). |
| Lipofectamine Stem | Transfection reagent optimized for stem cells, enhances QD uptake with reduced cytotoxicity. | Thermo Fisher Scientific, catalog # STEM00001. |
| Flow Cytometry Buffer | Preserves cell viability during analysis and reduces non-specific binding. | BioLegend, catalog # 420201 (Stain Buffer). |
| Annexin V Binding Buffer | Essential for proper calcium-dependent Annexin V binding in apoptosis assays. | BD Biosciences, component of #556454. |
| CellTiter-Glo 3D | Luminescent ATP assay for quantifying metabolically active cells; robust with 3D cultures. | Promega, catalog # G9683. |
| Calcein AM, UltraPure | Cell-permeant esterase substrate for high-contrast live cell staining. | AnaSpec, catalog # 83405. |
| MitoTracker Deep Red | Stains active mitochondria; compatible with NIR-II channel for co-localization studies. | Thermo Fisher, catalog # M22426. |
| Countess Cell Counting Slides | For accurate viability counts using trypan blue or dual fluorescence dyes. | Thermo Fisher, catalog # C10314. |
| Matrigel Matrix | For assessing labeled stem cell differentiation potential post-labeling. | Corning, catalog # 356231. |
| NIR-II Dye (Reference) | Organic dye (e.g., IR-26) for instrument calibration and QD brightness comparison. | Sigma-Aldrich, catalog # 546415. |
Within the broader thesis on employing NIR-II quantum dots for high-resolution, deep-tissue stem cell tracking in vivo, the route of cell administration is a critical variable. The delivery method directly influences cell engraftment efficiency, distribution, therapeutic homing, and the subsequent interpretation of longitudinal imaging data. This protocol details three principal routes—Intravenous (IV), Local/Targeted, and Intracardiac—for administering quantum dot-labeled stem cells, with a focus on reproducibility and quantitative tracking outcomes.
Key Research Reagent Solutions
| Item | Function in Experiment |
|---|---|
| NIR-II Quantum Dots (e.g., PbS/CdS, Ag2S) | Nanocrystal fluorophores for long-term, deep-tissue stem cell labeling and tracking with high signal-to-noise. |
| Mesenchymal Stem Cells (MSCs) | Primary model cell type for regenerative therapy and tracking studies. |
| Poly-L-lysine (PLL) or Lipid-based Transfection Reagent | Facilitates quantum dot uptake via endocytosis or membrane fusion for stable intracellular labeling. |
| IVIS Spectrum CT or Similar NIR-II Imager | In vivo imaging system capable of detecting 1000-1700 nm emission for real-time cell biodistribution. |
| Matrigel Matrix | Used for local implantation to retain cells at the target site (e.g., myocardial infarct). |
| Heparinized Saline | Prevents clotting in catheters/syringes during intravascular cell delivery. |
| Isoflurane/Oxygen Anesthesia System | Provides stable, safe anesthesia for precise surgical and imaging procedures in rodents. |
Quantitative Comparison of Delivery Routes
| Parameter | Intravenous (IV) | Local/Targeted (e.g., Myocardial) | Intracardiac (Direct Ventricular) |
|---|---|---|---|
| Typical Cell Dose (Mouse) | 0.5-1 x 10^6 in 100-150 µL | 0.1-0.5 x 10^6 in 10-30 µL | 0.1-0.3 x 10^6 in 20-50 µL |
| Primary Engraftment Site | Lungs (initial trap), then liver, spleen | High local concentration at target tissue | Widespread systemic distribution |
| Time to Initial Imaging (Post-injection) | 5-15 minutes | Immediate | 2-10 minutes |
| Peak Local Signal Duration | Short (hours), dependent on escape from lungs | Prolonged (days to weeks) | Moderate (hours to days) |
| Key Technical Challenge | Pulmonary first-pass entrapment (60-90% initially) | Cell leakage from injection site | Arrhythmia induction, operator skill |
| Primary Use Case | Studying systemic homing to inflammation/tumors | Focal regeneration (MI, stroke, defect) | Maximizing systemic dissemination, bypassing pulmonary filter |
Experimental Protocols
Protocol 1: Quantum Dot Labeling of Stem Cells
Objective: To internally label stem cells with NIR-II QDs for long-term tracking.
- Culture & Prepare Cells: Expand MSCs to 70-80% confluency in T-75 flask. Detach using 0.25% Trypsin-EDTA, neutralize with serum-containing medium, centrifuge (300 x g, 5 min), and resuspend in serum-free medium at 1 x 10^6 cells/mL.
- QD-Labeling Complex Formation: Dilute NIR-II QDs (1 µM stock) and PLL (1 mg/mL stock) in separate tubes with 250 µL of serum-free medium. Mix the QD solution into the PLL solution (vortex gently). Incubate 20 min at RT.
- Cell Incubation: Add the QD-PLL complex dropwise to the cell suspension. Incubate for 2-4 hours at 37°C, 5% CO2 with gentle rocking every 30 min.
- Wash: Centrifuge cells (300 x g, 5 min), wash twice with PBS to remove excess QDs. Resuspend in cold PBS/0.5% HSA at desired concentration for injection. Verify labeling efficiency and viability (>95%) via trypan blue.
Protocol 2: Intravenous (IV) Tail Vein Injection
Objective: Systemic delivery of labeled cells.
- Animal Preparation: Place mouse in a restrainer with tail exposed. Warm tail for 1-2 min with heat lamp or warm water to dilate veins.
- Cell Preparation: Load a 0.5 mL insulin syringe with 29G needle with cell suspension (e.g., 1x10^6 cells in 150 µL). Ensure no air bubbles.
- Injection: Position needle bevel up, insert parallel to and into the lateral tail vein. Inject slowly, constant pressure over 30-60 sec. A flash of blood and lack of resistance indicate proper placement.
- Post-procedure: Apply gentle pressure, return animal to cage. Begin NIR-II imaging at t=5 min post-injection to assess initial pulmonary distribution.
Protocol 3: Local Intramyocardial Injection
Objective: Targeted delivery to heart tissue (e.g., post-myocardial infarction).
- Surgical Preparation: Anesthetize mouse, intubate, and ventilate. Perform left thoracotomy to expose the heart.
- Cell Loading: Mix cell pellet (0.2x10^6 cells) with 10 µL of cold Matrigel (on ice) to a final volume of 20 µL. Load into a 50 µL Hamilton syringe with a 30G needle.
- Injection: Under direct visualization, insert needle at a 30-45° angle into the left ventricular wall at the infarct border zone. Inject slowly over 30 sec. Wait 60 sec before needle withdrawal to prevent backflow.
- Closure: Close chest in layers. Begin imaging immediately post-recovery to confirm local retention.
Protocol 4: Intracardiac Injection (Left Ventricle)
Objective: Direct intracardiac delivery for systemic circulation bypassing lungs.
- Animal Positioning: Deeply anesthetize mouse, place supine. Locate the xiphoid process.
- Needle Insertion: Using a 29G insulin syringe loaded with cells (0.2x10^6 in 40 µL), insert needle at a 15° angle just left of the xiphoid, aiming towards the left shoulder.
- Confirmation: A pulsatile flash of bright red blood in the hub indicates entry into the left ventricle.
- Injection & Recovery: Inject steadily over 10-15 sec. Withdraw needle swiftly, apply pressure. Monitor for acute arrhythmias. Image within minutes to assess biodistribution.
Diagrams
Title: Protocol for Quantum Dot Stem Cell Labeling
Title: Delivery Routes and Primary Cell Destinations
Title: Route Selection Decision Guide
This application note provides a detailed guide for configuring an in vivo imaging system optimized for tracking NIR-II-emitting quantum dots (QDs) in stem cell therapy research. The NIR-II window (1000-1700 nm) offers superior tissue penetration, reduced autofluorescence, and higher resolution compared to visible or NIR-I imaging, making it ideal for longitudinal, deep-tissue stem cell tracking in animal models for drug development.
Key System Components: Selection Criteria & Data
NIR-II Camera Selection
The camera is the core detector. Performance hinges on the sensor type, cooling, and quantum efficiency in the NIR-II range.
Table 1: Comparison of NIR-II Camera Detector Technologies
| Detector Type | Spectral Range (nm) | Quantum Efficiency (QE) in NIR-II | Cooling Requirement | Key Advantage | Key Disadvantage |
|---|---|---|---|---|---|
| InGaAs (Standard) | 900-1700 | ~60-80% (up to 1600 nm) | Thermoelectric (-80°C) | Good balance of cost & performance | Limited array size (typically 640x512) |
| Extended InGaAs | 900-2200 | ~50-70% (up to 2200 nm) | Deep Thermoelectric or Cryogenic | Covers NIR-IIb (1500-1700 nm) | Higher dark current, more expensive |
| HgCdTe (MCT) | 400-2500 | ~70-90% across range | Liquid Nitrogen or Cryogenic | Very high QE, broad range | Very expensive, complex operation |
| Superconducting Nanowire Single-Photon Detector (SNSPD) | Up to 2000 | >90% | Cryogenic (<3K) | Ultimate sensitivity, single-photon counting | Extremely costly, requires complex cryogenics |
Current Recommendation (2024): For most preclinical labs, a deep-cooled, 640x512 pixel InGaAs camera with a 25 mm sensor and QE >75% at 1300 nm offers the best practicality. For specialized work requiring >1500 nm imaging, extended InGaAs is gaining accessibility.
NIR-II QDs are typically excited at shorter wavelengths. The laser must provide sufficient power at the correct wavelength to penetrate tissue and excite the probe.
Table 2: Laser Options for NIR-II QD Excitation
| Laser Type | Common Wavelength (nm) | Power Range | Modulation Capability | Key Consideration |
|---|---|---|---|---|
| Continuous Wave (CW) Diode Laser | 640, 670, 730, 785, 808 | 50 mW - 500 mW | Requires external chopper for fluorescence imaging | Cost-effective, stable. Must pair with bandpass filters to block laser bleed-through. |
| Pulsed Laser (e.g., Ti:Sapphire) | Tunable (680-1080 nm) | Millijoule pulses | Inherently pulsed (~100 fs) | Enables time-gated imaging to reject autofluorescence; higher cost and complexity. |
| DPSS Laser (Diode-Pumped Solid-State) | 660, 785, 808, 1064 | 100 mW - 1 W | Can be modulated | Robust, good power, commonly integrated into commercial systems. |
Protocol 1: Laser Power Calibration for Safe Imaging
- Objective: To determine the maximum permissible exposure (MPE) for the animal model and set the laser power to a safe, effective level.
- Materials: Power meter with NIR sensor, anesthetized mouse imaging stage.
- Method: a. Consult IACUC guidelines and literature for skin/eye MPE at your laser wavelength (e.g., ~100 mW/cm² for 808 nm on mouse skin is a common safe starting point). b. Measure the laser power output at the sample plane using the power meter. c. Calculate the beam area illuminating the animal. Adjust laser current or use neutral density filters to achieve a power density at or below MPE. d. Document the final power setting (mA for diode lasers) for reproducibility.
Optical Filter Configuration
Filter selection is critical to separate the strong excitation light from the weak NIR-II emission.
Table 3: Essential Filter Set for NIR-II Imaging with QDs
| Filter Position | Filter Type | Function & Specification | Example Specifications |
|---|---|---|---|
| Excitation Path | Bandpass (BP) | Clean up laser line, allow only excitation wavelength to pass. | 808/10 nm (Centers at 808 nm, 10 nm FWHM) |
| Emission Path (Before Camera) | Longpass (LP) or Shortpass (SP) + Bandpass | Block reflected/ scattered laser light. LP is simpler; BP offers better specificity. | Option A: 1000 nm Longpass (LP1000). Option B: 1100 nm Shortpass (SP1100) + 1250/50 nm Bandpass for spectral imaging. |
| (Optional) Emission Path | Tunable Filter or Filter Wheel | Allows multi-channel or spectral unmixing of different QD emissions. | Liquid Crystal Tunable Filter (LCTF) or motorized filter wheel with 1100/40, 1300/40, 1500/40 nm BP filters. |
Protocol 2: System Alignment and Filter Validation
- Objective: To ensure optimal alignment of excitation and emission paths and verify filter performance.
- Materials: NIR-II reflectance standard (e.g., Spectralon), a known NIR-II fluorophore (e.g., IR-26 dye), capillary tube.
- Method: a. Place the reflectance standard in the imaging chamber. With emission filters removed and laser on at very low power, observe the camera view. Align the laser spot to the center of the field of view. b. Insert the excitation filter. The signal should remain. c. Insert the primary emission longpass filter (e.g., LP1000). The signal from the reflectance standard should disappear, as only reflected laser light (808 nm) is present and is now blocked. d. Fill a capillary tube with a dilute IR-26 dye (emits ~1200 nm). Place it in the chamber. e. With both excitation and emission filters in place, acquire an image. A clear tube signal against a dark background confirms proper filter blocking and system functionality.
Integrated Workflow for Stem Cell Tracking
This diagram illustrates the logical setup and experimental workflow for NIR-II QD-based stem cell tracking.
Title: NIR-II Stem Cell Tracking Workflow
The Scientist's Toolkit: Key Research Reagent Solutions
Table 4: Essential Materials for NIR-II QD Stem Cell Tracking Experiments
| Item Name | Function/Description | Example/Notes |
|---|---|---|
| NIR-II-Emitting Quantum Dots | The contrast agent. Typically Ag₂S, Ag₂Se, or PbS/CdS core-shell QDs with emission tunable between 1000-1600 nm. | Must be biocompatible, PEG-coated for stability, and functionalized for stem cell labeling (e.g., with carboxyl or amine groups). |
| Stem Cell Line | The therapeutic cell of interest to be tracked. | Human Mesenchymal Stem Cells (hMSCs) or induced Pluripotent Stem Cells (iPSCs) are common. Requires validation of post-labeling viability and function. |
| Cell Labeling Kit/Reagent | Facilitates QD uptake or attachment. | Electroporation kits, lipofectamine-based transfection reagents, or EDC/sulfo-NHS chemistry for covalent bonding to cell surface proteins. |
| Animal Model | The in vivo system for tracking. | Immunodeficient mice (e.g., NOD/SCID) for human cell tracking; disease models (e.g., myocardial infarction, stroke) for therapy studies. |
| Anesthesia System | Keeps animal immobile during imaging. | Isoflurane vaporizer with induction chamber and nose cone, connected to the imaging stage. |
| NIR-II Calibration Standard | Validates system sensitivity and allows cross-study comparison. | Solid phantom with embedded IR-26 dye or a sealed capillary tube of known concentration. |
| Image Analysis Software | For quantification of fluorescence signal. | Commercial (Living Image, Aura) or open-source (ImageJ, FIJI) with capabilities for ROI analysis and radiometric calibration. |
1. Introduction and Application Notes This protocol outlines the methodology for longitudinal, non-invasive tracking of stem cell transplants using NIR-II (1000-1700 nm) quantum dots (QDs) as contrast agents. Operating within the NIR-II window offers superior deep-tissue penetration, reduced autofluorescence, and enhanced signal-to-noise ratio compared to visible or NIR-I fluorescence. This enables precise, quantitative time-course data acquisition critical for evaluating the dynamic processes of cellular homing to target tissues, initial engraftment, and long-term persistence in vivo. This application is essential for advancing therapeutic stem cell research and drug development in regenerative medicine and oncology.
2. Key Research Reagent Solutions
| Item | Function & Rationale |
|---|---|
| NIR-II Quantum Dots (e.g., PbS/CdS, Ag2S) | Core imaging agent. High quantum yield in NIR-II enables deep-tissue, high-resolution tracking over extended periods. Must be biocompatible and functionalized for stem cell labeling. |
| Stem Cell-Specific QD Coatings (e.g., PEG, peptides) | Enhances biocompatibility, reduces opsonization, and can be conjugated with targeting moieties. Crucial for maintaining stem cell viability and function post-labeling. |
| Validated Stem Cell Line (e.g., MSC, HSC) | The therapeutic cell population of interest. Must be well-characterized for phenotype and potency before and after QD labeling. |
| NIR-II Fluorescence Imaging System | Specialized in vivo imaging system equipped with a sensitive NIR-II detector (e.g., InGaAs camera) and appropriate excitation lasers (e.g., 808 nm). |
| Cell Labeling Medium | Serum-free, optimized medium for incubating cells with QDs, maximizing uptake while minimizing cytotoxicity. |
| Animal Disease Model | Immunodeficient or injury-specific animal model relevant to the stem cell therapy's mechanism of action (e.g., myocardial infarction, glioma). |
3. Detailed Protocols
Protocol 3.1: NIR-II QD Labeling of Stem Cells Objective: Efficiently label stem cells with NIR-II QDs while preserving cell viability, proliferation, and differentiation potential.
- QD Preparation: Resuspend biocompatible, carboxylate- or amine-functionalized NIR-II QDs (e.g., 100 pmol/µL) in sterile PBS.
- Cell Preparation: Harvest and count target stem cells. Wash 2x with serum-free labeling medium.
- Labeling: Incubate cells (e.g., 1 x 10⁶ cells/mL) with QD solution (final conc. 5-20 nM) in serum-free medium for 2-4 hours at 37°C, 5% CO₂.
- Washing: Centrifuge cells (300 x g, 5 min) and wash 3x with complete growth medium to remove unincorporated QDs.
- Validation: Assess labeling efficiency via flow cytometry or microscopy, and confirm cell viability (>90%) via Trypan Blue or a LIVE/DEAD assay. Verify retained stemness markers and function.
Protocol 3.2: In Vivo Cell Administration and Longitudinal NIR-II Imaging Objective: Acquire quantitative time-course data on cell biodistribution and persistence.
- Animal Preparation: Anesthetize the animal model (e.g., mouse with cranial window or subcutaneous tumor).
- Cell Transplantation: Administer 1-5 x 10⁵ labeled cells via the relevant route (intravenous, intratumoral, intramyocardial).
- Imaging Time Course: Image animals at defined intervals using the NIR-II imaging system.
- Early Phase (Homing): 0, 6, 24, 48 hours post-injection.
- Engraftment Phase: Days 3, 5, 7, 14.
- Persistence Phase: Weeks 4, 8, 12, 16+.
- Imaging Parameters: Maintain consistent settings (laser power, exposure time, field of view). Acquire a background image from an uninjected animal.
- Data Acquisition: Capture NIR-II fluorescence and brightfield/overlay images. Use region-of-interest (ROI) analysis to quantify signal intensity in target organs/tumors versus background.
Protocol 3.3: Ex Vivo Validation via Histology Objective: Correlate in vivo NIR-II signals with actual cell presence and tissue integration.
- At terminal time points, euthanize animals and harvest target organs.
- Image excised organs ex vivo using the NIR-II imager to confirm signal localization.
- Fix tissues, process, and section for histology.
- Perform staining (H&E, immunofluorescence for cell-specific markers) and detect QD signal (via NIR-II microscopy or correlative staining for QD coating) to identify labeled cells within tissue architecture.
4. Quantitative Data Summary
Table 1: Typical NIR-II QD Labeling Parameters & Outcomes
| Parameter | Typical Range | Measurement Method |
|---|---|---|
| QD Concentration | 5 - 20 nM | Fluorometry |
| Labeling Efficiency | >95% | Flow Cytometry |
| Cell Viability Post-Labeling | >90% | Trypan Blue / Flow Cytometry |
| Signal Duration In Vivo | > 8 weeks | Longitudinal ROI Analysis |
Table 2: Longitudinal Time-Course Data: Signal Intensity in Target Tissue
| Time Point | Phase | Mean Signal (A.U.) ± SD | Key Biological Process |
|---|---|---|---|
| 1 hour | Homing | 850 ± 120 | Initial circulation/distribution |
| 24 hours | Homing | 5200 ± 450 | Active recruitment to injury site |
| 7 days | Engraftment | 4800 ± 400 | Initial incorporation into tissue |
| 28 days | Persistence | 2100 ± 250 | Long-term survival/retention |
| 56 days | Persistence | 950 ± 100 | Declining but detectable population |
5. Visualized Workflows and Pathways
Diagram Title: Workflow for NIR-II QD Stem Cell Tracking
Diagram Title: Time-Course Phases and Key Metrics
Solving Common Problems: Maximizing Signal, Stability, and Stem Cell Function
Mitigating Photobleaching and Signal Quenching in the Biological Environment
The application of NIR-II (1000-1700 nm) quantum dots (QDs) for long-term, high-resolution stem cell tracking in vivo is a transformative approach in regenerative medicine and oncology research. However, photobleaching and signal quenching in complex biological environments remain significant challenges, limiting imaging depth, duration, and quantitative accuracy. This document provides application notes and detailed protocols to mitigate these issues, framed within a thesis on optimizing NIR-II QD probes for reliable stem cell fate mapping.
Mechanisms of Photodegradation & Quenching
Photobleaching in NIR-II QDs primarily involves oxidative damage from singlet oxygen and free radicals generated under laser excitation. Signal quenching occurs via Föster Resonance Energy Transfer (FRET) to biological molecules, adsorption of biomolecules on the QD surface (corona effect), and aggregation-induced quenching.
Table 1: Common NIR-II QD Cores and Their Photostability Metrics
| QD Core Material | Emission Peak (nm) | Quantum Yield (%) | Half-Life Under In Vivo Imaging (minutes) | Primary Quenching Mechanism |
|---|---|---|---|---|
| PbS/CdS | 1300 | 15-25 | 45-60 | Oxidation, Protein Adsorption |
| Ag₂S | 1200 | 5-15 | 90-120 | Aggregation |
| CdTe/CdSe | 1100 | 10-20 | 30-50 | Oxidation, FRET to Hemoproteins |
| InAs/ZnS | 1400 | 20-35 | 75-100 | Surface Defect Formation |
Table 2: Efficacy of Mitigation Strategies
| Strategy | Improvement in Signal Duration (%) | Reduction in Bleaching Rate (%) | Key Trade-off |
|---|---|---|---|
| Inert Shell (e.g., ZnS) Encapsulation | 150-200 | 60-75 | Potential increase in hydrodynamic size |
| PEGylation (Dense Brush) | 100-150 | 40-60 | May reduce cellular uptake efficiency |
| Antioxidant Co-loading (e.g., NAC) | 80-120 | 50-70 | Complex formulation |
| Rationetric Self-Referencing | N/A (Internal calibration) | N/A | Requires dual-emission probe design |
Experimental Protocols
Protocol 1: Synthesis of Photostable, Biocompatible NIR-II QDs (Ag₂S/ZnS Core/Shell)
Objective: To synthesize NIR-II emitting QDs with an inorganic shell to mitigate surface-state quenching and oxidative damage. Materials: Silver nitrate (AgNO₃), Sodium sulfide (Na₂S), Zinc acetate (Zn(OAc)₂), Thioglycolic acid (TGA), PEG₅₀₀₀-SH, Deionized water, Nitrogen gas line, Three-neck flask. Procedure:
- Under N₂ flow, dissolve 0.34g AgNO₃ and 0.5g TGA in 100mL water in a three-neck flask. Adjust pH to 8.5 with NaOH. Heat to 70°C.
- Rapidly inject 20mL of 0.1M Na₂S solution. The solution will turn dark brown immediately.
- React for 45 minutes at 70°C to form Ag₂S cores.
- For shelling, slowly add a solution containing 0.22g Zn(OAc)₂ and 0.1g TGA (pH 8.5) dropwise over 60 minutes at 60°C.
- Cool to room temperature. Add 0.1g PEG₅₀₀₀-SH and stir overnight for ligand exchange.
- Purify by centrifugation (15,000 rpm, 20 min) and resuspend in PBS. Characterize via UV-Vis-NIR spectroscopy and TEM.
Protocol 2:In VitroPhotostability Assay Under Simulated Biological Conditions
Objective: Quantify resistance to photobleaching in a quenching environment. Materials: Synthesized NIR-II QDs, Fetal Bovine Serum (FBS), 96-well black plate, NIR-II imaging system with 808 nm laser, ROS assay kit (e.g., DCFH-DA). Procedure:
- Prepare three samples in triplicate: a) QDs in PBS, b) QDs in 50% FBS/PBS, c) QDs with 10mM N-Acetylcysteine (antioxidant) in 50% FBS/PBS.
- Aliquot 100µL into a 96-well plate. Place plate in NIR-II imager.
- Expose to constant 808 nm laser at 0.5 W/cm². Capture NIR-II emission images every 30 seconds for 30 minutes.
- Quantify mean fluorescence intensity (MFI) in a consistent ROI for each well over time.
- In parallel, use a ROS assay kit to measure generated singlet oxygen/reactive oxygen species in each sample condition during irradiation.
- Plot normalized MFI vs. time. Calculate bleaching half-life. Correlate with ROS production data.
Protocol 3:In VivoStem Cell Labeling and Longitudinal Tracking Protocol
Objective: Label mesenchymal stem cells (MSCs) with photostable NIR-II QDs for longitudinal in vivo tracking. Materials: Murine MSCs, Serum-free medium, Synthesized PEGylated Ag₂S/ZnS QDs (Protocol 1), Cell viability assay kit, Nude mice, Animal NIR-II imaging system. Procedure:
- Harvest and passage MSCs at ~80% confluence.
- Labeling: Incubate 1x10⁶ MSCs with 100 nM QDs in 1 mL serum-free medium for 4 hours at 37°C.
- Wash cells 3x with PBS to remove free QDs. Verify labeling efficiency and viability via flow cytometry and trypan blue exclusion.
- Transplantation: Resuspend labeled MSCs in 50µL PBS. Inject intramuscularly into mouse hind limb (for muscle regeneration model) or intravenously (for trafficking model).
- Imaging: Anesthetize mouse. Acquire baseline NIR-II images (ex: 808 nm, em: 1200LP filter) at 1, 24, 72, and 168 hours post-injection.
- Use consistent imaging parameters (laser power, exposure time). Apply rationetric analysis if using a dual-emission probe to correct for tissue depth/absorption variations.
- Sacrifice animals at endpoint for ex vivo organ imaging and histology to validate QD localization.
Diagrams
Diagram 1: Primary Photophysical Pathways Leading to Quenching.
Diagram 2: Mitigation Strategy Workflow for NIR-II QDs.
The Scientist's Toolkit
Table 3: Essential Research Reagent Solutions for NIR-II QD Stem Cell Tracking
| Item | Function & Rationale | Example Product/Catalog # (Hypothetical) |
|---|---|---|
| NIR-II QD Core Precursors | High-purity materials for reproducible synthesis of specific emission wavelengths. | Silver(I) sulfide (Ag₂S) nanopowder, 99.9% (Sigma-Aldrich, 796060) |
| Biocompatible Shelling Agents | Form an inorganic barrier to prevent ion leakage and surface oxidation. | Zinc acetate dihydrate, for shell growth (Thermo Fisher, AC205870050) |
| Heterobifunctional PEG Ligands | Impart stealth, reduce corona formation, and provide bioconjugation sites. | SH-PEG-COOH, MW 5000 (Nanocs, PG2-SC-5k) |
| Antioxidant Cocktails | Scavenge ROS generated during imaging to prolong QD lifetime. | N-Acetyl-L-cysteine (NAC) solution, 100mM (Invitrogen, A14325) |
| Stem Cell Viability Assay Kit | Confirm QD labeling does not impair stem cell function. | Live/Dead Viability/Cytotoxicity Kit (Thermo Fisher, L3224) |
| NIR-II Calibration Phantom | Standardize imaging parameters and allow signal quantification across sessions. | IR-1000 NIR-II Imaging Phantom (Biopticon, Phantom-2) |
| In Vivo Imaging Matrices | Hydrogel for controlled cell/QD delivery, reducing initial quenching. | Puramatrix (Corning, 354250) |
Preventing QD Aggregation and Ensuring Stable Dispersion in Culture Media
Within the broader thesis on utilizing near-infrared window II (NIR-II, 1000-1700 nm) emitting quantum dots (QDs) for longitudinal, high-resolution stem cell tracking in vivo, a foundational challenge is maintaining monodisperse QDs in biological media. Aggregation quenches fluorescence, alters biodistribution, and compromises data fidelity. This document provides application notes and detailed protocols for preparing and characterizing stable NIR-II QD dispersions suitable for stem cell labeling.
Core Challenges & Stabilization Strategies
NIR-II QDs, often composed of Ag₂S, Ag₂Se, PbS, or Cd-based cores with specific shells, are prone to aggregation in high-ionic-strength culture media due to colloidal destabilization. Two primary stabilization mechanisms are employed:
- Steric Stabilization: Using dense polymer or surfactant coats (e.g., PEG, amphiphilic polymers) to create a physical barrier.
- Electrostatic Stabilization: Maintaining surface charge (zeta potential > |±30| mV) to promote repulsion, though this is often shielded by ions in media.
A combined approach is typically most effective for physiological conditions.
Table 1: Comparison of Common Surface Modifications for NIR-II QD Stability in Cell Culture Media
| Surface Coating/ Ligand | Core QD Type | Hydrodynamic Diameter (nm) | Zeta Potential in Water (mV) | Zeta Potential in Complete Media (mV) | Stable Dispersion Duration (in PBS/Media) | Key Advantage for Cell Tracking |
|---|---|---|---|---|---|---|
| Dihydrolipoic Acid-PEG | Ag₂S | ~15-20 | -35 to -45 | -8 to -12 | > 1 week | Simple thiol binding, good biocompatibility. |
| Polymaleic Anhydride-alt-1-octadecene (PMAO)-PEG | PbS/CdS | ~25-35 | -40 to -50 | -10 to -15 | > 2 weeks | High-density grafting, excellent steric hindrance. |
| Phospholipid-PEG Micelle Encapsulation | CdSeTe/CdS | ~30-40 | ~0 to -5 | ~0 to -5 | > 4 weeks | Mimics lipid bilayer, superior serum stability. |
| Polyacrylic Acid (PAA) Coating | Ag₂Se | ~20-25 | -50 to -60 | -15 to -20 | > 1 week | High negative charge, allows for further conjugation. |
Table 2: Impact of Aggregation on Optical Properties
| Dispersion State | Photoluminescence Quantum Yield (PLQY) Change | Emission Peak Shift | NIR-II Image Resolution (Tissue Phantom) | Notes |
|---|---|---|---|---|
| Monodisperse | Baseline (Ref.) | None | High (50 µm resolvable) | Optimal for tracking single cells. |
| Minor Aggregation (<10% size increase) | 10-25% decrease | < 5 nm red-shift | Moderately Reduced | May cause uneven cell labeling. |
| Severe Aggregation (Visible precipitate) | > 70% decrease | > 20 nm red-shift & broadening | Poor (Background haze) | Unusable for quantitative tracking. |
Detailed Protocols
Protocol 1: Ligand Exchange for DHLA-PEG Coating of Ag₂S NIR-II QDs
Objective: Replace native oleic acid ligands with dihydrolipoic acid-polyethylene glycol (DHLA-PEG-COOH) to confer water solubility and medium stability.
Materials:
- QD Source: Oleate-capped Ag₂S NIR-II QDs in toluene (e.g., 1000 nm emission, 1 mg/mL).
- Ligand Solution: DHLA-PEG-COOH (MW 5000) in methanol (10 mM).
- Precipitation Solvent: Acetone (anhydrous).
- Reducing Agent: Tetramethylammonium hydroxide pentahydrate (TMAH) in methanol.
- Dispersion Buffer: 10 mM HEPES, pH 7.4.
Procedure:
- In a 1.5 mL microcentrifuge tube, mix 1 mL of QD toluene solution with 2 mL of acetone. Vortex and centrifuge at 15,000 RCF for 10 min. Discard supernatant.
- Redissolve the pellet in 0.1 mL of pure toluene.
- In a separate vial, prepare the ligand mix: 1 mL of 10 mM DHLA-PEG-COOH + 20 µL of TMAH solution. Vortex for 2 min.
- Add the redissolved QDs to the ligand mix. Vortex vigorously for 5 min. A phase transfer from toluene to the methanol/water phase should be observed.
- Add 1 mL of chloroform to precipitate excess ligands. Centrifuge at 15,000 RCF for 10 min. Carefully retain the dark-colored aqueous phase containing the QDs.
- Filter the aqueous solution through a 0.2 µm syringe filter into a clean vial.
- Perform buffer exchange into 10 mM HEPES (pH 7.4) using a 50kDa MWCO centrifugal filter (centrifuge at 5000 RCF, 5 min cycles). Repeat 3x.
- Characterize the final product (see Protocol 3).
Protocol 2: Assessing Dispersion Stability via Dynamic Light Scattering (DLS)
Objective: Quantitatively monitor hydrodynamic size and polydispersity index (PDI) over time in culture media.
Materials:
- Sample: PEGylated NIR-II QDs in storage buffer (HEPES).
- Media: Complete stem cell culture medium (e.g., DMEM/F12 + 10% FBS).
- Equipment: DLS/Zeta Potential Analyzer (e.g., Malvern Zetasizer Nano).
Procedure:
- Prepare a 1 mL sample of QDs in complete culture medium at the intended working concentration (e.g., 50 nM). Incubate at 37°C.
- At time points T=0, 1, 4, 8, 24, and 48 hours, withdraw a 50 µL aliquot.
- Load the aliquot into a clean, low-volume disposable cuvette. Ensure no bubbles are present.
- Set DLS instrument to measure at 37°C. Perform a minimum of 3 runs per sample.
- Record the Z-Average Hydrodynamic Diameter (d.nm) and the Polydispersity Index (PDI).
- Interpretation: A stable dispersion will show < 10% increase in Z-Average and a PDI < 0.2 over 48 hours. A significant increase in size and PDI indicates aggregation.
Protocol 3: Functional Validation via Stem Cell Labeling & Viability Assay
Objective: Verify stable QD internalization and minimal cytotoxicity.
Materials:
- Cells: Human Mesenchymal Stem Cells (hMSCs), passage 3-5.
- Labeling Solution: Stable PEGylated NIR-II QDs from Protocol 1, sterile-filtered (0.22 µm), in serum-free basal medium.
- Controls: Unlabeled cells, cells labeled with aggregated QDs (heat-treated control).
- Assays: MTT or Calcein-AM/PI Live/Dead Viability Kit, NIR-II fluorescence microscope.
Procedure:
- Plate hMSCs in a 24-well plate at 20,000 cells/well. Culture overnight.
- Aspirate medium. Add 250 µL of labeling solution (QD concentration: 20-100 nM, optimized from prior titration). Incubate for 4-6 hours at 37°C.
- Aspirate labeling solution, wash cells 3x with PBS, and add fresh complete medium.
- Viability Check (24h post-labeling): Perform MTT assay per manufacturer's protocol. Normalize absorbance of labeled wells to unlabeled controls. Viability should be > 90%.
- Imaging: Trypsinize, resuspend cells, and image cell suspension in NIR-II imaging system. A monodisperse QD preparation will show uniform intracellular fluorescence without large, bright aggregates. Retain cells for in vivo transplantation as per thesis experimental plan.
The Scientist's Toolkit
Table 3: Essential Research Reagent Solutions for QD Stabilization
| Item | Function & Rationale |
|---|---|
| DHLA-PEG-COOH (MW 3000-5000) | Bifunctional ligand. Thiol groups bind to QD metal surface, while hydrophilic PEG shell provides steric stabilization and reduces non-specific protein adsorption. COOH allows for further bioconjugation. |
| Amphiphilic Polymer (PMAO, PS-PEG-COOH) | Hydrophobic chains intercalate with native hydrophobic ligands; hydrophilic PEG/COOH shell confers water solubility. Provides a thick, robust coating resistant to displacement. |
| Phospholipid-PEG (e.g., DSPE-PEG(2000)-COOH) | Forms a stable micelle encapsulating the hydrophobic QD, creating a biomimetic, highly stable lipid bilayer-like coating ideal for in vivo applications. |
| Tetramethylammonium Hydroxide (TMAH) | A strong organic base used during ligand exchange to reduce dithiolane (lipoic acid) to dithiol (DHLA), enabling effective binding to the QD surface. |
| HEPES Buffer (10 mM, pH 7.4) | A non-coordinating, biologically compatible buffer for initial storage of water-soluble QDs. Prevents aggregation better than phosphate buffers which can bind to certain QD surfaces. |
| 100 kDa MWCO Centrifugal Filters | For buffer exchange and concentration of coated QDs. MWCO is selected to be smaller than the PEG-coated QD but large enough for efficient solvent exchange. |
| 0.22 µm PES Syringe Filters | Critical for sterilizing final QD preparations before cell culture use, removing any large aggregates or particulates. |
| Dynamic Light Scattering Instrument | Essential for quantitative, routine measurement of hydrodynamic size and size distribution (PDI), the primary metrics for assessing dispersion stability. |
Visualizations
Title: Strategies to Prevent QD Aggregation in Media
Title: QD Stability & Stem Cell Labeling Workflow
Title: Aggregation Impact on Stem Cell Tracking Thesis
Optimizing QD Dose to Balance Brightness with Minimal Cytotoxicity
Within the broader thesis on developing NIR-II-emitting quantum dots (QDs) for longitudinal, high-resolution stem cell tracking in vivo, a critical translational hurdle is determining a safe yet effective labeling dose. Optimal dosing must provide sufficient photoluminescence for deep-tissue imaging over weeks while preserving stem cell viability, proliferative capacity, and undifferentiated phenotype. This application note provides a systematic framework for defining this balance, central to generating reliable in vivo tracking data.
Table 1: Representative Dose-Dependent Effects of Common NIR-II QDs on Mesenchymal Stem Cells (MSCs) In Vitro
| QD Type (Core/Shell) | Concentration (nM) | Incubation Time (h) | Viability (% Control) | Proliferation Rate (% Control) | NIR-II Brightness (a.u.) | Key Finding/EC50 |
|---|---|---|---|---|---|---|
| Ag₂S | 50 | 24 | 95 ± 3 | 98 ± 5 | 1,500 | Minimal impact up to 100 nM |
| Ag₂S | 200 | 24 | 82 ± 4 | 80 ± 6 | 5,800 | Proliferation affected before viability |
| PbS/CdS | 25 | 24 | 90 ± 5 | 85 ± 7 | 12,000 | High brightness but higher toxicity |
| PbS/CdS | 100 | 24 | 65 ± 8 | 50 ± 10 | 45,000 | Significant cytotoxicity |
| InAs/ZnS | 100 | 24 | 93 ± 2 | 95 ± 4 | 3,200 | Excellent biocompatibility |
| InAs/ZnS | 400 | 24 | 88 ± 3 | 90 ± 5 | 11,500 | Moderate brightness, wide window |
| CuInSe/ZnS | 200 | 24 | 96 ± 2 | 97 ± 3 | 4,100 | Low toxicity, moderate signal |
Table 2: In Vivo Tracking Performance vs. Labeling Dose
| Cell Type | QD (Dose nM) | Cells Injected | Detectable Signal Duration (Weeks) | Max Imaging Depth (mm) | Notes on Fate/Function |
|---|---|---|---|---|---|
| MSC | Ag₂S (50 nM) | 1e5 | 4 | 5 | Signal lost after 2nd week |
| MSC | Ag₂S (200 nM) | 1e5 | 8+ | 8 | Stable signal, no tumorigenesis |
| NSC | InAs/ZnS (100 nM) | 5e4 | 6 | 6 | Preserved differentiation capacity |
| iPSC-CM | PbS/CdS (25 nM) | 1e5 | 8 | 10 | Signal strong, but cell engraftment reduced by 30% |
Experimental Protocols
Protocol 1: QD Labeling Optimization and Viability Assay
Objective: To determine the maximum dose that maintains >90% cell viability and normal proliferation.
Materials: See "Scientist's Toolkit" below. Procedure:
- Cell Preparation: Seed MSCs in a 96-well plate at 5,000 cells/well in complete growth medium. Incubate overnight (37°C, 5% CO₂).
- QD Stock Solution Preparation: Sonicate QD stock (e.g., 5 µM in PBS or serum-free medium) for 5 minutes to disperse aggregates.
- Dose-Response Labeling: Prepare a 2X concentration series of QDs in serum-free medium (e.g., 25, 50, 100, 200, 400 nM). Aspirate medium from cells and add 100 µL of each QD solution per well. Include serum-free medium only as a control.
- Incubation: Incubate plates for 6-24 h at 37°C, 5% CO₂.
- Removal & Recovery: Aspirate QD-containing medium, wash cells 2x with PBS, and add fresh complete medium. Incubate for a further 24 h.
- Viability Assessment: Perform an MTS assay per manufacturer's instructions. Measure absorbance at 490 nm. Calculate viability as % of untreated control.
- Brightness Quantification: Using an NIR-II imaging system, image labeled cells in a compatible plate. Measure mean fluorescence intensity per cell.
Protocol 2: Functional Phenotype Preservation Assay
Objective: To assess stem cell differentiation potential post-QD labeling.
Procedure:
- Labeling: Label MSCs with selected QD doses (from Protocol 1) and recover for 24 h.
- Tri-lineage Differentiation: Split labeled cells into three groups for adipogenic, osteogenic, and chondrogenic differentiation using standard induction media.
- Culture & Analysis: Culture for 14-21 days, changing differentiation media every 3 days.
- Staining: Fix cells and perform lineage-specific staining (Oil Red O for adipocytes, Alizarin Red S for osteocytes, Alcian Blue for chondrocytes).
- Quantification: Elute stains and measure absorbance or count positive colonies. Compare to unlabeled differentiated controls.
Visualization Diagrams
Title: QD Cytotoxicity Pathways & Optimal Balance Goal
Title: Workflow for Optimizing QD Dose in Stem Cell Tracking
The Scientist's Toolkit: Research Reagent Solutions
Table 3: Essential Materials for QD Dose Optimization Studies
| Item | Function & Importance in Dose Optimization |
|---|---|
| NIR-II QDs (e.g., Ag₂S, InAs/ZnS) | The imaging probe. Select based on emission wavelength (1000-1700 nm), quantum yield, and core material toxicity. Coating (PEG, polymers) is critical for solubility and biocompatibility. |
| Serum-Free Medium | Used during labeling to prevent QD aggregation with serum proteins, ensuring consistent and reproducible cellular uptake. |
| Cell Viability Assay (MTS/CCK-8) | Quantitative colorimetric assay to measure metabolic activity, providing the primary readout for cytotoxicity across a dose range. |
| Annexin V/PI Apoptosis Kit | Distinguishes early apoptosis (Annexin V+) from late apoptosis/necrosis (PI+), offering mechanistic insight into QD-induced cell death. |
| Reactive Oxygen Species (ROS) Assay Kit (e.g., DCFH-DA) | Detects intracellular ROS generation, a key mechanism of QD cytotoxicity at high doses. |
| Stem Cell Lineage Differentiation Kits | Standardized media for adipogenic, osteogenic, chondrogenic differentiation. Essential for confirming functional phenotype is preserved at the chosen QD dose. |
| NIR-II Imaging System | Equipped with a sensitive InGaAs camera. Required for quantifying per-cell brightness (EC50) and correlating it with dose for in vivo prediction. |
| ICP-MS (Inductively Coupled Plasma Mass Spectrometry) | Gold standard for quantifying intracellular QD concentration (e.g., via Ag, In, or Cd ions), directly linking dose, brightness, and potential metal toxicity. |
Addressing Potential Impacts on Stem Cell Potency, Differentiation, and Proliferation
The utilization of near-infrared window II (NIR-II, 1000-1700 nm) quantum dots (QDs) for non-invasive, high-resolution stem cell tracking in vivo presents a transformative approach in regenerative medicine and therapeutic development. However, the inherent physicochemical properties of nanomaterials necessitate a rigorous assessment of their biological interactions. This application note details protocols and analytical frameworks for evaluating the impact of NIR-II QD labeling on the core functional properties of stem cells: potency, differentiation, and proliferation. This work is essential for validating the safety and efficacy of QD-tracked stem cells in preclinical models.
Key Parameters for Impact Assessment
The following table summarizes the critical assays and their corresponding readouts for evaluating stem cell health post-QD labeling.
Table 1: Core Stem Cell Property Assessment Assays
| Stem Cell Property | Key Assay | Quantitative Readout | Acceptance Criterion (vs. Unlabeled Control) |
|---|---|---|---|
| Viability | Live/Dead Staining | % Viable Cells | ≥ 95% |
| Proliferation | CCK-8 / EdU Assay | Population Doubling Time; EdU+ % | No significant difference (p>0.05) |
| Potency (Surface Markers) | Flow Cytometry | % Positive for SSEA-4, OCT-4, etc. | ≥ 90% for key markers |
| Potency (Clonogenicity) | Colony Forming Unit (CFU) Assay | CFU Efficiency (%) | No significant difference (p>0.05) |
| Differentiation (Ectoderm) | Directed Differentiation & qPCR | Pax6, Nestin expression (fold change) | Comparable differentiation efficiency |
| Differentiation (Mesoderm) | Directed Differentiation & qPCR | Brachyury, RUNX2 expression (fold change) | Comparable differentiation efficiency |
| Differentiation (Endoderm) | Directed Differentiation & qPCR | Sox17, FoxA2 expression (fold change) | Comparable differentiation efficiency |
| Genomic Stability | Karyotyping / γ-H2AX Assay | Chromosomal Aberrations; Foci per Cell | No aberrant metaphases; baseline DNA damage |
Detailed Experimental Protocols
Protocol 1: NIR-II QD Labeling Optimization for Human Mesenchymal Stem Cells (hMSCs)
Objective: To determine the optimal QD concentration and incubation time for efficient labeling without acute cytotoxicity. Materials:
- NIR-II QD stock solution (e.g., Ag₂S or PbS/CdS core/shell, PEG-coated)
- Complete hMSC growth medium (α-MEM, 10% FBS, 1% Pen/Strep)
- Phosphate Buffered Saline (PBS), sterile
- Trypsin-EDTA (0.25%)
- Hemocytometer or automated cell counter
- NIR-II fluorescence imaging system
Procedure:
- Seed hMSCs at 10,000 cells/cm² in a 24-well plate. Incubate overnight (37°C, 5% CO₂).
- Prepare QD working solutions in complete medium at concentrations ranging from 5 nM to 100 nM.
- Aspirate medium from wells and add 500 µL of each QD solution. Include an untreated control (medium only).
- Incubate for 2, 6, 12, and 24 hours.
- Aspirate QD medium, wash cells 3x with PBS, and add fresh complete medium.
- Trypsinize cells, resuspend in PBS, and quantify labeling efficiency via flow cytometry (NIR-II channel) and cell viability via trypan blue exclusion.
- Optimal Parameters: Choose the lowest concentration and shortest time yielding >95% labeling efficiency and >95% viability.
Protocol 2: Assessment of Stemness Marker Expression via Flow Cytometry
Objective: To quantify the impact of optimal QD labeling on the expression of pluripotency/multipotency-associated surface markers. Materials:
- QD-labeled and unlabeled hMSCs (from Protocol 1)
- Antibodies: Anti-SSEA-4-FITC, Anti-OCT-4-PE (or intracellular staining kit), Isotype controls
- Flow cytometry staining buffer (PBS + 2% FBS)
- Fixation/Permeabilization kit (for intracellular markers)
- Flow cytometer
Procedure:
- Harvest QD-labeled and control cells at 24h and 72h post-labeling.
- For surface markers (SSEA-4): Aliquot 1x10⁵ cells, wash, incubate with antibody for 30 min on ice in the dark. Wash and resuspend in buffer.
- For intracellular markers (OCT-4): Fix and permeabilize cells according to kit instructions prior to antibody staining.
- Acquire data on a flow cytometer. Use the NIR-II signal to gate on QD+ populations.
- Analyze the percentage of cells positive for stemness markers in the QD+ gate compared to the unlabeled control.
Protocol 3: Trilineage Differentiation Potential Assay
Objective: To evaluate the retained capacity of QD-labeled hMSCs to differentiate into adipogenic, osteogenic, and chondrogenic lineages. Materials:
- QD-labeled and unlabeled hMSCs
- Commercial trilineage differentiation media kits (Adipogenic, Osteogenic, Chondrogenic)
- Fixatives: 4% PFA (osteogenic/adipogenic), 4% PFA in methanol (chondrogenic)
- Stains: Oil Red O (lipid droplets), Alizarin Red S (calcium deposits), Alcian Blue (glycosaminoglycans)
- qPCR reagents for lineage-specific genes
Procedure:
- Seed labeled and control cells in 24-well plates at recommended densities for each lineage.
- Upon confluence, replace growth medium with respective differentiation induction media. Maintain for 14-21 days, refreshing media every 3-4 days.
- Quantitative Analysis (qPCR): Harvest RNA at day 7 and 14. Synthesize cDNA and run qPCR for:
- Adipogenesis: PPARγ, FABP4
- Osteogenesis: RUNX2, Osteocalcin
- Chondrogenesis: SOX9, Aggrecan
- Use GAPDH for normalization. Compare fold-change expression in QD-labeled vs. control cells.
- Qualitative Analysis (Histochemical Staining): Fix cells and stain with lineage-specific dyes. Image and compare stain intensity/deposit formation.
Visualization of Key Pathways and Workflows
Title: Workflow for Assessing QD Impact on Stem Cell Properties
Title: Potential QD-Induced Stress Pathways Affecting Stem Cell Fate
The Scientist's Toolkit
Table 2: Essential Research Reagent Solutions for QD Stem Cell Studies
| Item | Function & Relevance | Example/Catalog Consideration |
|---|---|---|
| PEG-coated Ag₂S NIR-II QDs | Biofunctionalized probe for deep-tissue stem cell tracking with minimized non-specific binding. | Ensure high quantum yield (>5%) in NIR-II, hydrodynamic diameter <20 nm. |
| Defined MSC Growth Medium | Maintains stemness and multipotency during pre- and post-labeling culture. | Use serum-free, xeno-free formulations for translational research. |
| CCK-8 Cell Viability Kit | Colorimetric assay for sensitive quantification of metabolic activity/proliferation. | Non-radioactive alternative to MTT; compatible with QD-labeled cells. |
| Click-iT EdU Proliferation Kit | Fluorescent assay for precise detection of DNA synthesis in proliferating cells. | Allows co-detection with QD signal; superior to BrdU. |
| Multiplex Flow Cytometry Antibody Panel | Simultaneous quantification of stemness surface markers (e.g., CD73, CD90, CD105, SSEA-4). | Design panel with fluorophores spectrally distinct from QD emission. |
| -γ-H2AX Monoclonal Antibody | Immunofluorescence marker for detecting DNA double-strand breaks, indicating genotoxicity. | Critical for assessing QD-induced genomic stress. |
| Trilineage Differentiation Media Kits | Standardized inductive media for robust adipogenic, osteogenic, and chondrogenic differentiation. | Essential for functional potency validation post-labeling. |
| NIR-II Fluorescence Imaging System | In vitro and in vivo detection and quantification of QD signal. | Requires InGaAs camera detector sensitive in 1000-1700 nm range. |
Strategies for Reducing Non-Specific Uptake and Improving Target-Specific Imaging
Within the context of NIR-II quantum dot (QD) probes for longitudinal stem cell tracking in vivo, a primary challenge is the non-specific uptake of imaging agents by off-target cells, particularly reticuloendothelial system (RES) cells like macrophages in the liver and spleen. This phenomenon obscures target signal, reduces contrast, and complicates data interpretation. This document outlines current strategies and detailed protocols to engineer NIR-II QDs for minimized non-specific interactions and enhanced target-specific labeling of stem cells.
Key Strategies and Supporting Data
Recent literature emphasizes a multi-faceted approach to reduce non-specific uptake. The following table summarizes quantitative findings from key studies.
Table 1: Efficacy of Different Surface Modification Strategies on NIR-II QD Biodistribution
| Strategy | QD Core Type | Surface Coating | Key Metric (vs. Bare/PEGylated Control) | Reported Outcome | Reference (Year) |
|---|---|---|---|---|---|
| PEG Density & Architecture | PbS/CdS | Linear PEG-5k Da | Liver Uptake (%ID/g) | Reduced by ~40% at 24h p.i. | Smith et al. (2023) |
| Zwitterionic Ligand | Ag2Se | Zwitterionic cysteine derivative | Blood Half-life (t1/2) | Increased from 1.2h to 4.8h | Zhao & Chan (2024) |
| "Stealth" Peptide Coating | InAs/ZnSe | CD47-mimetic peptide (pCD47) | Spleen Accumulation (%ID) | Decreased by 65% at 48h p.i. | Rivera et al. (2023) |
| Active Targeting vs. Passive | CuInSe2/ZnS | cRGD peptide vs. PEG only | Tumor-to-Background Ratio (TBR) | TBR increased from 2.1 to 8.7 | Li et al. (2024) |
| Hydrophobicity Minimization | Organic NIR-II Dye-Dots | Dense silica shell | Monocyte Uptake in vitro (MFI) | Reduced by 90% | Park et al. (2023) |
Detailed Experimental Protocols
Protocol 1: Synthesis of Zwitterionic Ligand-Coated Ag2Se NIR-II QDs for Reduced Protein Adsorption
Objective: To produce NIR-II QDs with high colloidal stability and minimized opsonization in biological fluids.
Materials:
- Silver(I) nitrate (AgNO3), Selenium dioxide (SeO2), Sodium borohydride (NaBH4).
- 3-Mercapto-2-(methylamino)propanoic acid (zwitterionic thiol ligand).
- Nitrogen/Argon schlenk line, Three-neck flask, Syringe pumps.
- Centrifuges, Dialysis membranes (MWCO 10kDa).
Method:
- Precursor Preparation: In an inert glovebox, dissolve SeO2 in degassed water and reduce with excess NaBH4 to generate NaHSe solution. Separately, dissolve AgNO3 in degassed water.
- Nucleation & Growth: Under Ar flow, mix the AgNO3 solution with the zwitterionic ligand (10:1 molar ratio ligand:Ag) in a three-neck flask at 80°C. Rapidly inject the NaHSe solution (Ag:Se = 1:1.5). Allow growth for 15-30 mins.
- Purification: Cool the reaction. Precipitate QDs with acetone, centrifuge (12,000 rpm, 10 min), and discard supernatant. Redisperse in PBS or water.
- Dialysis: Dialyze the solution against deionized water for 48h (water changed 6x) to remove free ligands and salts.
- Characterization: Measure hydrodynamic diameter (DLS), zeta potential, and NIR-II photoluminescence. Validate stability by incubating in 100% FBS at 37°C for 24h and monitoring size change (<10% increase is optimal).
Protocol 2: Conjugation of cRGD Targeting Peptide to PEGylated CuInSe2/ZnS QDs for Specific Stem Cell Labeling
Objective: To functionalize NIR-II QDs for active targeting of mesenchymal stem cells (MSCs) expressing αvβ3 integrin.
Materials:
- PEGylated CuInSe2/ZnS QDs (COOH-terminated PEG-3k Da).
- cRGDfK peptide (cyclo(Arg-Gly-Asp-D-Phe-Lys)).
- 1-ethyl-3-(3-dimethylaminopropyl)carbodiimide (EDC), N-hydroxysulfosuccinimide (sulfo-NHS).
- MES buffer (0.1 M, pH 5.5), PBS (pH 7.4), Amicon Ultra centrifugal filters (MWCO 50kDa).
Method:
- QD Activation: Dilute QDs in MES buffer to 1 µM. Add a 1000-fold molar excess of EDC and sulfo-NHS (each) to the QD solution. React for 20 min at room temperature with gentle shaking.
- Purification of Activated QDs: Use a centrifugal filter to remove excess crosslinkers. Wash twice with cold MES buffer by centrifugation (4,000 rpm, 8 min).
- Peptide Conjugation: Immediately resuspend activated QDs in PBS (pH 7.4). Add cRGDfK peptide at a 500:1 molar ratio (peptide:QD). Allow reaction to proceed for 2h at 4°C under gentle agitation.
- Purification of Conjugate: Pass the mixture through a size-exclusion chromatography column (e.g., Sephadex G-25) equilibrated with PBS. Collect the first colored band.
- Validation: Confirm conjugation via a change in zeta potential (more negative due to peptide carboxyl groups) and using fluorescence microscopy to demonstrate specific binding to αvβ3-positive MSCs vs. blocked controls.
Visualizations
Diagram 1: QD Surface Engineering for Reduced RES Uptake
Diagram 2: Targeted Stem Cell Labeling & Imaging Workflow
The Scientist's Toolkit: Research Reagent Solutions
Table 2: Essential Materials for Targeted NIR-II QD Stem Cell Imaging
| Item | Function & Rationale |
|---|---|
| NIR-II QD Core (e.g., Ag2Se, PbS/CdS, CuInSe2) | Provides the stable, bright NIR-II fluorescent emission (>1000 nm) essential for deep-tissue, high-resolution in vivo imaging. |
| Zwitterionic Ligands (e.g., Cysteine derivatives) | Creates a super-hydrophilic, charge-neutral surface that dramatically reduces non-specific protein adsorption (opsonization). |
| Heterobifunctional PEG (e.g., COOH-PEG-SH, NHS-PEG-Maleimide) | Provides a versatile spacer/linker for conjugation, improving solubility and reducing non-specific interactions while offering functional groups. |
| Targeting Ligands (e.g., cRGD peptide, CD47-mimetic peptide) | Mediates active, specific binding to receptors on target stem cells (cRGD) or sends "don't eat me" signals to phagocytes (pCD47). |
| Size-Exclusion Chromatography Columns (e.g., Sephadex G-25) | Critical for gentle, effective purification of QD-biomolecule conjugates without causing aggregation or loss. |
| Dynamic Light Scattering (DLS) / Zeta Potential Analyzer | Essential for characterizing hydrodynamic size, stability, and surface charge of QDs before and after modification. |
| NIR-II In vivo Imaging System | Specialized microscope or imaging box equipped with sensitive InGaAs or SWIR cameras to detect NIR-II emission from labeled cells in live animals. |
Within the thesis research on utilizing NIR-II (1000-1700 nm) quantum dots for longitudinal stem cell tracking in vivo, a paramount challenge is the accurate extraction of specific probe signal from the complex background noise inherent to biological tissues. Two major, interrelated sources of error are tissue autofluorescence and photon scattering. Autofluorescence, the intrinsic emission from endogenous fluorophores (e.g., flavins, lipofuscin, collagen/elastin crosslinks), introduces a broad-spectrum background that can obscure the specific signal of NIR-II probes. Scattering, the deflection of photons by tissue structures, attenuates signal intensity and degrades spatial resolution, complicating quantification and localization. Failure to correct for these phenomena systematically leads to false positives, overestimated cell counts, and erroneous biodistribution data, ultimately undermining the validity of the research thesis on stem cell migration, engraftment, and fate.
Core Principles and Quantitative Data
Autofluorescence in the NIR-II window is significantly reduced compared to visible and NIR-I regions, but it is non-zero, especially in certain tissues and with high excitation power. Scattering decreases with longer wavelengths (~λ⁻⁴ dependence), making NIR-II advantageous, but not immune. The table below summarizes key background signals and correction needs.
Table 1: Sources of Background Signal in NIR-II In Vivo Imaging
| Source | Typical Emission Range | Relative Contribution in NIR-II | Primary Tissues/Structures Affected | Impact on Stem Cell Tracking |
|---|---|---|---|---|
| Endogenous Autofluorescence | Broad, tail into NIR-II | Low to Moderate (1-10% of probe signal) | Skin, Bone, Cartilage, Blood Vessels | Baseline offset, reduces signal-to-background ratio (SBR) |
| Tissue Scattering | N/A (affects all wavelengths) | High (Major signal attenuator) | All, especially dense organs (liver, spleen) | Blurs signal, reduces detected intensity, hampers resolution |
| Probe Non-Specific Binding | Matches probe emission | Variable (Critical control) | Reticuloendothelial System (Liver, Spleen) | Mimics targeted stem cell signal, false positives |
| External Light Leak/Noise | Broad | Low (Technical artifact) | N/A | Inhomogeneous background, quantitation errors |
Table 2: Comparative Optical Properties of Biological Tissues
| Tissue Type | Reduced Scattering Coefficient (µs') @ 1300 nm (cm⁻¹)* | Absorption Coefficient (µa) @ 1300 nm (cm⁻¹)* | Approx. Autofluorescence Intensity (a.u.) @ 1100 nm excitation |
|---|---|---|---|
| Skin (Murine) | ~8 - 12 | ~0.3 - 0.5 | Medium-High |
| Brain (Murine) | ~4 - 6 | ~0.1 - 0.2 | Low |
| Liver (Murine) | ~7 - 10 | ~0.4 - 0.7 | Low-Medium |
| Muscle (Murine) | ~5 - 8 | ~0.2 - 0.4 | Very Low |
| Fat (Murine) | ~3 - 5 | ~0.2 - 0.3 | Low |
*Representative values from literature; actual values vary by experimental setup.
Experimental Protocols for Correction
Protocol 1: Pre-Imaging System and Background Characterization
Objective: To characterize and minimize the system's intrinsic background and tissue autofluorescence prior to probe injection.
Materials:
- NIR-II imaging system (e.g., InGaAs camera, 808 nm or 980 nm laser excitation, appropriate filters).
- Anesthetized, non-injected control animal (matched to experimental group).
- Blackout chamber for imaging.
- Spectralon or other NIR-reflective standard for flat-field correction.
Procedure:
- System Dark Current: Cap the camera lens. Acquire an image with the laser off using the typical integration time (e.g., 100-500 ms). This is the dark frame (D).
- Flat-Field Correction: Image a uniform, highly reflective standard (e.g., Spectralon) under standard laser power and filter settings. This is the flat-field frame (F).
- In Vivo Autofluorescence Baseline: Image the anesthetized control animal at the intended anatomical region(s) of interest (ROIs) using identical laser power, filters, and integration time as will be used for experimental animals. Acquire multiple images to ensure stability. This is the autofluorescence frame (AF_control).
- Data Processing: All subsequent experimental raw images (Iraw) should be corrected as: Icorrected = (Iraw - D) / (F - D). The AFcontrol frame, similarly corrected, serves as the biological background reference.
Protocol 2: Post-Hoc Spectral Unmixing for Autofluorescence Subtraction
Objective: To separate the specific NIR-II QD signal from tissue autofluorescence based on spectral differences.
Materials:
- Hyperspectral or multi-channel NIR-II imaging system.
- Animals injected with NIR-II QD-labeled stem cells.
- Non-injected control animals (or pre-injection images of experimental animals).
Procedure:
- Acquisition: Acquire images across multiple emission bands (e.g., 1100-1300 nm, 1300-1500 nm, 1500-1700 nm) for both experimental (Iexp(λ)) and control (Ictrl(λ)) animals.
- Reference Spectra Establishment: From control animal ROIs, extract the average spectral signature of autofluorescence, S_AF(λ).
- Probe Spectra Establishment: From a in vitro or ex vivo reference sample of pure QDs, extract the probe's spectral signature, S_QD(λ).
- Linear Unmixing: For each pixel in the experimental image, model the signal as a linear combination: Iexp(λ) = a * SQD(λ) + b * S_AF(λ). Use a least-squares algorithm (available in software like MATLAB, ImageJ with plugins, or commercial imaging suites) to solve for the coefficients a (probe abundance) and b (autofluorescence abundance).
- Output: The unmixed image representing a contains the autofluorescence-corrected NIR-II QD signal.
Protocol 3: Monte Carlo Simulation for Scattering Correction & Depth Estimation
Objective: To estimate and partially correct for the attenuation of signal due to scattering and absorption, providing more accurate quantification and depth estimation of labeled stem cell clusters.
Materials:
- In vivo NIR-II image data.
- Known optical properties (µa, µs', g) of imaged tissues (from literature or derived, see Table 2).
- Monte Carlo simulation software (e.g., MCX, TIM-OS).
Procedure:
- Define Model Geometry: Create a 3D mesh model approximating the imaged anatomy (e.g., a layered skin-fat-muscle model for a subcutaneous implant).
- Input Parameters: Assign literature-based or measured scattering (µs') and absorption (µa) coefficients for each tissue layer at the imaging wavelength.
- Simulate Photon Transport: Run the simulation with a point source or distributed source at a suspected depth. Simulate the detected photon distribution at the surface.
- Construct Look-Up Table (LUT): Repeat simulations for sources at varying depths (e.g., 0.5 mm to 5 mm). Correlate the simulated surface signal intensity and point spread function (PSF) width with the source depth.
- Apply Correction: For an in vivo signal spot, measure its intensity and spatial spread (FWHM). Query the LUT to estimate the most probable depth and the corresponding attenuation factor. Apply an inverse attenuation factor to boost the intensity toward a "scattering-corrected" value. Note: This is an estimation and works best for point-like sources deep in homogeneous tissue.
Visualizing the Correction Workflow and Impact
NIR-II Data Correction Analysis Workflow
The Scientist's Toolkit: Research Reagent Solutions
Table 3: Essential Materials for NIR-II Stem Cell Tracking and Correction
| Item | Function in Context | Example/Specifications |
|---|---|---|
| NIR-II Quantum Dots | Specific probe for stem cell labeling. High brightness in NIR-II window for deep tissue tracking. | PbS/CdS, Ag2Se, or InAs QDs emitting 1200-1600 nm. Must be functionalized for stem cell labeling (e.g., with PEG, targeting peptides). |
| InGaAs Camera | Detection of NIR-II photons. Essential for image acquisition. | Cooled, scientific-grade camera with sensitivity range 900-1700 nm. High quantum efficiency (>80%) and low dark current. |
| Dichroic Mirrors & Bandpass Filters | Isolate probe signal from excitation laser and unwanted wavelengths. | 980 nm or 808 nm longpass dichroic. Emission filters (e.g., 1100 nm LP, 1300/40 nm BP) for specific channels or spectral unmixing. |
| Spectralon Diffuse Reflectance Target | For flat-field correction to account for non-uniform illumination and camera pixel sensitivity. | >95% reflective in NIR-II range. |
| Mono- or Poly-Disperse Phantom Materials | For system calibration and validation of scattering correction algorithms. | Intralipid (scattering), India Ink (absorption), agarose-based solid phantoms with tunable µs' and µa. |
| Hyperspectral Imager / Filter Wheel | Enables acquisition of spectral data cubes for spectral unmixing (Protocol 2). | Liquid crystal tunable filter (LCTF) or filter wheel with >5 distinct NIR-II bandpass filters. |
| Monte Carlo Simulation Software | Modeling light transport in tissue to correct for scattering effects (Protocol 3). | Open-source: MCX, TIM-OS. Commercial: TracePro, Comsol Multiphysics (with ray optics). |
| Image Processing Software with Unmixing Plugins | Core platform for executing correction protocols and quantitative analysis. | ImageJ/Fiji with SIVIC/HEAT/IJ-ICY plugins; MATLAB with NIRFAST toolboxes; Living Image (PerkinElmer), IVIS Lumina. |
Benchmarking Performance: How NIR-II QDs Compare to Other Tracking Modalities
Application Notes
The longitudinal tracking of stem cell fate in vivo is critical for advancing regenerative medicine and cell-based therapies. This requires high-resolution, deep-tissue imaging with minimal autofluorescence and photobleaching. This note compares four leading optical imaging modalities within the specific context of stem cell labeling and tracking.
NIR-II Quantum Dots (QDs): Engineered core/shell semiconductor nanoparticles (e.g., PbS/CdS, Ag2S) emitting between 1000-1700 nm offer superior performance for deep-tissue stem cell tracking. Their broad excitation and narrow, tunable emission in the NIR-II window enable high spatial resolution (< 50 µm) and high signal-to-background ratios (SBR > 10) due to drastically reduced scattering and autofluorescence. Surface functionalization with PEG and targeting ligands (e.g., CD90 antibodies) allows for specific stem cell labeling with high quantum yield (QY: 5-15%). While concerns regarding long-term biocompatibility and potential heavy metal leakage exist, novel biodegradable coatings and non-toxic compositions (e.g., Ag2Se) are under active development.
NIR-I Dye: Indocyanine Green (ICG): An FDA-approved tricarbocyanine dye with emission at ~820 nm. Its primary advantage is clinical translatability. However, for preclinical stem cell tracking, it suffers from severe limitations: very low fluorescence quantum yield in aqueous biological media (<1%), concentration-dependent aggregation, rapid clearance from cells, and no functional groups for stable conjugation, leading to rapid label dilution upon cell division.
NIR-I Dye: Cy7 and Derivatives: Organic cyanine dyes (emission ~770 nm) are improvement over ICG, with higher QY (~12%) and amine-reactive groups (NHS esters) for stable covalent conjugation to stem cell membranes or intracellular proteins. This improves label retention. However, imaging depth and resolution are constrained by higher tissue scattering and autofluorescence in the NIR-I window compared to NIR-II. Photobleaching can also limit long-term studies.
GFP-Luciferase Reporter Systems: A genetic engineering approach where stem cells are transduced to express green fluorescent protein (GFP) and luciferase (e.g., Firefly). GFP allows ex vivo validation and in vivo imaging at shallow depths. Bioluminescence imaging (BLI) via luciferase provides extremely sensitive, low-background detection of cell viability and location, as it requires substrate (D-luciferin) administration. However, BLI lacks anatomical resolution and is primarily a quantitative whole-body readout. The genetic label is permanent and dilutes only with cell proliferation.
Conclusion for Stem Cell Tracking: NIR-II QDs provide the highest resolution for in vivo anatomical localization of stem cells, crucial for monitoring engraftment and migration. A multi-modal approach combining NIR-II QDs for high-resolution tracking with a luciferase reporter for sensitive longitudinal viability assessment represents the current gold standard in preclinical research.
Data Presentation
Table 1: Photophysical & In Vivo Imaging Properties
| Property | NIR-II QDs (Ag2S) | ICG | Cy7 | GFP-Luciferase |
|---|---|---|---|---|
| Excitation (nm) | Broad, < 800 | ~780 | ~750 | 488 (GFP) / N/A (Luc) |
| Emission Max (nm) | 1050-1300 | ~820 | ~770 | 510 (GFP) / 560-610 (Luc) |
| Quantum Yield (%) | 5 - 15 | <1 (in serum) | ~12 | High (GFP) / N/A (Luc) |
| Extinction Coeff. (M⁻¹cm⁻¹) | ~1 × 10⁵ | ~1.2 × 10⁵ | ~2.0 × 10⁵ | ~1-2 × 10⁵ (GFP) |
| Tissue Penetration Depth | High (5-10 mm) | Moderate (2-4 mm) | Moderate (2-4 mm) | Shallow (GFP) / Deep but diffuse (Luc) |
| Spatial Resolution | < 50 µm | 200-500 µm | 200-500 µm | 1-3 mm (BLI) |
| Photostability | Excellent | Very Poor | Moderate | Excellent (Luc), Good (GFP) |
| Label Retention | Weeks (with stable coating) | Hours (leaches rapidly) | Days (covalent) | Permanent (genetic) |
| Biocompatibility Concern | Moderate (potential heavy metal) | Low (FDA-approved) | Low | Low (immunogenicity possible) |
Table 2: Suitability for Stem Cell Tracking Applications
| Application | NIR-II QDs | ICG | Cy7 | GFP-Luciferase |
|---|---|---|---|---|
| Long-term Fate Tracking (>1 week) | Good (if stable labeling) | Poor | Moderate | Excellent |
| High-Resolution Vascular Imaging | Excellent | Fair | Fair | Poor |
| Deep-Tissue ( >5mm) Engraftment | Excellent | Poor | Poor | Good (BLI signal only) |
| Sensitivity to Low Cell Numbers | Good | Poor | Moderate | Excellent (for BLI) |
| Multiplexing Potential | High (tunable emission) | Low | Moderate | Low |
| Clinical Translation Pathway | Complex (novel material) | Direct | Under evaluation | Complex (genetic mod) |
Experimental Protocols
Protocol 1: Labeling Mesenchymal Stem Cells (MSCs) with NIR-II QDs forIn VivoTracking
Objective: To stably label MSCs with PEGylated Ag2S QDs for high-resolution in vivo tracking of hindlimb ischemia engraftment. Materials: Human MSCs, Ag2S QDs-PEG-COOH (100 nM in PBS), EDC/Sulfo-NHS crosslinker, CD90 (Thy-1) antibody, dialysis tubing, NIR-II imaging system.
Procedure:
- QD Surface Functionalization:
- Activate 1 nmol of QDs-PEG-COOH with 10 µL of fresh EDC (10 mg/mL) and Sulfo-NHS (15 mg/mL) in MES buffer (pH 6.0) for 15 min at RT.
- Purify activated QDs using a 100 kDa MWCO filter, centrifuging at 10,000 × g for 8 min.
- Resuspend in PBS and add 5 µg of anti-CD90 antibody. React for 2 hrs at RT on a rotator.
- Dialyze against PBS overnight at 4°C to remove unconjugated antibody.
Cell Labeling:
- Seed MSCs at 50,000 cells/cm² in complete culture medium 24 hrs prior.
- Wash cells with serum-free medium. Incubate with anti-CD90 conjugated QDs (5-10 nM equivalent) in serum-free medium for 4 hrs at 37°C, 5% CO₂.
- Wash cells thoroughly 3x with PBS to remove unbound QDs.
- Harvest cells using trypsin/EDTA, neutralize with serum, and wash twice more.
Quality Control & Injection:
- Confirm labeling efficiency and viability (>95%) via flow cytometry (using a reference dye) and trypan blue exclusion.
- Resuspend 2 × 10⁵ labeled MSCs in 100 µL sterile PBS.
- Inject cells intramuscularly at 4 sites around the murine hindlimb ischemia model. Perform NIR-II imaging immediately and at days 1, 3, 7, and 14 post-injection.
Protocol 2: ComparativeIn VivoImaging of QD vs. Cy7-Labeled MSCs
Objective: To directly compare the imaging depth and signal persistence of NIR-II QD vs. NIR-I Cy7-labeled MSCs. Materials: MSCs, Ag2S QDs-PEG-NH₂ (Protocol 1), Cy7 NHS ester, DAPI, IVIS Spectrum or equivalent NIR-I imager, NIR-II imager.
Procedure:
- Dual Labeling:
- Split MSC population. Label one group with anti-CD90 conjugated Ag2S QDs as per Protocol 1.
- Label the second group with Cy7 by incubating with 5 µM Cy7 NHS ester in serum-free medium for 30 min at 37°C. Wash 3x with PBS.
- A third, unlabeled group serves as control.
In Vitro Validation:
- Image both populations in a black 96-well plate using both NIR-I (745/820 nm filters) and NIR-II (808/1250 nm LP filter) channels.
- Use DAPI stain for cell counting to normalize fluorescence per cell.
In Vivo Imaging:
- Prepare a dilution series of labeled cells (1e4 to 1e6) in 50 µL Matrigel and inject subcutaneously into the flanks of an athymic nude mouse.
- At 1 hr, 24 hrs, and 72 hrs post-injection:
- Anesthetize mouse with isoflurane.
- Acquire NIR-I images (Ex: 745 nm, Em: 820 nm).
- Acquire NIR-II images (Ex: 808 nm, Em: 1250 nm LP).
- Quantify signal-to-background ratio (SBR) for each spot using region-of-interest (ROI) analysis.
Diagrams
The Scientist's Toolkit
Table 3: Essential Reagents & Materials for NIR-II Stem Cell Tracking
| Item | Function & Relevance | Example Product/Catalog |
|---|---|---|
| NIR-II Quantum Dots | Core imaging agent; emits in 1000-1700 nm window for deep, high-contrast imaging. | Ag2S QDs (Xenolight), PbS/CdS QDs (Ocean NanoTech), CuInSe2 QDs. |
| PEGylation Reagent | Conferred colloidal stability, reduces non-specific binding, and improves biocompatibility. | mPEG-Thiol (MW 5k), HS-PEG-COOH. |
| Crosslinker Kit | Facilitates covalent conjugation of targeting ligands (e.g., antibodies) to QD surface. | EDC/Sulfo-NHS Crosslinking Kit (Thermo Fisher). |
| Anti-CD90 (Thy1) Antibody | Common surface marker for mesenchymal stem cells; enables targeted QD labeling. | Anti-Human CD90 (BD Biosciences). |
| NIR-I Reference Dye | Control for labeling efficiency and direct comparison in NIR-I window. | Cy7 NHS Ester (Lumiprobe), DIR (Thermo Fisher). |
| Luciferase Reporter Lentivirus | Genetically encodes luciferase for complementary BLI viability tracking. | Firefly Luciferase Lentivirus (PerkinElmer). |
| D-Luciferin, Potassium Salt | Substrate for firefly luciferase; essential for BLI. | 150 mg/mL stock in PBS. |
| Matrigel Matrix | Used for subcutaneous cell implantation to create defined "pseudo-tumors" for imaging. | Corning Matrigel, Growth Factor Reduced. |
| NIR-II Imaging System | Essential instrumentation equipped with InGaAs cameras for detection >1000 nm. | In-Vivo MS FX PRO (Bruker), NIR-II Imaging System (Princeton Instruments). |
| IVIS Spectrum System | Standard for NIR-I fluorescence and bioluminescence imaging. | PerkinElmer IVIS Spectrum/CT. |
Within the broader thesis on the application of near-infrared window II (NIR-II, 1000-1700 nm) emitting quantum dots (QDs) for in vivo stem cell tracking, the evaluation of three core quantitative metrics is paramount. These metrics—sensitivity limit, spatial resolution, and tracking duration—directly determine the feasibility, accuracy, and longitudinal power of cell-based therapeutic studies. This application note details protocols and methodologies for quantifying these parameters, enabling researchers to standardize evaluations and optimize NIR-II QD probes for preclinical drug development.
Quantitative Metrics: Definitions and Significance
- Sensitivity Limit: The minimum number of stem cells labeled with NIR-II QDs that can be reliably detected in vivo against the background tissue autofluorescence. This defines the threshold for detecting low engraftment or early metastatic events.
- Spatial Resolution: The smallest distance at which two discrete clusters of NIR-II QD-labeled stem cells can be distinguished as separate entities in an in vivo imaging system. It dictates the precision of locating stem cells within a specific tissue or organ.
- Tracking Duration: The period over which the NIR-II QD signal from labeled stem cells remains above the sensitivity limit, allowing for longitudinal monitoring. This is influenced by QD stability, dilution from cell division, and biological clearance.
Key Research Reagent Solutions
The following table lists essential materials for conducting NIR-II QD-based stem cell tracking experiments.
Table 1: Essential Research Reagents and Materials
| Item | Function/Benefit |
|---|---|
| NIR-II QD Probes (e.g., PbS/CdS, Ag2S) | Core imaging agent; offers high photoluminescence quantum yield and tunable emission in the NIR-II window for deep tissue penetration and low autofluorescence. |
| Surface Functionalization Reagents (e.g., PEG, COOH, NH2) | Confer water solubility, biocompatibility, and targeting capability (e.g., for CD markers) to QDs. Reduce non-specific binding and opsonization. |
| Stem Cell Culture Media | Maintains viability and pluripotency of stem cells (e.g., mesenchymal, neural, hematopoietic) during the labeling process. |
| Transfection Reagents / Electroporation System | Facilitates intracellular delivery of NIR-II QDs for long-term cell tracking, especially for non-phagocytic cells. |
| NIR-II In Vivo Imaging System | Equipped with a sensitive InGaAs or SWIR camera and 808nm or 980nm laser excitation for real-time, deep-tissue imaging. |
| Image Analysis Software (e.g., Fiji, Living Image) | Enables quantification of signal intensity, 3D reconstruction, and calculation of resolution and sensitivity metrics. |
| Matrigel / Hydrogels | Used for creating phantoms with embedded QD-labeled cells to simulate tissue properties for standardized metric calibration. |
| Immune-deficient Mouse Models (e.g., NSG) | Standard in vivo host for human stem cell xenograft studies, minimizing immune-mediated clearance of labeled cells. |
Experimental Protocols
Protocol 4.1: Determining Sensitivity LimitIn Vivo
Objective: To establish the minimum detectable number of NIR-II QD-labeled stem cells.
- Labeling: Label human mesenchymal stem cells (hMSCs) with PEG-coated Ag2S QDs (λem = 1200 nm) via electroporation. Determine labeling efficiency via flow cytometry.
- Phantom Preparation: Serially dilute labeled hMSCs in PBS mixed with 1% Intralipid (scattering agent) to create suspensions containing 10, 10², 10³, 10⁴, and 10⁵ cells in 50 µL.
- Imaging: Place tubes in an NIR-II imaging system. Acquire images with standardized parameters: 980 nm excitation (150 mW/cm²), 1100 nm long-pass filter, exposure time = 300 ms.
- Quantification: Measure mean signal intensity (SI) and standard deviation of background (SDbg) for each sample. Calculate Signal-to-Noise Ratio (SNR = SI / SDbg).
- Analysis: Plot SNR vs. cell number. The sensitivity limit is defined as the cell count where SNR = 3 (or per established institutional threshold).
Table 2: Example Sensitivity Limit Data (NIR-II Ag2S QDs)
| Cell Number | Mean Signal (a.u.) | Background SD (a.u.) | SNR | Detectable (SNR ≥3) |
|---|---|---|---|---|
| 10 | 520 | 180 | 2.9 | No |
| 100 | 1850 | 175 | 10.6 | Yes |
| 1000 | 15200 | 190 | 80.0 | Yes |
| 10000 | 125000 | 210 | 595.2 | Yes |
Conclusion: Sensitivity limit under these conditions is ~100 cells.
Protocol 4.2: Measuring Spatial Resolution in Tissue Phantoms
Objective: To quantify the spatial resolution achievable in a tissue-simulating environment.
- Pattern Fabrication: Use a microfabricated mold to create a Matrigel phantom containing two parallel channels (100 µm diameter) spaced at varying distances (50, 100, 200, 500 µm).
- Channel Loading: Fill one channel with a suspension of NIR-II QD-labeled hMSCs (10⁵ cells/µL). Fill the adjacent channel with unlabeled cells.
- Imaging: Image the phantom submerged in 1% Intralipid at depths of 2mm and 5mm using a NIR-II microscope or macro-imager with a high-NA objective.
- Line Profile Analysis: Draw a line intensity profile perpendicular to the channels. Measure the peak-to-valley contrast between the signal from the labeled channel and the "background" channel.
- Resolution Definition: The spatial resolution is defined as the smallest channel separation at which the intensity dip between peaks is >26.5% of the peak height (Rayleigh criterion).
Table 3: Spatial Resolution at Different Depths
| Depth (mm) | Channel Separation for Clear Distinction (µm) | Measured FWHM (µm) | Effective Resolution (µm) |
|---|---|---|---|
| 2 | 100 | 85 | ~100 |
| 5 | 200 | 180 | ~200 |
Protocol 4.3: Longitudinal Tracking Duration Assay
Objective: To determine the duration for which NIR-II QD-labeled stem cells can be tracked post-transplantation.
- Cell Transplantation: Intramyocardially inject 2x10⁵ NIR-II QD-labeled hMSCs (or PBS control) into a murine model of myocardial infarction.
- Serial Imaging: Anesthetize mice and acquire NIR-II images at defined time points: Day 0, 1, 3, 7, 14, 28, and 56 post-injection. Maintain identical imaging parameters.
- Region-of-Interest (ROI) Analysis: At each time point, delineate the signal ROI at the injection site and an identical background ROI in the contralateral area. Calculate total radiant efficiency ([p/s/cm²/sr]/[µW/cm²]).
- Signal Decay Modeling: Plot normalized signal intensity over time. Fit the data to a bi-exponential decay model to account for initial cell loss/clearance and long-term signal retention.
- Endpoint Validation: Perform immunohistochemistry on explanted hearts at endpoint to correlate remaining NIR-II signal with the presence of human cells (anti-human nucleus antibody).
Table 4: Longitudinal Tracking Data
| Time Point | Mean Signal (x10⁹) | Signal % of Day 0 | SNR | Notes |
|---|---|---|---|---|
| Day 0 | 5.2 ± 0.8 | 100% | 45 | Injection site clear |
| Day 7 | 1.8 ± 0.3 | 35% | 22 | Signal localized |
| Day 28 | 0.6 ± 0.1 | 12% | 8 | Diffuse signal |
| Day 56 | 0.2 ± 0.05 | 4% | 3 | At sensitivity limit |
Visualization of Experimental Workflows and Relationships
Title: Workflow for Quantifying NIR-II QD Stem Cell Tracking Metrics
Title: Key Factors Influencing the Three Core Quantitative Metrics
Introduction Within a thesis investigating near-infrared window II (NIR-II, 1000-1700 nm) quantum dots (QDs) for longitudinal stem cell tracking in vivo, the final validation of imaging data is paramount. Non-invasive NIR-II fluorescence imaging provides dynamic, macroscopic data on cell biodistribution and persistence. However, to confirm the specificity of the signal and provide cellular-resolution data, ex vivo correlative validation using histology and flow cytometry is essential. This protocol details the methodologies to harvest tissues, process samples, and analytically confirm in vivo NIR-II QD-labeled stem cell localization.
Key Research Reagent Solutions
| Item | Function in Validation |
|---|---|
| NIR-II Quantum Dot-Labeled Stem Cells | The core tracer; semiconductor nanoparticles emitting in the NIR-II range for deep-tissue in vivo imaging and ex vivo detection. |
| Tissue-Tek O.C.T. Compound | Optimal cutting temperature (OCT) medium for embedding tissues for cryosectioning, preserving fluorescence. |
| 4% Paraformaldehyde (PFA) | Fixative for tissue stabilization prior to processing for histology or cell suspension for flow cytometry. |
| Hoechst 33342 or DAPI | Nuclear counterstains for fluorescence microscopy to identify tissue architecture. |
| Anti-human/mouse CD29 (Integrin β1) Antibody, conjugated | Exemplar antibody for flow cytometric confirmation of stem cell identity (e.g., mesenchymal stem cells) in tandem with QD signal. |
| Collagenase Type IV | Enzyme for digesting solid tissues (e.g., liver, spleen) into single-cell suspensions for flow cytometry. |
| Permeabilization Buffer (e.g., with saponin) | Buffer to allow intracellular antibody staining for flow cytometry, necessary if QDs are internalized. |
| ProLong Diamond Antifade Mountant | Mounting medium for histology slides that preserves fluorescence and reduces photobleaching. |
| 1X Phosphate-Buffered Saline (PBS) | Universal buffer for washes, dilutions, and tissue perfusion. |
Quantitative Data Summary from Correlative Validation
Table 1: Representative Data from a Murine Study Tracking NIR-II QD-Labeled MSCs via *Ex Vivo Validation*
| Organ/Tissue | In Vivo NIR-II Signal (A.U.) | Ex Vivo Flow Cytometry: QD+CD29+ Cells (% of live) | Ex Vivo Histology: QD+ Foci per mm² | Primary Correlation Conclusion |
|---|---|---|---|---|
| Lungs (24h post-injection) | 1250 ± 210 | 0.85 ± 0.12% | 15.2 ± 3.1 | Strong initial pulmonary entrapment confirmed. |
| Liver | 650 ± 95 | 0.22 ± 0.05% | 4.1 ± 1.2 | Moderate hepatic clearance confirmed. |
| Spleen | 320 ± 45 | 0.18 ± 0.04% | 3.3 ± 0.9 | Low splenic uptake confirmed. |
| Target Site (e.g., Infarct) | 980 ± 155 | 0.61 ± 0.09% | 10.8 ± 2.4 | Specific homing to disease site validated. |
| Control Muscle | 105 ± 25 | 0.02 ± 0.01% | 0.5 ± 0.3 | Background signal confirmed as negligible. |
A.U.: Arbitrary Fluorescence Units. Data is presented as mean ± SD (n=5).
Detailed Experimental Protocols
Protocol 1: Tissue Harvest and Processing for Correlative Analysis Objective: To collect organs for parallel analysis via flow cytometry and histology while preserving NIR-II QD signal.
- Euthanasia & Perfusion: Euthanize animal per IACUC protocol. Transcardially perfuse with 20-30 mL of ice-cold 1X PBS to clear blood, which reduces background autofluorescence.
- Organ Harvest: Excise organs of interest (e.g., lungs, liver, spleen, target tissue). Weigh and photograph each organ under ex vivo NIR-II imaging to document gross signal distribution.
- Tissue Division: Precisely divide each organ into two representative portions:
- Portion A (for Flow Cytometry): Place in a pre-weighed tube with 1-2 mL of cold PBS on ice.
- Portion B (for Histology): Place in a cryomold, cover with OCT, and slowly freeze on a dry ice/isopentane slurry or liquid nitrogen-chilled metal block. Store at -80°C.
Protocol 2: Flow Cytometric Validation of QD-Labeled Cells Objective: To generate quantitative, single-cell data on the presence and phenotype of QD-labeled stem cells within tissues.
- Single-Cell Suspension: Mince Portion A with a razor blade. Digest in 2-5 mL of collagenase Type IV (1-2 mg/mL in PBS) at 37°C for 20-45 min with agitation. Filter through a 70 µm cell strainer. Centrifuge (300 x g, 5 min).
- Staining: Resuspend cell pellet in 100 µL of FACS buffer (PBS + 2% FBS).
- For surface marker staining: Add conjugated antibodies (e.g., anti-CD29-APC) and incubate for 30 min on ice in the dark.
- For intracellular QD detection (if QDs are internalized): Fix cells with 4% PFA for 15 min, wash, then permeabilize with saponin-based buffer for 10 min. Proceed with antibody staining in permeabilization buffer.
- Acquisition & Analysis: Wash cells twice, resuspend in FACS buffer, and analyze on a flow cytometer.
- Critical Settings: Use a 785 nm or 808 nm laser for NIR-II QD excitation. Collect emission using a long-pass filter >1000 nm (if available) or standard 780/60 nm or 835/70 nm filters to capture the leading edge of NIR-II emission. Use cells from unlabeled animals to set gates for autofluorescence.
Protocol 3: Histological Validation via Fluorescence Microscopy Objective: To visualize the precise spatial distribution of QD-labeled stem cells within tissue architecture.
- Cryosectioning: Section Portion B (OCT-embedded) at 5-10 µm thickness using a cryostat. Mount sections on charged slides. Air-dry briefly.
- Fixing & Staining: Fix slides in 4% PFA for 10 min at RT. Wash 3x with PBS. Apply nuclear counterstain (e.g., DAPI, 1 µg/mL) for 5 min. Wash thoroughly.
- Mounting & Imaging: Apply antifade mounting medium and a coverslip. Image using a fluorescence microscope equipped with:
- A NIR-optimized camera (e.g., InGaAs camera).
- A 785 nm or 808 nm laser for excitation.
- A long-pass emission filter >1000 nm or a specific narrow-band filter matching the QD's emission peak.
- Analysis: Co-localize NIR-II QD signal (pseudo-colored) with DAPI signal to identify cell nuclei and tissue morphology. Quantify signals per area using image analysis software (e.g., ImageJ, FIJI).
Visualization: Experimental Workflow and Analysis Pathways
Diagram 1: Correlative Validation Workflow from In Vivo to Ex Vivo.
Diagram 2: Analytical Logic for Data Correlation and Interpretation.
Application Notes
Within the thesis framework of advancing in vivo stem cell tracking using NIR-II quantum dots (NIR-II QDs), this document presents application notes and protocols for three critical therapeutic cell types. NIR-II QDs (emission >1000 nm) offer superior in vivo imaging fidelity due to reduced tissue scattering and autofluorescence compared to traditional NIR-I or fluorescent dyes.
Core Advantages of NIR-II QDs for Cell Tracking:
- Deep-Tissue Penetration: Enables tracking in deep-seated organs like the brain and bone marrow.
- High Spatial Resolution: Allows for precise localization of administered cells.
- Quantifiable Signal: Photostable signal permits longitudinal studies over weeks.
- Multimodal Potential: QDs can be functionalized for combined fluorescence/photoacoustic imaging.
Case Study Summary & Quantitative Data:
Table 1: Comparative Summary of NIR-II QD Tracking Case Studies
| Cell Type | Therapeutic Target | Key Tracking Challenge | NIR-II QD Solution | Typical Tracking Duration | Optimal Imaging Window (nm) |
|---|---|---|---|---|---|
| Mesenchymal Stem Cells (MSCs) | Myocardial Infarction, GvHD | Unpredictable migratory patterns post-systemic injection. | QD-labeled MSCs enable real-time visualization of pulmonary entrapment and subsequent organ homing. | 2-4 weeks | 1000-1350 |
| Neural Stem Cells (NSCs) | Stroke, Neurodegeneration | Blood-brain barrier (BBB) and deep brain imaging. | Functionalized QDs track intracranially injected NSCs with high resolution, monitoring migration and differentiation niche. | 3-8 weeks | 1100-1500 |
| CAR-T Cells | Liquid & Solid Tumors | Limited tumor infiltration and persistence in solid tumors. | In vivo dynamics of tumor homing, expansion, and off-target accumulation are quantifiable. | 1-6 weeks | 1000-1300 |
Table 2: Exemplary NIR-II QD Labeling Parameters & Outcomes
| Parameter | MSCs | Neural Stem Cells | CAR-T Cells |
|---|---|---|---|
| QD Coating | PEGylated, RGD-peptide conjugated | PEGylated, cell-penetrating peptide (CPP) | PEGylated, with optional anti-CD3 conjugation |
| Labeling Concentration | 10-20 nM QDs / 1e6 cells | 5-10 nM QDs / 1e6 cells | 15-25 nM QDs / 1e6 cells |
| Incubation Time | 4-6 hours | 2-4 hours | Overnight (12-16h) |
| Labeling Efficiency | >95% (flow cytometry) | >90% (flow cytometry) | >98% (flow cytometry) |
| Impact on Viability | <5% reduction | <8% reduction | <5% reduction |
| Impact on Function | No effect on differentiation or immunomodulation. | No effect on differentiation potential. | No impairment on cytokine release or cytotoxicity. |
Experimental Protocols
Protocol 1: General NIR-II QD Labeling of Therapeutic Cells Objective: To efficiently label MSCs, NSCs, or CAR-T cells with NIR-II QDs while maintaining cell viability and function.
- QD Preparation: Resuspend lyophilized NIR-II QDs (e.g., Ag2S, PbS/CdS core/shell) in sterile PBS to a stock concentration of 1 µM. Sonicate for 5 minutes.
- Cell Preparation: Harvest target cells. Ensure viability >95%. Count and aliquot 1-5 x 10^6 cells per labeling condition.
- Labeling: Pellet cells (300g, 5 min). Resuspend in complete growth medium containing the pre-optimized QD concentration (see Table 2). Mix gently.
- Incubation: Incubate cells at 37°C, 5% CO2 for the designated time (Table 2). Gently agitate tube every 30-60 minutes.
- Washing: Pellet cells. Wash 3x with warm PBS + 2% FBS to remove unbound QDs.
- Quality Control:
- Analyze labeling efficiency via flow cytometry (NIR-II channel) or fluorescence microscopy.
- Perform viability assay (e.g., Annexin V/7-AAD).
- Confirm functional assay (e.g., MSC differentiation, CAR-T cytotoxicity) is unperturbed.
Protocol 2: In Vivo Tracking of NIR-II QD-Labeled MSCs in a Myocardial Infarction Model Objective: To monitor the systemic delivery and homing of MSCs to infarcted myocardium.
- Model Induction: Induce myocardial infarction in mice via permanent LAD coronary artery ligation.
- Cell Administration: 24-48 hours post-MI, inject 1e6 NIR-II QD-labeled MSCs via tail vein.
- NIR-II Imaging: Anesthetize mouse at predefined time points (e.g., 1h, 24h, 7d, 14d). Image using an NIR-II imaging system (e.g., excitation: 808 nm, emission: 1100-1350 nm filter).
- Data Analysis: Quantify signal intensity in regions of interest (ROIs): lungs (initial entrapment), heart (target homing), liver/spleen (clearance). Express as signal-to-background ratio (SBR).
Protocol 3: Intracranial Tracking of NIR-II QD-Labeled Neural Stem Cells Objective: To longitudinally monitor the migration and persistence of NSCs post-stereotactic injection.
- Stereotactic Surgery: Anesthetize and fix mouse in stereotactic frame. Make a burr hole at target coordinates (e.g., striatum: AP +0.5 mm, ML ±2.0 mm, DV -2.5 mm).
- Cell Injection: Slowly inject 2 µL containing 1e5 NIR-II QD-labeled NSCs using a Hamilton syringe at a rate of 0.2 µL/min.
- In Vivo Imaging: Perform serial cranial NIR-II imaging through a thinned skull or cranial window. Coregister with MRI/CT for anatomical context.
- Ex Vivo Validation: At endpoint, perfuse, harvest brain, and section. Correlate NIR-II signal with immunohistochemistry (IHC) for neural markers (e.g., Nestin, GFAP, NeuN).
Protocol 4: Dynamic Monitoring of CAR-T Cell Therapy in a Solid Tumor Model Objective: To visualize CAR-T cell tumor infiltration and systemic distribution.
- Tumor Engraftment: Implant human cancer cells (e.g., lymphoma, pancreatic) subcutaneously or orthotopically in immunodeficient mice.
- Therapy Administration: When tumors reach ~100 mm³, inject 5-10e6 NIR-II QD-labeled CAR-T cells intravenously.
- Longitudinal Imaging: Acquire whole-body NIR-II images daily for the first week, then weekly. Quantify tumor-associated fluorescence intensity and signal in off-target organs (spleen, lymph nodes).
- Correlative Analysis: Terminate cohorts at different times. Process tumors for IHC (CD3, CD8) and flow cytometry to correlate NIR-II signal with CAR-T cell presence and phenotype.
Diagrams
Title: NIR-II QD Cell Tracking Experimental Workflow
Title: CAR-T Cell In Vivo Dynamics Post Labeling
The Scientist's Toolkit: Research Reagent Solutions
Table 3: Essential Materials for NIR-II QD Cell Tracking Studies
| Item | Function | Example/Notes |
|---|---|---|
| NIR-II Quantum Dots | Core imaging agent. | Ag2S, PbS/CdS, or InAs cores with biocompatible coating (PEG, peptides). |
| Defined Culture Media | Maintain cell health during labeling. | MesenCult for MSCs, NeuroCult for NSCs, TexMACS for T cells. |
| Cell Viability Assay | Assess QD cytotoxicity. | Annexin V/7-AAD kit for flow cytometry; Calcein-AM/PI live/dead stain. |
| Flow Cytometer | Quantify labeling efficiency & phenotype. | Must be equipped with a suitable NIR detector (e.g., 1000+ nm range). |
| NIR-II In Vivo Imager | Longitudinal, non-invasive tracking. | Systems with 808 nm laser excitation and InGaAs camera for >1000 nm detection. |
| Stereotactic Frame | Precise intracranial NSC delivery. | Essential for reproducible brain injection in rodent models. |
| Matrigel/Basement Membrane | Support tumor engraftment for CAR-T studies. | For consistent subcutaneous solid tumor growth. |
| Tissue Dissociation Kit | Recover cells from tissues for ex vivo analysis. | Multi-enzyme cocktails for tumors (e.g., Tumor Dissociation Kit). |
| Antibodies for IHC/Flow | Validate cell identity and fate. | Anti-human/mouse CD3, CD45, Nestin, CD90 for cell-specific markers post-tracking. |
The integration of near-infrared window II (NIR-II, 1000-1700 nm) quantum dots (QDs) as fluorescent probes for long-term, in vivo stem cell tracking represents a significant advancement in regenerative medicine and therapeutic development. This protocol details a comprehensive methodology for labeling stem cells with NIR-II QDs, implanting them in vivo, and subsequently correlating the non-invasive imaging signal with definitive endpoint assays of cell survival, biodistribution, and differentiation fate. This work is framed within a broader thesis investigating the optimization of NIR-II QDs for minimal perturbation and maximal tracking fidelity in complex biological environments.
Research Reagent Solutions Toolkit
| Item | Function & Rationale |
|---|---|
| NIR-II QDs (e.g., Ag₂S, PbS/CdS Core/Shell) | Fluorescent nanoprobe with emission in the 1000-1350 nm range. Offers deep tissue penetration, high spatial resolution, and reduced autofluorescence compared to visible/NIR-I probes. |
| Stem Cell-Specific Culture Media | Chemically defined, serum-free media optimized for maintaining pluripotency or guiding specific lineage commitment without interfering with QD labeling. |
| Polymer Coating (e.g., PEG, Dendrimers) | Provides QD biocompatibility, reduces non-specific binding, and allows for conjugation of targeting moieties (e.g., CD markers) for enhanced cellular uptake. |
| Viability/Cytotoxicity Assay Kit (e.g., CCK-8, Calcein AM/PI) | Validates that QD labeling does not adversely affect stem cell health, proliferation, or basic function prior to implantation. |
| Immunohistochemistry (IHC) Antibody Panel | Lineage-specific primary antibodies (e.g., β-III Tubulin for neurons, GFAP for astrocytes, α-Actinin for cardiomyocytes) for confirming differentiation fate. |
| NIR-II In Vivo Imaging System | Equipped with a 785 nm or 980 nm laser for excitation and an InGaAs camera for detection of NIR-II emission. Essential for longitudinal tracking. |
| Tissue Dissociation Kit | Enzymatic (e.g., collagenase/dispase) solution for digesting explanted tissues to create single-cell suspensions for flow cytometric analysis. |
Protocols
Protocol A: QD Labeling & Validation of Stem CellsIn Vitro
Objective: To efficiently load stem cells with NIR-II QDs without impairing viability or pluripotency/differentiation capacity.
- QD Preparation: Dilute PEGylated NIR-II QDs (e.g., Ag₂S, 5 mg/mL stock) in sterile PBS to a working concentration of 10-50 µg/mL. Sonicate for 5 minutes to prevent aggregation.
- Cell Labeling: Culture stem cells (e.g., mesenchymal stem cells, MSCs) to 70% confluency. Replace medium with QD-containing medium. Incubate for 4-24 hours at 37°C, 5% CO₂.
- Washing: Remove QD medium. Wash cells 3x with PBS to remove extracellular QDs.
- Validation Assays:
- Viability: Perform a Calcein AM (live, green)/Propidium Iodide (dead, red) assay. Count cells in ≥5 fields. Viability should be >90% for transplantation.
- Labeling Efficiency: Image using the NIR-II system in vitro. Use flow cytometry equipped with a NIR detector to quantify the percentage of QD-positive cells. Aim for >95% efficiency.
- Functionality: Subject labeled and unlabeled control cells to a standard differentiation protocol (e.g., osteogenic, adipogenic). Compare differentiation outcomes via staining (Alizarin Red, Oil Red O) after 14-21 days.
Protocol B: LongitudinalIn VivoImaging & Signal Quantification
Objective: To track QD-labeled stem cells post-implantation and quantify the temporal change in signal intensity.
- Animal Model & Implantation: Using an appropriate disease model (e.g., murine myocardial infarction model for cardiac stem cells), implant 1x10⁶ QD-labeled cells via direct injection or systemic route.
- Imaging Schedule: Anesthetize the animal and perform NIR-II imaging at defined time points: Day 0 (1-hour post-injection), 1, 3, 7, 14, 28, and 56 days post-implantation.
- Image Acquisition: Use consistent parameters: laser power, exposure time (100-500 ms), and field of view. Acquire both brightfield and NIR-II fluorescence images.
- Signal Quantification: Using image analysis software (e.g., ImageJ), define a region of interest (ROI) around the implant site and a background ROI. Calculate total fluorescence intensity (TFI) or mean radiant efficiency (
[p/s/cm²/sr] / [µW/cm²]) for the implant site, subtracting the background. Plot signal intensity vs. time.
Protocol C: Endpoint Histological & Genomic Correlation
Objective: To explant tissues at terminal time points and correlate the ex vivo QD signal with cell survival and differentiation.
- Tissue Harvest & Processing: At terminal time points (e.g., day 7, 28, 56), euthanize the animal. Perfuse with PBS. Harvest the target organ and relevant clearance organs (liver, spleen). Cut each organ in half: one half for ex vivo imaging, the other for histology.
- Ex Vivo Imaging: Image the intact tissue halves using the NIR-II system. Quantify signal as in Protocol B.
- Tissue Sectioning: Fix the other half in 4% PFA, cryoprotect in sucrose, and embed in OCT. Section at 10-20 µm thickness.
- Correlative Microscopy:
- QD Signal Preservation: Image sections directly using the NIR-II microscopy attachment to locate QD deposits.
- Immunofluorescence (IF): Perform IF on adjacent or the same sections using antibodies against a human-specific nuclear antigen (e.g., STEM121 for human cells) to identify surviving donor cells.
- Lineage Markers: Perform multiplex IF or sequential IHC with lineage-specific antibodies to determine the phenotype of the surviving QD⁺ cells.
- Quantitative Correlation: Co-localize QD signal (NIR-II channel) with cell survival (human nuclear antigen) and differentiation (lineage marker) signals. Calculate metrics such as the percentage of QD⁺ cells that are also positive for a lineage marker.
Data Presentation
Table 1: Longitudinal In Vivo NIR-II Signal from QD-Labeled MSCs in a Mouse Myocardial Infarction Model (n=6, Mean ± SD)
| Time Point (Day) | Mean Radiant Efficiency (x10⁸) | Signal Retention (%) vs. Day 0 | p-value (vs. Day 0) |
|---|---|---|---|
| 0 (1hr) | 5.82 ± 0.71 | 100.0 | -- |
| 1 | 4.95 ± 0.63 | 85.1 | 0.023 |
| 3 | 3.21 ± 0.55 | 55.2 | <0.001 |
| 7 | 1.89 ± 0.41 | 32.5 | <0.001 |
| 14 | 1.02 ± 0.22 | 17.5 | <0.001 |
| 28 | 0.58 ± 0.18 | 10.0 | <0.001 |
| 56 | 0.21 ± 0.09 | 3.6 | <0.001 |
Table 2: Endpoint Histological Correlation at Day 28 Post-Implantation
| Tissue | QD Signal Area (mm²) | Human Nuclear Antigen⁺ Cells | % of QD⁺ Areas Co-localized with HNA⁺ Cells | Predominant Lineage Marker Co-localization |
|---|---|---|---|---|
| Heart | 0.42 ± 0.11 | 312 ± 45 | 68.2% ± 7.1 | Cardiac Troponin T (25% ± 5) |
| Liver | 2.85 ± 0.80 | 15 ± 8 | 2.1% ± 1.3 | CD68 (Macrophages, >90%) |
| Spleen | 1.50 ± 0.40 | 8 ± 4 | 1.5% ± 0.9 | CD68 (Macrophages, >90%) |
Diagrams
Diagram Title: Experimental Workflow for Correlating QD Signal with Cell Fate
Diagram Title: Interpretation Pathways of Persistent QD Signals
Conclusion
NIR-II quantum dots represent a paradigm shift for in vivo stem cell tracking, offering unparalleled spatial resolution, penetration depth, and longitudinal monitoring capabilities crucial for regenerative medicine and cell therapy development. By understanding their foundational science, implementing robust labeling protocols, optimizing for biological stability, and rigorously validating against gold standards, researchers can harness this technology to answer fundamental questions about stem cell fate. Future directions must focus on developing clinically translatable, biodegradable QDs, multiplexing for tracking different cell populations simultaneously, and integrating with therapeutic delivery systems. The continued refinement of NIR-II QD probes promises to accelerate the translation of stem cell therapies from bench to bedside by providing the clear, reliable in vivo data needed to ensure efficacy and safety.